By James Ferguson

They who can give up essential liberty to obtain a little temporary safety, deserve neither liberty nor safety
Benjamin Franklin
Whilst my note on the false positive rate (FPR) made its way into the corridors of power, the Health Department’s response was at once dismissive but innumerate. Fortunately, not all parliamentarians are so easily fobbed off and one has asked me to prepare a brief, which is why the following is not in the usual format.
It appears that the number of amplification cycles used in PCR tests, whether there is any quality control, the false positive rate (for both Pillar 1 and Pillar 2) and the incidence of the disease are all state secrets. However, what is clear is that none of those wielding the controls understand the maths.
Both Secretary of State, Matt Hancock (who says the FPR is “under 1%”) and Baroness Harding’s chief medical advisor, Dr Susan Hopkins (definitely less than 1-in-100 and more likely 1-in-1000) believe the FPR is so low as to result in what Hancock calls a “very small proportion of false positives”.
In fact, even a FPR as fancifully low as 0.1% (and there is a mass of evidence to suggest it is 10-20x higher than that) would mean that 4 out of 5 positives were false.
1% false positive rate does NOT mean 1% of positives are false
Transcript, Matt Hancock TalkRadio interview with Julia Hartley-Brewer, 8.42am Fri 18th Sept
JHB: “What is the FPR on the testing we’re doing in the community?
MH: Under 1%.
JHB: It’s under 1%. Even around under 1%… do you know the exact rate?
MH: It’s um.. well, under 1% means that for all the positive cases the likelihood of one being a false positive is very small.
JHB: I understand what under 1% means. But do you have the exact figure for what it is?
MH: We do. We do. I don’t have it in my head. I know that the specificity is what it’s called of the PCR test is over 99%… But Julia, I can see the thrust of the questions and what I can tell you is that we take into account, of course we do, the issue of the very small proportion of false positives (my bold).
If incidence is < the FPR, most positives are false
The Secretary of State for Health, Matt Hancock, seems to think that a false positive rate (FPR) of 1% means that 1% of positives are false but what it actually means is that 1% of all negatives will test positive. If the incidence is lower than the FPR, more than half of all positives are false. Hancock is dangerously and complacently unaware that when incidence is low, up to 99% of all ‘cases’ might be false positives. This relationship is illustrated by the matrix below (FPR down the left-hand side and incidence along the top).
Matrix: % of ‘cases’ that are false positive
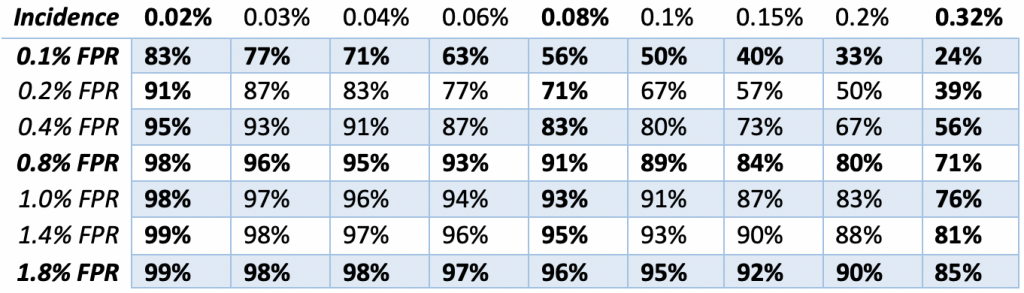
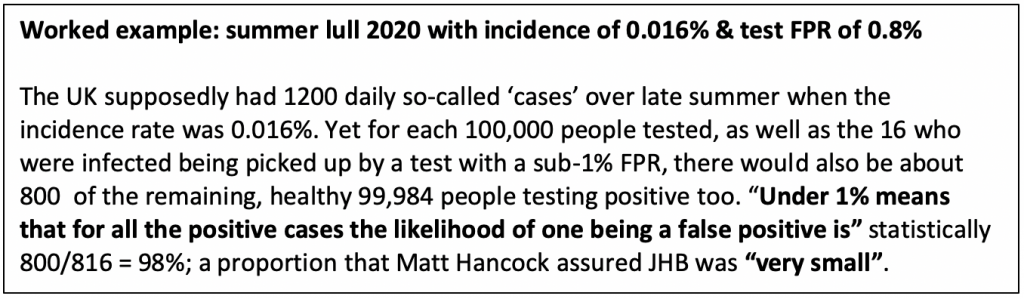
Results from a pilot survey of 35,000 people by ONS ‘academic partners’ found household incidence peaked on 26 April at 0.32% (right-hand column above) before ‘stabilising’ at 0.08% (centre column) by the end of the study period on 28th June. However, after that, NHS daily ‘estimated admissions’ fell another 80% from 246 on 28th June, to < 50 by late August, which implies that incidence declined to 0.016%, a level that renders 98-99% the 1,200+ daily ‘cases’ reported at that time ‘false’ (see matrix above).
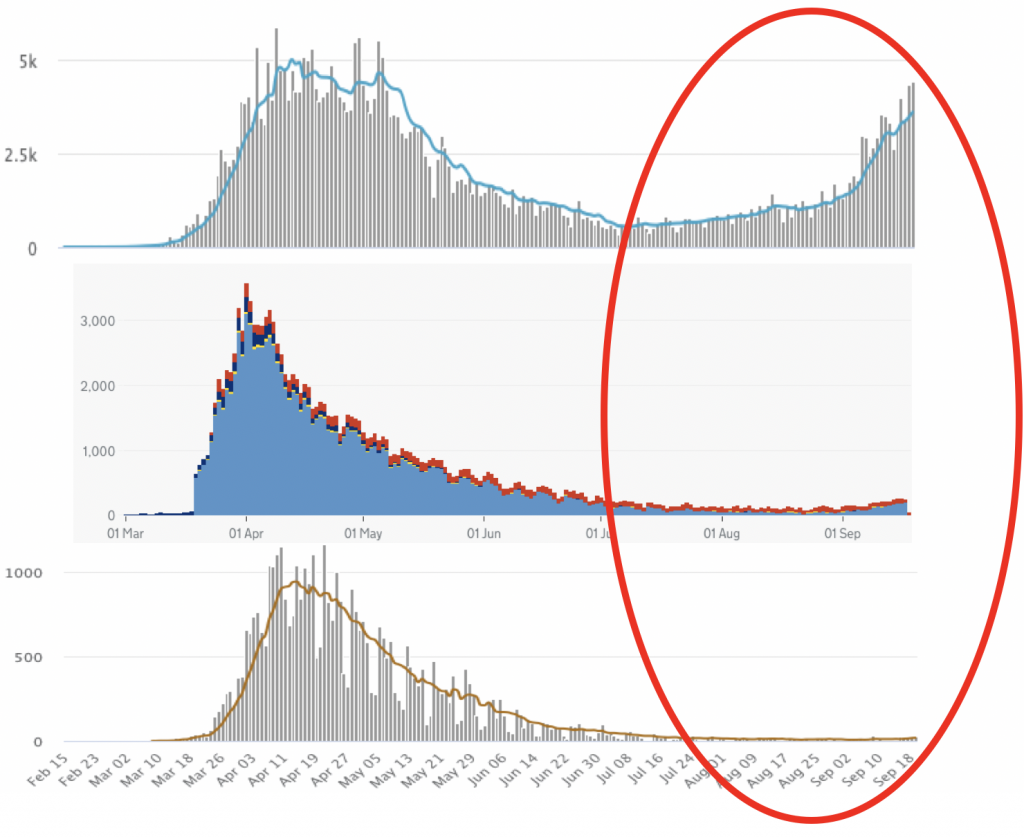
Positives are not ‘cases’
By 1st September, UK ‘cases’ had risen 2.5x from the 8th July low, yet hospitalisations (incidence) were down by three quarters. Which is the signal and which the noise? In April we were getting 5,000 cases a day from less than 20,000 tests (25%). Today we are getting 4,400 ‘cases’ from 235,000 tests (1.9%) 70% of which are being analysed by people who weren’t even doing this job in April.
The signal and the noise
The very low level of NHS diagnoses (only about 37 a day by early September) compared to the large number of Pillar 2 tests suggests that > 90% of Pillar 2 tests are taken by people who are asymptomatic (demand is now 4x capacity). So, since 28th June, only 6.5% (3,638) out of 56,047 ‘cases’ during July and August were confirmed by NHS England diagnoses. If most Pillar 2 subjects are asymptomatic, then their selection is close to random and the consistent 2% Pillar 2 positivity is indicative of the underlying FPR (making the Pillar 2 FPR up to 200x higher than the 0.1% that ONS assumes for NHS-lab Pillar 1) and explains the huge discrepancy between positives (top), which are almost back to April highs and the hard data on hospitalisations (middle) and deaths (bottom), which are barely off the floor. The plan to increase tests to 10m per day will guarantee that all tests are effectively random (i.e. asymptomatic), so we will keep finding ever more ‘cases’, no matter the incidence.
Amplification: why the analytical FPR is ~1%, not 0.1%
PHE consultant Dr Susan Hopkins provided Baroness Dido Harding with a “rapid off my head (sic) response that could be used” clearly intended to dismiss the warnings about false positives out of hand, rather than invite further informative discussion. Hopkins confirmed a “population prevalence < 0.02%” whilst insisting that all serological tests (Pillars 1, 2 and 4) had FPRs that are “definitely less than 1 in 100 and… more likely 1 in 1000.” Yet she did not seem to understand the mathematical implications. With 0.02% incidence, a FPR of “1 in 1000” means 83% of positives are false, whilst “1 in 100” means 98% would be. Does H3 (Hancock, Harding and Hopkins) seriously not know this?
Amplifying the inaccuracy
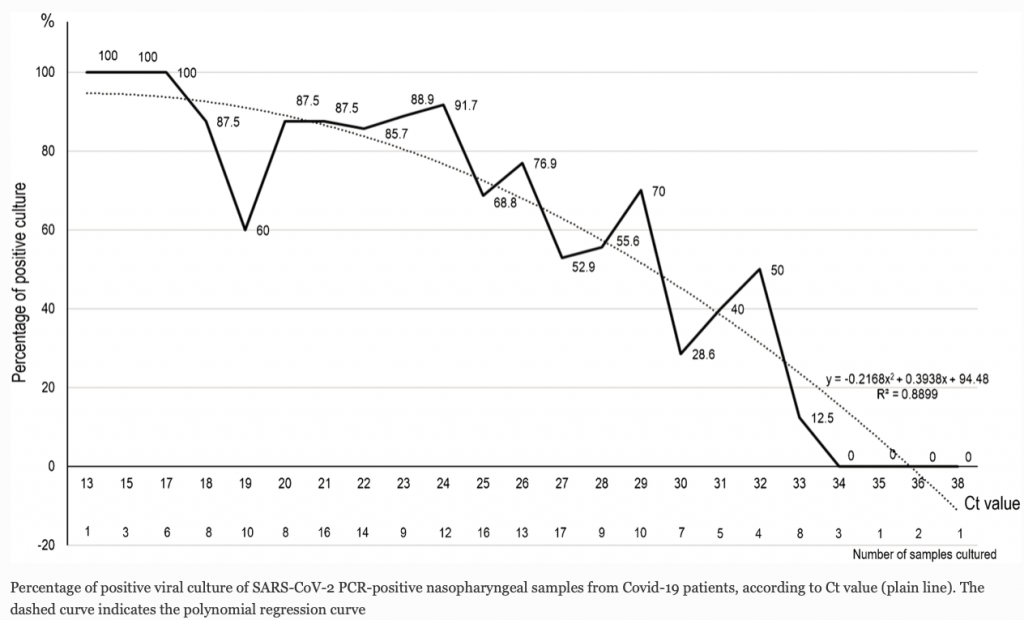
However, there is very little chance that the FPR is as low as 1-in-1000 for two important reasons. The first is that the cycle threshold (Ct) used to establish the original ONS 0.1% FPR must have been far lower than the Ct in use today. Fear that the false negative rate (FNR) is higher than the FPR has led to the increased amplification of swab samples far beyond the accurate limit of 24 Ct or even the conventional PCR max of 30 Ct (i.e. 2 to the power of 30 = 1 billion DNA copies). Amplification increases sensitivity (fewer false negatives) but also the specificity (more false positives) until, ultimately, all (negative) samples would test positive.
The relationship between Ct (amplification) and accuracy (measured here by the successful isolation of live virus in cell culture) is shown in the chart below. The accuracy of the test falls away sharply above 24 Ct (17 million copies) and > 33 Ct (8.5bn copies) zero live cultures can be obtained in vitro (i.e. in the absence of any functional immune system) suggesting no viable virus and zero chance of a human with a functioning immune system being either infected or infectious. Yet pillar 2 PCR assays are amplified all the way up to 42-45 Ct (35 trillion copies), 2 million times more than the Ct 24 accurate (> 90%) live virus detection cut-off point and 30,000x the maximum ‘safe’ limit used by experienced lab researchers. The pillar 2 use of very high Ct amplification is also why previously infected but recovered cases are also (wrongly) testing ‘positive’, sometimes weeks later.
Operational FPR is always much higher than analytical FPR
The second reason why the FPR will be substantially above the ONS best-case, 1-in-1000 is because even if we went back to reduced amplification to bring the analytical FPR back down to 0.1%, there is nothing that can be done to control the pillar 2 ‘operational’ FPR.
Analytical vs operational FPR
RT-PCR equipment is sensitive, requires delicate handling and inaccurate enough to be marked ‘not for diagnostic use’. Unlike the experienced NHS labs which carry out < 30% of tests (pillar 1), 70%+ of tests are carried out in the private sector by the Lighthouse Labs network (pillar 2) which was assembled from scratch in May and is run by Deloitte. Most machines were co-opted from universities (on the promise of replacement upgrades later) by labs unfamiliar with the hardware, often without the supporting software instructions, to be run by inexperienced teams, using emergency approved testing kits (now numbering more than 500), synthetically validated and provided by new suppliers of unproven, not to say dubious, quality.
Operational (real world) FPR is always going to be far higher than the analytical (ideal world) FPR; but especially when handled by inexperienced operators, using unfamiliar equipment, under stressful conditions (pillar 2 tests have risen from zero to 173,000/day in less than 5 months) due to:
- contamination of ‘clean room’ test kits during manufacture & distribution
- contamination of equipment or reagents during sampling
- ‘aerosolization’ can cause sample cross-contamination during swab extraction
- cross-reaction with other genetic material during DNA amplification
- contamination of the DNA target
The ‘expected’ FPR
Consequently, to believe in an operational FPR as low as 0.1% flies in the face of all previous experience. A review of 35 previous EQAs of RT-PCR RNA assays with negative samples, for 13 separate pre-Covid-19 viruses, found that the median FPR was 2.5% (25x higher than the ONS’ wishful-thinking) with an interquartile range of 1.2-4.0% (12x-40x higher).
Five ways to find the FPR
Ironically, it would be quite easy to establish what the pillar 2 FPR was, using any one of five different approaches, though government seems unwilling to provide the data.
- Simplest would be to re-test all positives, preferably twice and in different labs to the ones producing the initial result. The proportion of positives corroborated will give you a rough estimate of the FPR.
- You could seed definite negatives (eg. saline) in the test kits at the manufacturing stage and see how many came back positive.
- You could test positives for viral protein.
- The Sanger Institute could report what proportion of ‘positives’ they are able to gene sequence (according to Hopkins this will be published shortly but if it doesn’t include the number of invalid and/or unviable, then these results will be useless.
- Culture the samples to detect what Hopkins calls “live or viable virus.” Once again, unless this is published data and includes the relevant Ct amplification necessary, compared to that used in pillar 2 positive tests, such results will be uninformative (see Ct chart above).
The ‘second wave’
The idea behind lockdown was to ease the ‘burden’ on the NHS but as at 17th September 2020 there were 1,081 diagnosed COVID-19 patients in hospital, significantly less than one patient for each of the UK’s 1,257 hospitals. The woeful state of statistical understanding underpinning the Government’s dependence on positive pillar 2 tests notwithstanding, what are we to make of the September surge in positive tests? Unless corroborated by hard data, like NHS diagnoses, hospital admissions and, with a 2-week lag, deaths then we should consider the possibility that the surge in positives may be due to contamination (a ‘lab crash’ in the parlance). The shortage of available test kits will have put pressure on distributors to release kits that had been held back as sub-standard. Rumours of contaminated supplies, especially vials, are now widespread.
Perspective
The number of healthy people below the age of 60 that have died is only in the 300s, whilst all those that have died within 28 days of symptom-onset is closer to 37,000. The number that die in a bad flu year (eg. 2017-18) is about 25,000 more than in a good year (e.g. the last two winters). Thus the ‘dry tinder’ theory, as explained by Dr Ivor Cummins and viewed > 1.1m times, means that total UK Covid-19 deaths (i.e. not from old age) could realistically be as low as 12,000 (sub-0.02% of the population).
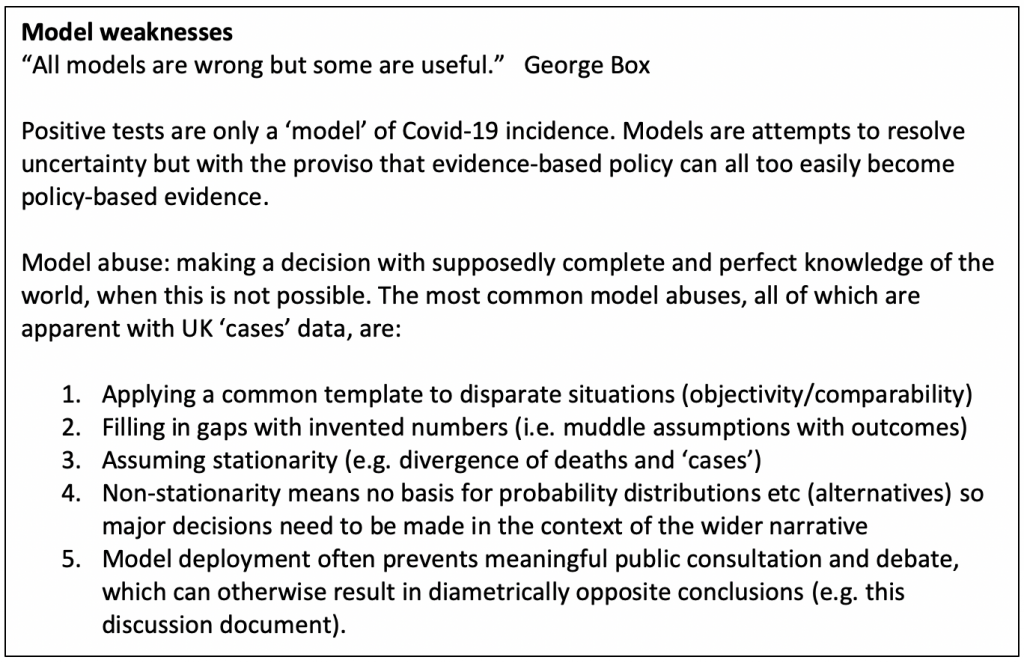
Appendix: Theory of models


Donate
We depend on your donations to keep this site going. Please give what you can.
Donate TodayComment on this Article
You’ll need to set up an account to comment if you don’t already have one. We ask for a minimum donation of £5 if you'd like to make a comment or post in our Forums.
Sign UpLatest News
Next PostLatest News