Graphical Illustrations of the Effects of False Positive Results from Covid19 RT-PCR (Swab) Tests at Low Measured Prevalence
There’s no doubt Covid-19 “cases” are presently increasing throughout the UK. How much of this is due to increasing test results, possible contamination during tests or in the test labs, and perhaps “cold” positives arising from fragments of inactive virus?
Professor Carl Heneghan of The Centre for Evidence-Based Medicine at Oxford has highlighted the importance of both “false” and “cold” positive results on the reliability of RTPCR test results at low disease prevalence.
I won’t go into details of the PCR tests and their accuracy, which can be found elsewhere. However, I’ll first briefly mention the test sensitivity and specificity.
The test sensitivity measures how accurately truly positive cases are identified. In cases where disease prevalence is low in the population, say less than 0.5%, test sensitivity variations between say 80% and 90% are not important. The test specificity measures how accurately truly negative cases are identified. The false positive rate (FPR) is approximately 100% minus the test specificity %.
It was claimed, by Health Secretary Matt Hancock on 18th September on Talk Radio, that the FPR of the current RT-PCR test for Covid-19 is “less than one percent”. This implies a specificity greater than 99%. However, the devil is in the detail.
This document attempts to illustrate graphically the effects of the test specificity of the Covid-19 RT-PCR (Swab) test at low values of disease prevalence. Figure 1 shows the “predictive power” of a positive test as a function of actual (true) disease prevalence. The solid curves show results for 90% test sensitivity and for values of specificity ranging from 99% to 99.8%. I’ve included two dashed curves for 80% test sensitivity to illustrate that variations in test sensitivity are not significant.
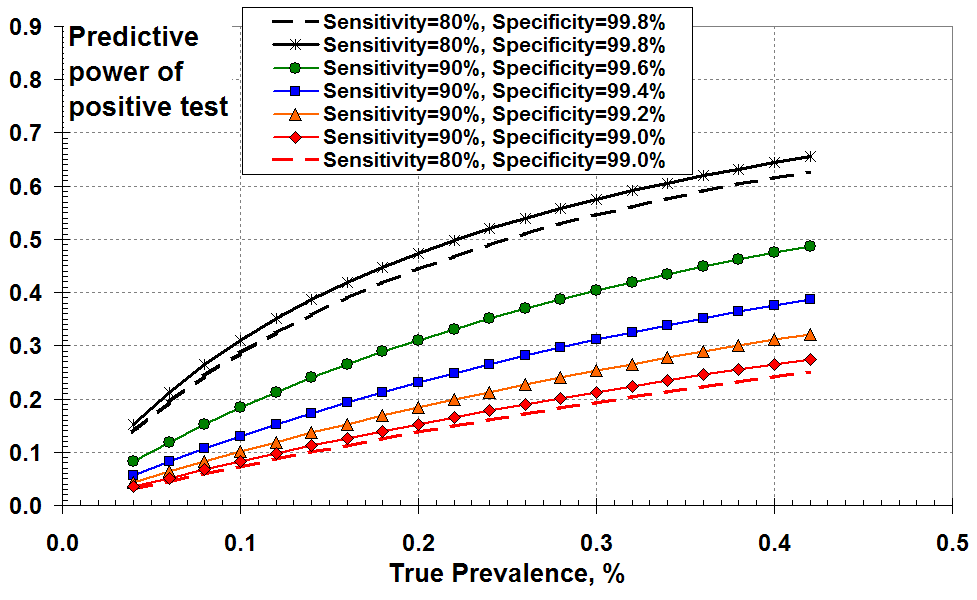
One way of plotting the effects of PCR test sensitivity and
specificity at low disease prevalence: as the “predictive power”
of a positive test as a function of true prevalence
So Figure 1 demonstrates that the “predictive power” of a positive test increases with increasing disease (true) prevalence and with increasing specificity (reducing FPR).
But what does this mean in practice in terms of what I will call the “measured prevalence”? I define the measured prevalence to be the total number of positive test results (true plus false) divided by the number of tests. As a reminder, the true prevalence is the number of true positive tests results divided by the number of tests. The measured prevalence is the number that gets reported; it is assumed that this is the true prevalence (I believe).
Figure 2 below shows the measured prevalence versus true prevalence for various levels of test specificity. In all cases, the measured prevalence exceeds the true prevalence due to false positives. This over-prediction of prevalence increases as test specificity falls from 99.8% to 99%. For example, for a true disease prevalence of 0.2% (two true positives in a thousand) and a specificity of 99.4% (FPR about 0.6%) the “measured prevalence” is 0.78%. That’s nearly four times larger than the true prevalence! This makes sense because the FPR is about 3 times the true positive rate.
You could use this graph another way. For example, if you think the test specificity is as good as 99.6% (green line) and you measure prevalence at 0.6% on the y-axis, the true prevalence is about 0.22% on the x-axis. It’s still a lot less than the 0.6% measured.
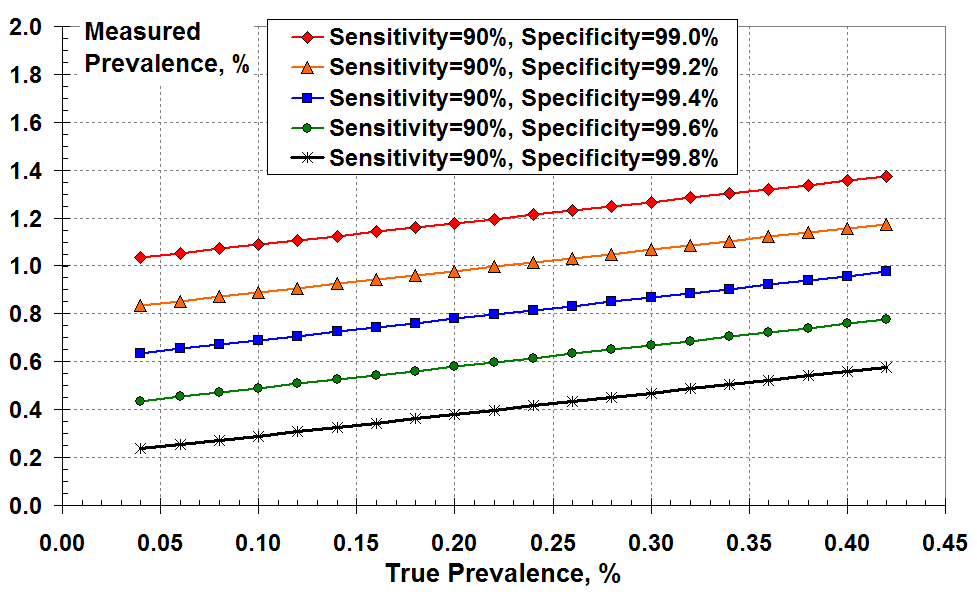
A different way to show the effects of PCR test sensitivity and specificity
at low disease prevalence: the measured prevalence according
to all the positive test results versus the true prevalence.
Figure 3 below demonstrates the magnitude of over-prediction by plotting the ratio of measured to true prevalence versus true prevalence for the various levels of test specificity. This over-prediction increases markedly as true prevalence reduces and as the test specificity falls from 99.8% (black) to 99% (red).
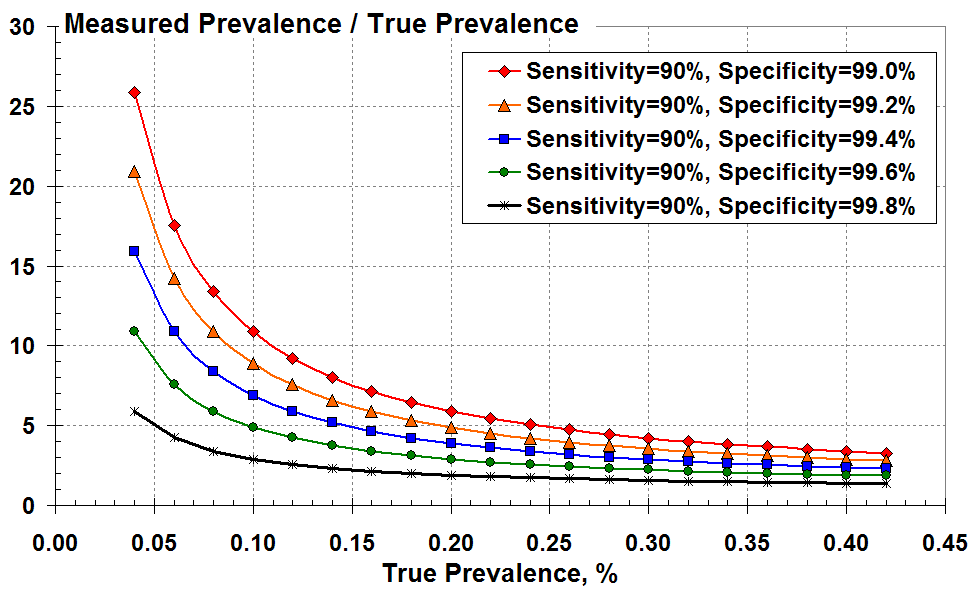
The ratio of measured to true prevalence (the over-estimate)
versus true prevalence according to the test specificity.
It’s all very well using Figure 3, but you don’t know the true disease prevalence on the x axis; you can only infer this from the measured positive test results.
As an alternative, Figure 4 plots the over-prediction as a function of the disease prevalence that’s measured according to all the (true plus false) positive test results. These curves look more alarming since the big rise in over-prediction occurs at much larger values of measured prevalence; and there isn’t the same overlap of curves as seen Figure 3.
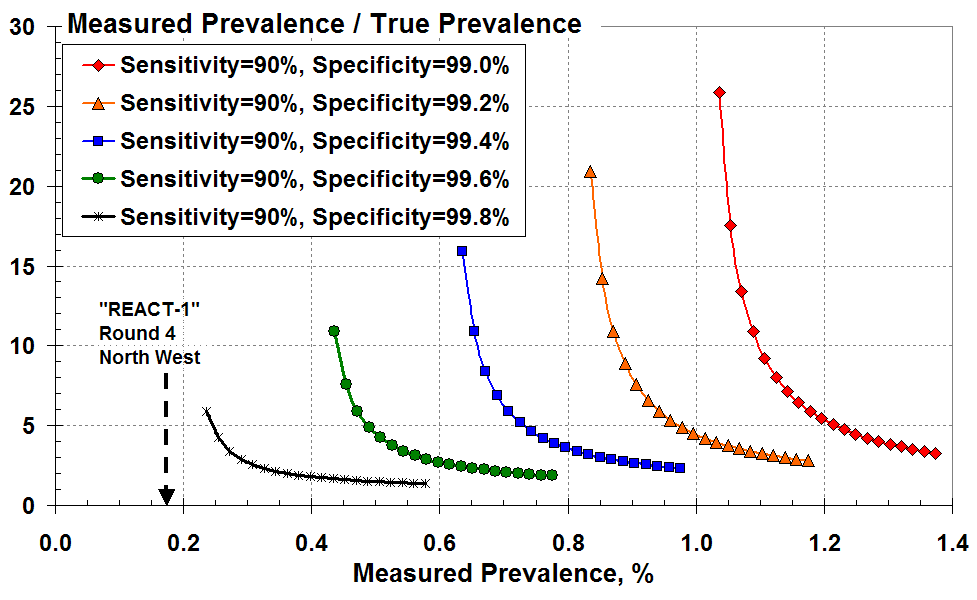
The ratio of measured to true prevalence (the over-estimate) versus
measured prevalence according to all the positive test results for various test specificity.
Let’s consider a measured prevalence of 0.4% (four total positive tests in a thousand) on the x-axis. This measurement is only meaningful here if the test specificity exceeds 99.6% (less than four in a thousand false positives). The green curve indicates that the measured prevalence of 0.4% is an over-estimate by at least 11-fold.
Similarly, a measured prevalence of 0.6% (six total positive tests in a thousand) on the x-axis is only meaningful here if the specificity exceeds 99.4%. The blue curve indicates that the measured result of 0.6% is a vast over-estimate, by at least 16-fold.
It is clear that seemingly small changes in test specificity (but commensurately large changes in the false positive rate) give enormous variations in the inferred rate of true prevalence.
In summary: “less than one percent” false positive rate, or greater than 99% specificity, is meaningless in the context of measured prevalence less than 1%. Most of the positive tests are liable to be false.
Example – Round 4 of REACT-1 Study
Finally, as an example let’s look at the latest Round 4 of the REACT-1 study conducted by Imperial College1. The test swabs in REACT-1, Round 4 were analysed by “commercial” laboratories – presumably the local Lighthouse Lab. Here, 136 people tested positive between 22nd August and 7th September 2020 in England out of a total of 152,909 randomly selected individuals. That’s a best estimate “unweighted” prevalence of 0.089%, and a best estimate “weighted” prevalence of 0.126% given in Table 1 of the REACT-1 report. This measured prevalence doesn’t figure as credible in our Figure 4. We’d have to consider perhaps 99.9% specificity or better.
In one of the worst case regions, the North West, 29 positive results out of 17,016 tested in Round 4 (Table 5 of the REACT-1 report) gave a measured prevalence of 0.17% as indicated by the arrow in Figure 4 here2.
According to Figure 4, for these numbers to have any credibility the test specificity would have to exceed 99.8. That is: the false positive rate must be less than two in a thousand for any meaningful true Covid-19 prevalence to be estimated for the North West region.
Are the latter false positive rates credible? Do the different Lighthouse Labs – serving different regions of the UK – use the same systems and software? Do we see regional differences because of the different processes used by the regional Lighthouse Labs conducting the tests? Have the commercial Lighthouse Labs lost skilled personnel after summer that has reduced the efficiency and accuracy of their testing?
1. “Resurgence of SARS-CoV-2 in England: detection by community antigen surveillance”
2. I assume that the majority of these North West region analyses of swabs would have been conducted at the Alderley Park Lighthouse Lab in Cheshire.


Donate
We depend on your donations to keep this site going. Please give what you can.
Donate TodayComment on this Article
You’ll need to set up an account to comment if you don’t already have one. We ask for a minimum donation of £5 if you'd like to make a comment or post in our Forums.
Sign UpLatest News
Next PostThe Real Science of Covid