
The report from round 13 of Imperial College’s REACT-1 Covid infection survey was published yesterday, covering the period from June 24th to July 12th, broadly corresponding to the Delta surge.
The press release led with the claim that “double vaccinated people were three times less likely than unvaccinated people to test positive for the coronavirus” (0.4% vs 1.2%). This is clearly misleading as an indication of vaccine effectiveness, however, as younger people were both less likely to be vaccinated and more likely to test positive. As the report itself admits: “These estimates conflate the effect of vaccination with other correlated variables such as age, which is strongly associated with the likelihood of having been vaccinated and also acts as a proxy for differences in behaviour across the age groups.”
Presumably, the headline was chosen by a politically savvy communications officer who did not want to draw attention to the fact that the study found a lower vaccine effectiveness than other studies such as those of Public Health England.
It found a vaccine effectiveness (vaccine type unspecified) among 18-64 year-olds of 49%. However, the 95% confidence interval ran from 22% to 67%, meaning the authors didn’t have enough positive test results to be very sure of their estimate (despite testing nearly 100,000 people, only 527 results or 0.54% came back positive). They couldn’t even be very confident it wasn’t as low as 22%.
This low certainty is probably why they didn’t try to break down the results further by age. However, without that it’s hard to see how the results can be relied upon, as the vaccination rates of 18 year-olds differ hugely from those of 64 year-olds, as do the infection rates, and lumping them all together makes the results almost meaningless. With most infections in the young and most vaccinations in the old, it suggests 49% is an upper bound rather than a central estimate.
The authors note that their reduced estimate for vaccine effectiveness is similar to recent data from Israel, but below PHE’s latest figures:
These estimates are lower than some others, but consistent with more recent data from Israel. Our estimates were higher when we restricted our analyses to people reporting symptoms of COVID-19 in the previous month. These higher estimates were still lower than those reported using a test-negative design for routine testing of symptomatic people presenting for RT-PCR in England. However, our data are based on a random sample of the population and include asymptomatic people, as well as symptomatic individuals who may not present for routine testing, and may therefore give a less biased representation of transmission risk.
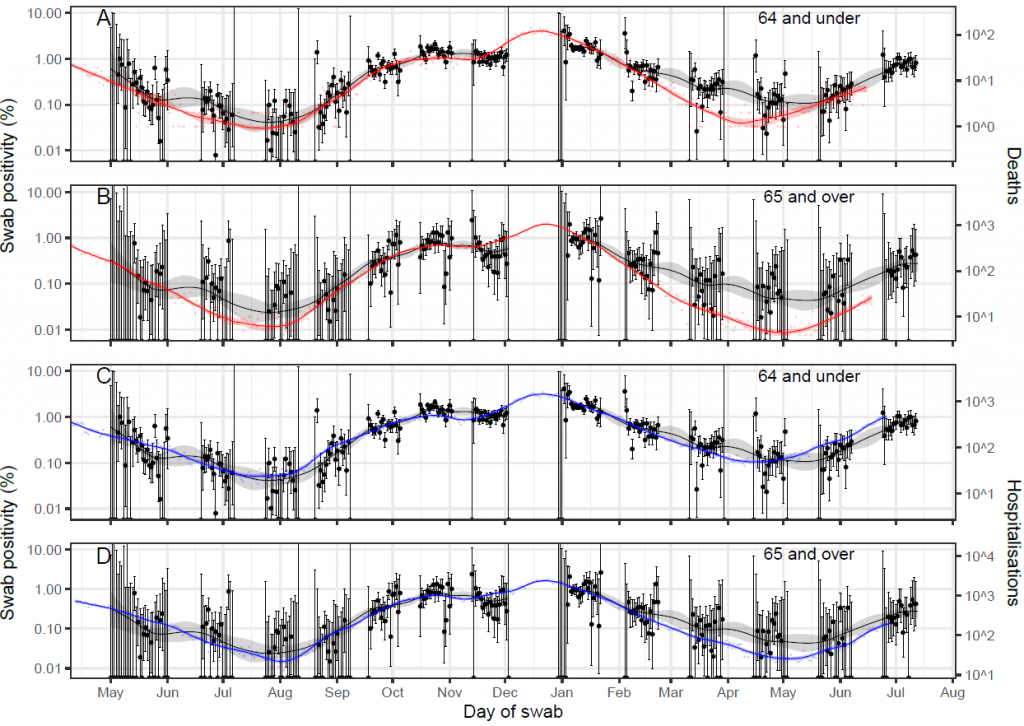
Another disappointment in the study – again absent from the press release – is that the ratio of positive test results to both hospitalisations and deaths has narrowed during the recent surge (see below – compare the red and blue lines to the grey line). The widening gap had been taken as an indication of vaccine effectiveness, and the narrowing is understood to mean the opposite.
The authors write: “In our more recent data (since mid-April 2021), infections and hospitalisations began to re-converge, potentially reflecting the increased prevalence and severity of Delta compared with Alpha, a changing age mix of severe cases, and possible waning of protection.”
The relationship has even gone negative in hospitalisations in the under-64s, implying that they are worse off now than before the vaccination programme. Deaths are still trending (slightly) below. The results weren’t broken down by vaccination status, so we can’t calculate vaccine effectiveness here.


To join in with the discussion please make a donation to The Daily Sceptic.
Profanity and abuse will be removed and may lead to a permanent ban.
Wait! You aren’t suggesting the pharma companies and their shills might have set things up to exaggerate the effectiveness of their products, are you!?
Well, that could never have been predicted. I mean it just wouldn’t be reasonable to have expected our noble leaders to have accounted for that kind of thing in their decision-making, would it?
I believe that is called ‘marketing’, or as we like to call it at work: creative lying.
Whatever the facts regarding vaccines they continue the lies
SWEDEN: DESPITE VARIANTS, NO LOCKDOWNS, NO DAILY COVID DEATHS
http://www.wakingtimes.com/sweden-despite-variants-no-lockdowns-no-daily-covid-deaths/?utm_source=Waking+Times+Newsletter&utm_medium=email&utm_campaign=d9e138b639-RSS_EMAIL_CAMPAIGN&utm_term=0_25f1e048c1-d9e138b639-54853601
Stand in South Hill Park Bracknell every Sunday from 10am meet fellow anti lockdown freedom lovers, keep yourself sane, make new friends and have a laugh.
Join our Stand in the Park – Bracknell – Telegram Group
http://t.me/astandintheparkbracknell
or perhaps they were forced by our noble leaders to fall into line and release whatever they had as vaccine passports had to be enabled.
Can’t be dismissed. Though you’d have to specify who the “noble leaders” in question might be. The idea of a buffoon like Johnson, or a senile, corrupt old twat like Biden, “ordering” the big pharma plutocrats to do anything is pretty comical.
All the models now featured in the DS vaccination photos are young. Hmmm.
And BOY OH BOY, am I ever SICK of seeing muzzled apes jabbing muzzled sheep.
In other words the injection to break down immune systems has been effective enough to create a clamour for the first of many booster jabs. Over the next few years we are houng to see the depopulation of the world. When the sheep wake up and realise what’s happening (around the third booster jab) there will be nothing they can do. Game, set and match to the next shift in human history. No-one knows what that will be. It depends on the anger and the numbers of unjabbed.
If there’s one thing you will not see, it’s the depopulation of the world. I predict thus with absolute certainty. Humans can out-breed anything.
I think this is one of the truly fascinating questions of our time. Has homo sapiens transcended the instinct of every biological species to expand until its environment can no longer sustain it and it collapses?
(This has nothing to do with a bunch of eugenicists plotting to wipe out the “weaker” or “other” members of the species, which is something probably all biological species look to do.)
I’m referring more to the effect one sees in the most technologically advanced Asian nations like Japan, Korea and China and in Europe in which people just don’t want to breed offspring anymore.
My amateur’s bet is that it’s more like the zoo effect, where some species breed much less in captivity. Modern society is becoming as constricting for humans as a zoo is to a Bengal tiger so that we are losing our desire or instinct to procreate.
Mmm – not in the West.
Not in any continent except one now.
Those who regard global pop growth as an issue need to focus on sorting out Africa. And one of the most important aspects of that is to stop that continent exporting its surplus to the rest of the world, thereby creating room for endless growth.
You rarely hear that pointed out by population control zealots.
When discussing a reform to the state pension to turn it from emergency poor relief into something like an guaranteed income scheme for the retired, Konrad Adenauer, then chancellor of the FRG, famously quipped “Kinder kriegen die Leute immer” (“People will always have children”). That was in the 1950s.
The idea that sex without consequences would be the ultimate purpose of life and that chemicals rendering women (temporarily) infertile would thus (finally) liberate humans from the bonds of their animal heritage(and – but this is certainly coincidence – enable use of women as full-time workers in the economy) didn’t really get much traction until about ten years later.
Weren’t it for contraceptive pill (as this interesting invention was called), nobody would be whining about birth rates in the west vs birth rates in Africa today. This not because of some mysterious, natural process of decline. It’s because people have been strongly incentivised to avoid getting children and provided with cheap, realiable means to accomplish this.
Strangely, considering popular theories in the antivaxxer camp, nobody has ever thought of this pill as poison supposed to enable population control.
poison they are though, and are leaking into the marine environment through excretion, affecting fertility of aquatic life, and they are also eroding stable family life, contributing to wide spread misery, think of the shocking number of young women self harming; the 45% of women and adolescents who reportedly have some sort of mental health problem – more than former service men who have served in combat zones – it’s a poisonous culture and a poisonous pill.
They aren’t going to wake up; they’ll simply believe that those of us who are unjabbed and don’t wear masks are the cause of the problem. We can expect to be paraded in Victory Square when the government needs another scapegoat.
This is never going to end until we learn to FIGHT BACK BETTER. New resources website updated regularly with useful information and links: https://www.LCAHub.org/
Now repeat after me ‘RT-PCR Tests are useless’.
527 positives from 100,000, its the same sort of level since the beginning of this rubbish. At these sort of levels most of thise 527 will be false.
We know with increasing knowledge some of the nasty effects of these so called ‘vaccines’, we continue to have no knowledge whether they do any good at all.
Apparently the number of cycles used in a PCR test indicate the viral load that the subject has acquired, and many articles have indicated that above 30 means very little if any load. So what does the 44 figure quoted by some testing labs tell us?
That it’s a hoax!
But it’s worse than that : the 527 ‘positives’ have a tangential relationship with disease – of an unknown level. The validity of all the stages between the detection of an RNA strand and a true infection are so great as to render any findings in the order of that derived from a pack of Tarot cards.
Day after day we see these studies with various “effectiveness percentages” quoted, and it seems that they are all, for want of a better word, utter bollocks.
Well – that’s true. But early data from proper trials was reasonably valid.
And what did that show? Very dodgy small RRR figures based on very small numbers, and devastating ARR figures (of around 1%)
Does anyone know how they differentiate between Delta and Alpha? Are there differences shown by the already useless and discredited PCR test or are they sending random swabs for analysis or what?
I don’t really know what a variant is. I barely know what a virus is. I use the the terms PCR and Antigen test but don’t really know what the difference is. All I know is that they are supposed to tell you if you have a particular virus or not, but I have no clue how it does it.
For all I know this whole SarsCov2 a Covid thing could be made up and I would be none the wiser.
And I suspect that is true for 99.99% of the population.
Whatever the facts regarding vaccines they continue the lies
SWEDEN: DESPITE VARIANTS, NO LOCKDOWNS, NO DAILY COVID DEATHS
http://www.wakingtimes.com/sweden-despite-variants-no-lockdowns-no-daily-covid-deaths/?utm_source=Waking+Times+Newsletter&utm_medium=email&utm_campaign=d9e138b639-RSS_EMAIL_CAMPAIGN&utm_term=0_25f1e048c1-d9e138b639-54853601
Stand in South Hill Park Bracknell every Sunday from 10am meet fellow anti lockdown freedom lovers, keep yourself sane, make new friends and have a laugh.
Join our Stand in the Park – Bracknell – Telegram Group
http://t.me/astandintheparkbracknell
In a recent bombshell study a ‘nice cup of tea’ has been found to be 48% more effective when combined with two chocolate digestives, the world renowned Imperial Mince Spin A Bottle department has discovered. Some experts are now saying one Aldi digestive can probably act as an elevenses booster, if taken daily. Mixing brands is now seen as positively beneficial.
The Professor of Applied Dunking is believed NOT to have shares in McVities according to BBC fact checkers Gary Baldi and NICE, a government quango.
Am I awake yet?
More bollocks incoming! Stay tuned.
This is the healthy NICE
Tasty. And so pleasingly unhealthy.
Now this is just taking the biscuit
Would a bottle of piss be a more appropriate image for the kool-aid?
Let me fix that headline for them: “Chinese Virus vaccines may protect up to 8 people out of 1,000”.
Not so hard, is it?
Does this “study” factor false positives into it’s conclusions? Also, as I asked yesterday, doesn’t a “vaccine” have to show 50% efficacy at preventing infection to be granted emergency authorisation? Whatever, they must be extremely disappointed by these findings and it must be getting to squeaky bum time for anyone in the MHRA who is actually a proper scientist.
This is important — the vaccines no longer meet the threshold that the authorities themselves set as being ‘good enough to use’.
Yet instead of saying ‘hold on — let’s think about this…‘
They’ve said ‘let’s jab the children!‘
Science and logic have left the building — the clowns are in charge.
If the UK is experiencing the same phenomenon as in Israel then it’s possible that vaccine effectiveness is even lower.
From Israeli data it seems that protection wanes so those vaccinated earlier have only marginally more protection than the unvaccinated. In the REACT study sample there will be some that have been vaccinated more recently than others. The last PHE report suggested that VE (Vaccine Efficacy) for Over 50s had narrowed significantly.
So, boosters every month? Week? Other day?
At least it will give the National Hell Service something to do. It isn’t as if they bothered treating sick people, after all.
And vaccine passports with the hour they were issued because they are only valid for a few hours?
Haven’t we heard something like that before …. oh, yes, hyperinflation
The data from Israel actually caused me to wake up in the middle of the night. It is genuinely frightening given what we know about attempted coronavirus “vaccines”.
The data provided by swedenborg yesterday suggested (inflated by more testing of the unvaccinated only in that age group) 60% efficiency in the 0-19 year old who don’t need it at all, 10% in a few 90+year old and ZERO efficiency, or even INCREASED risk of infection, in the 20-89 year old.
How, for pity’s sake, are they testing ‘vaccine effectiveness’? Jab a cove and then send him into a covid ward?
It’s all complete nonsense.
Purposefully Concocted Relativity test.
The testing system was already raddled with conflicts of interest, with the majority of drug testing controlled by the pharmaceutical industry.
The shit-show has raised this potential corruption to an entirely new level, with the pre-use testing regime explicitly abandoned, and government and its agencies acting as PR organisations for the industry. (Actually it’s worse – the advertising industry has some minimal constraints against lying placed upon it).
Now I’m starting to understand how Schrödinger’s cat felt.
Of course, the real news is the minute nature of the actual numbers. Forget the smoke and mirrors commentary.
This is an emergency along of the scale of a mouse in the living room.
Basically confirming the trials.
Out of 40.000 people, only 120 tested positive over 3 months.
The trials basically already confirmed that the gene therapies were not necessary at all.
Therefore coerce jabs for all 8 billion on the planet (except establishment).
So a potentially useless vaccine with real bad side-effects is still a panacea for state-created problems and you have to keep taking more to prove you’re worthy of basic freedoms (yet never receive them) that cannot be alienated anyway? No thanks, I’ll take my chances.
Of course (to note) – the term ‘infections’ is used in this paper in a totally unscientific way. Which blows apart everything else.
The headline here is misleading. If one is reading quickly one will interpret “could be” as “is”. A better headline would be “Latest Imperial REACT Report fit for round file”.
How on earth can you guide public policy with a confidence interval like that – what would the 95% CI be? It’s like everything, masks, lockdowns, rules of six, never the kind of proof that warrants such drastic, expensive and harmful policy.
In our more recent data (since mid-April 2021), infections and hospitalisations began to re-converge, potentially reflecting the increased prevalence and severity of Delta compared with Alpha, a changing age mix of severe cases, and possible waning of protection.
This is an outright lie. Runaway cases not translating into hospitalizations started to become the norm in mid-April. The ratio of cases per hospitalizations has fallen sharply recently. This is a usual effect of falling case numbers. But it’s still higher than it ever was before (59).