Britain’s Met Office says it is a 50-50 call that one of the next five years will see global temperatures leap by almost half a degree centigrade to 1.5°C above pre-industrial levels. The tidings were of course faithfully reported by mainstream media, keen, as always, to support the political messaging behind Net Zero. But curiously missing from the coverage was the fact that the absurd prediction relies on a base of heavily adjusted past temperature records, and the future occurrence of one of the most powerful natural El Niño weather fluctuations ever observed.
It is on El Niño that the bet mostly relies. A powerful fluctuation in 2016 ended a lengthy temperature pause and raised the reading temporarily by up to 0.2°C. El Niños are natural weather fluctuations that draw heat from the eastern tropical Pacific Ocean and distribute it around the atmosphere. There was also a powerful El Niño spike in 1998 and since that date, global warming has run out of steam.
Not at the Met Office of course. As we have reported, the Met Office removed an off-message pause from around 1998 by two major adjustments in 2013 and 2020 to its HadCRUT global temperature database. In total, the adjustments added about 30% more recent warming. This trend was exacerbated by cooling the temperatures recorded earlier in the 20th century. Similar adjustments were made by other important global temperature datasets. All surface datasets are complex blends of reported temperatures, proxies, estimates and modelled data.
A recent essay in the Watts Up With That climate science site run by the American meteorologist Anthony Watts clearly shows the adjustments. First we look at the satellite data, generally considered the most accurate representation of global temperature.
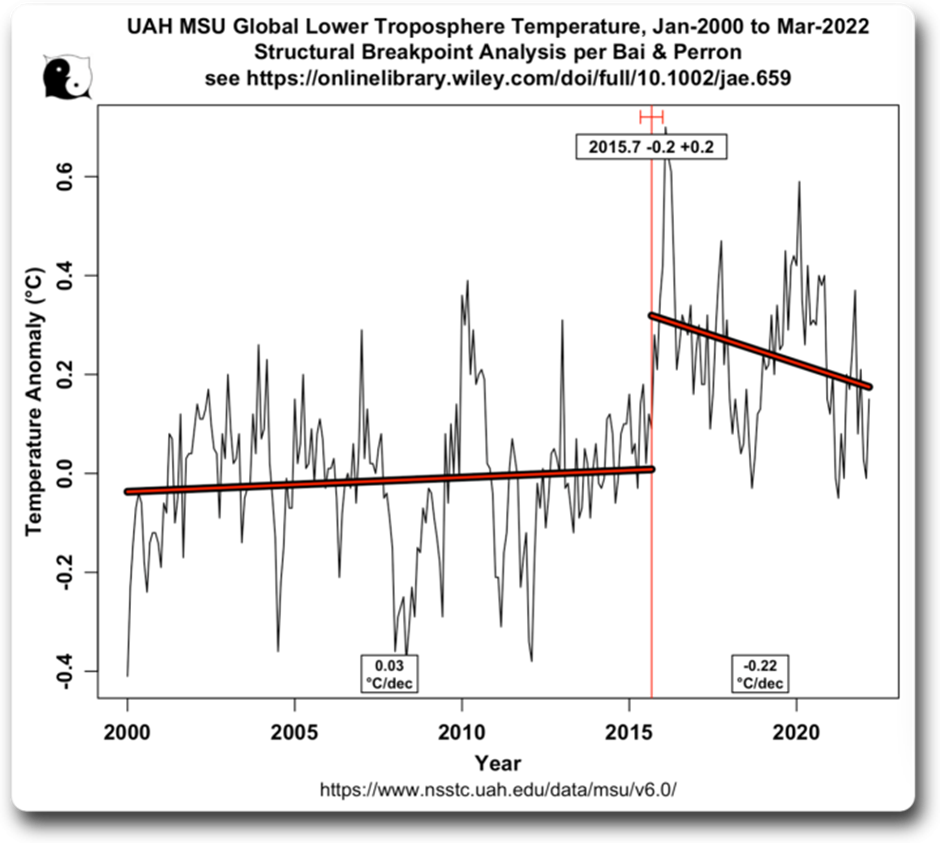
The near flatline from around 1998 is clearly shown along with the El Niño jump in 2016. Since that one-off event, the line moves sharply downwards. The University of Alabama in Huntsville data is part compiled by Dr. Roy Spencer and appears every month on his personal web page. This site was recently demonetised by Google AdSense on the grounds he published “unreliable and harmful claims”.
Now consider the Met Office latest database.
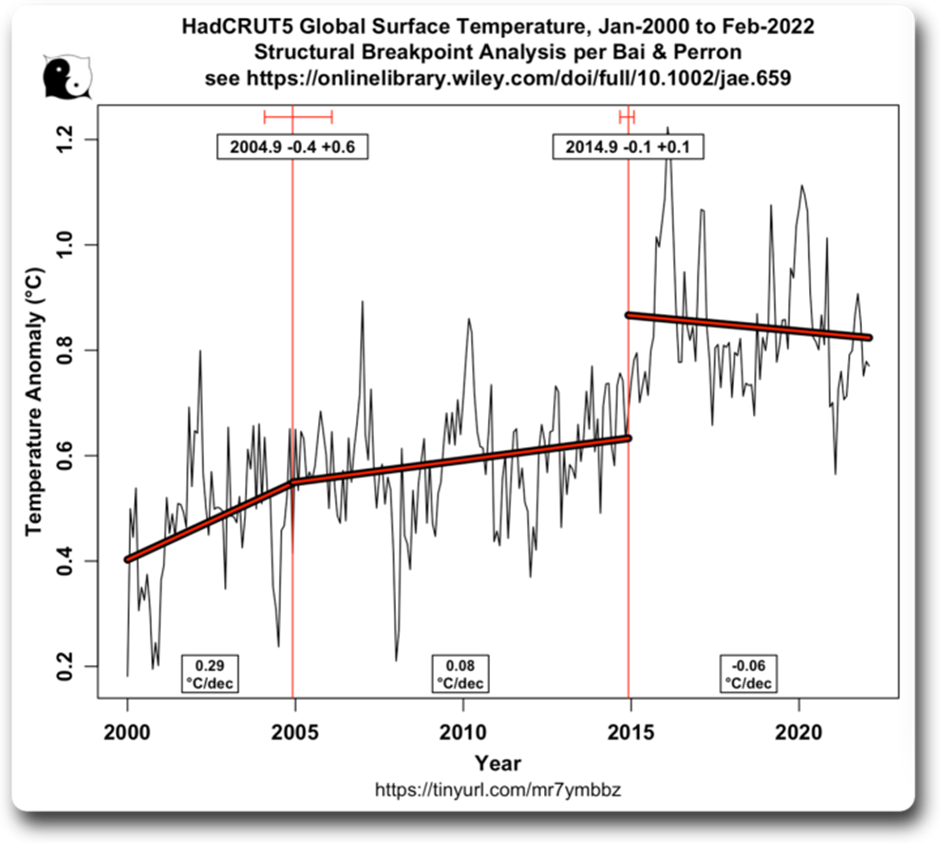
The near flatline of the satellite record has become a pronounced rise, while the decline since 2016 is less steep. A comparison of the two graphs shows that HadCRUT has doubled the warming revealed by the satellites.
But the Met Office is not the record that differs most from the satellites. Here is the graph for the NASA GISS database.
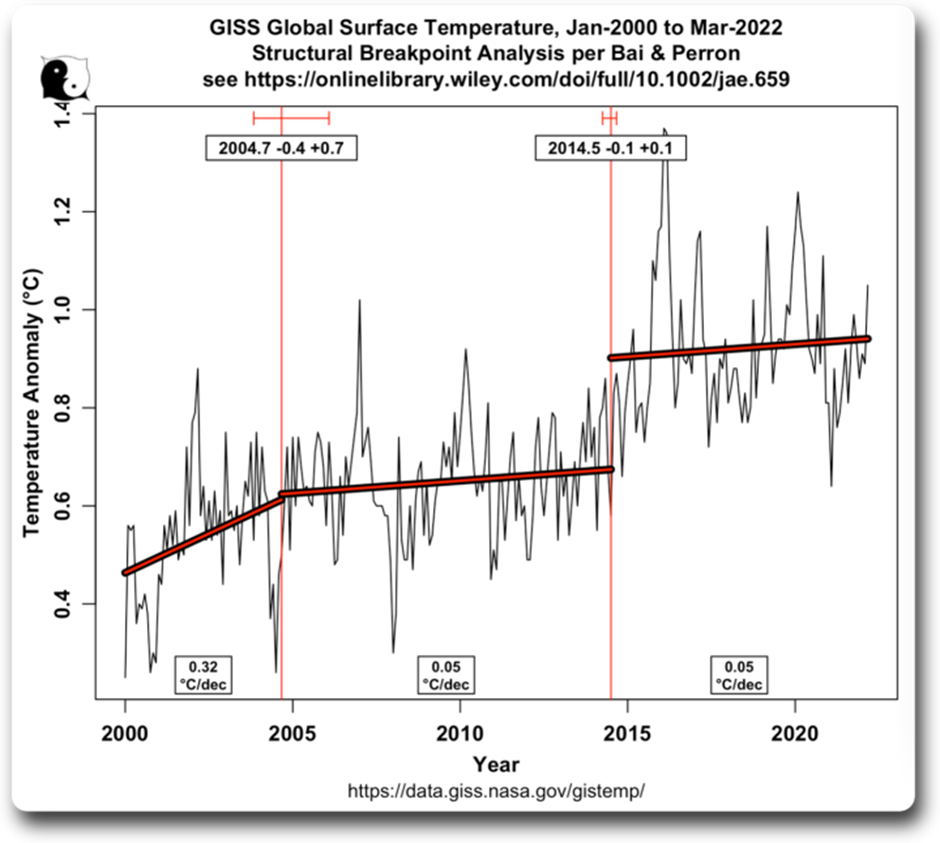
There is a massive improvement here for Thermogeddon fans. There is much more warming over the last 25 years at NASA, and the added bonus that the temperature has continued to rise since 2016.
If the Met Office ’50-50′ call is to come true, the lines on all three graphs would have to rise near vertically almost off the page. Global warming is unlikely to provide a boost and it can be argued it is a 50-50 call that temperatures will start to fall. All that is left it seems is a hope that the largest El Niño ever recorded will come riding to the rescue. Absurd, doesn’t begin to cover it.
Chris Morrison is the Daily Sceptic’s Environment Editor


To join in with the discussion please make a donation to The Daily Sceptic.
Profanity and abuse will be removed and may lead to a permanent ban.
The Met office and other globalist meterologists have been using trans thermometres for a long time.
A trans thermometre identifies as being at a very different temperature to the temperature it actually is.
I thought vaccination was supposed to have solved it.
It will when enough are dead.
There is no vaccination for stupidity.
It’s not beyond the realms of possibility that the El Nino events *are* the mechanism for releasing heat into the atmosphere.
Remember the planetary system has evolved to try to keep the temperature stable, like applying the brakes on an accelerating car keep the speed stable for a while – until the brakes overheat and stop working until they cool down a bit.
It would be perfectly reasonable to see global temperature remain stable for decades and then step up. However we won’t know if that is the mechanism until we’ve seen several cycles. It’s just as likely at the moment that it is a one off and things will settle back down.
Confirmation bias is dangerous. It’s on all rational individuals to be on the look out for it, because the loons in the media and the extremists they put on pedestals won’t.
The planetary system is nothing to do with evolution.
You always know when something is plain wrong: the people pushing it lie about it. The Remain campaign where the PM lied about brown socks, the lockdowns when The Science lied, the PM lied, the papers lied and now global warming rears it’s lying head once again. I just laugh at the Climate zealots, they couldn’t prove their way out of a paper bag because there is only falsified nonsense and a lot of shouting. Pathetic.
A favourite tactic is to assert as a fact that numerous weather related disasters are simply proof that co2 is causing warming and that the disasters are worse/more frequent.
It then takes the realist hours to go through each example and show that the vailable evidence does not support the claim.
By which time – before you can deal with the first lie – they will have a new lie – an old Goebbels trick!
The Serial Lies filter down from the top.
Agreed. But the problem is the loonies who govern us believe the garbage and are currently pushing through climate policies that are going to ruin the lives of billions.
In 10 years it will be too late to change back.
This is a very very dangerous situation.
To my mind when you look at covid, vaccines, climate and wars the word that comes to my mind is arrogance. This arrogant approach seems to have got worse in this computer age, as epitomised by Bill Gates. We think with our windows operating systems we can manage virus outbreaks , control human health with vaccines, manage the climate and ‘global warming’ and organise the people of the world. Arrogant hubris to think we are in control, it will not end well unless we re-learn some old truths;
”We have forgotten how to be good guests, how to walk lightly on the earth as its other creatures do”
” This we know. The Earth does not belong to us; we belong to the Earth. All things are connected, like the blood that unites one family. ”
The supreme arrogance is their belief and determination that nature can be scientifically ‘improved upon’. Genetic modification seems to me to be the chief horror – it’s messing with the fundamental building blocks of life, and it was always going to be a matter of time before they started on humans too.
Perhaps would-be scientists should be subject to deep psychological evaluation to discover any penchant for harm before letting them loose upon the world, where there is no limit to the potential damage their massive egos can bring upon us and the earth in general. Their ‘work’ should be under constant surveillance to ensure they don’t exceed their remit.
Fauci is just one example of what is wrong with science, there are many others. It’s truly frightening the power these people have. One way or another scientists will kill us all in the end.
Even my young daughter knows that if you have to shout to ‘prove’ your point you’ve lost the argument
The ‘green’ and ‘covid’ agendas are about the same thing……..stripping everyone of their assets and transferring those assets to the elites
Like covid, lots of soppy propaganda that the mugs love
Save the plant, save granny, all the same bollocks
Yes just two cheeks of the same Great Reset!
They know they’re losing the argument – hence the crystal ball gazing is getting more desperate.
That may be so, but unfortunately the actions being taken have no regard to argument, science or anything approaching rationality or truth. It is, as usual, a heady mixture of lies and propaganda, incited and peddled by people with a variety of vested interests.
I think that those of us on the receiving end of this torrential nonsense will suffer, as at the moment a lot of things are either already in motion or proposed, that will have simply appalling effects on the human race, and especially in those countries stupid enough not to, for example, crank up coal use, as reported today in the case of India.
Every aspect is going to be damaged; food supply, transport, economies etc. etc. As happens with most cockamamy schemes, pushed by interested parties and endorsed by politicians for their “legacies”, the law of unintended consequences, almost always detrimental in the end, will find itself in full application.
The new regional manager for Sri Lanka says things are going to get worse before they get better
What is worse than people starving to death?
Sri Lanka are reaping the rewards of a foolish political decision which will hamper their food production. If politicians left well alone there is plenty of food for all. Look at the nearest high street or shopping mall and count how many people dont look radically over fed.
what’s worse than people starving to death? The regional manager losing his job?
he’ll be lucky not to lose his head…
They will just censor all comment and opposition – Dorries has her orders!
First we look at the satellite data, generally considered the most accurate representation of global temperature.
False. It is generally considered the most accurate representation by the climate sceptic community. Among climatologists in general it is considered to be one of many representations of global temperature.
If the Met Office ’50-50′ call is to come true, the lines on all three graphs would have to rise near vertically almost off the page.
False. The Met Office claim is that there is a 50/50 chance that there will be at least one year in excess of 1.5 degrees – this does not mean the trend line goes over 1.5 degrees.
Have you ever travelled to parts of the world with current average temperatures at least 1.5 degrees higher than those in the UK?
If so, what is your conclusion about the effect that a temperature increase of that sort of scale in the next five years would have on those living in this country (and for the sake of this exercise please confine your answer to Britain itself).
Another day – more energy to respond …
Of course people live perfectly well in warmer climates than ours! People can adapt to certain aspects of climate change quite easily – it doesn’t take long to grow different crops. However, other aspects are much more of a problem. If you live by the coast, as many millions of people do, then it is non-trivial to adapt to sea level rise.
er, of course they do. Homo sapiens is a tropical animal.
The sea level is falling in Norway and in Scotland.
The sea level is falling in Norway and in Scotland.
I don’t know about Norway, but the falling sea level in Scotland was due to the land rising not the sea falling – this effect has now been reversed as sea level is rising faster than land is rising. In any case, what matters most is global sea level.
I know. However, why are the Maldives growing in area and not sinking?
https://edition.cnn.com/2020/12/06/asia/pacific-islands-growing-intl-dst-hnk/index.html
Thanks for that, and I admire the fact that you are putting forward the Climate Change case in a generally hostile environment.
Anyway pretty much the only enforcement mechanism the theory has left to fall back on is indeed alleged rising sea levels – temperature itself can be easily dismissed, and whatever the factual truth behind the much-hyped increasing ‘extreme weather’ fear mongering the reality is that actual deaths and destruction from eg hurricanes and flooding have been massively falling in recent decades.
In terms of rising waters, the Climate Change lobby itself argues that any significant changes (ie in the multi metre scale) will take place over several decades. This would obviously give plenty of time to take ameliorative measures such as constructing sea barriers or simply moving to higher ground.
No cost-benefit analysis has ever been carried out comparing the price of these sorts of responses with the astronomical economic consequences of abandoning cheap and reliable fossil fuels such as coal gas and oil (already being felt in the UK in terms of crippling energy and knock-on general inflation).
The Climate Change lobby itself also indirectly accepts that there is no guarantee that ceasing to use CO2 emitting substances would actually prevent sea level rises. It acknowledges that there can be entirely natural temperature (hence sea level) changes alongside their own alleged man-made ones.
So the barriers and inland movements might become necessary at some stage in the future in any case, though now necessarily carried out by a massively impoverished humanity without access to construction tools (cranes, lorries and diggers etc) powered by cheap and reliable petrol or diesel.
All the above is presented without even touching upon the paper-thin weakness of the anthropogenic climate change theory itself (no temperature rises for the last 20 years, CO2 is a minute proportion of atmospheric gases whose increases follow on from rather than instigate temperature rises, humanity’s annual contribution to this already tiny component is 3% etc etc);
The agenda fails from within its own logic.
And the consequences in terms of enforced poverty and potential mass deaths (already thousands of elderly and infirm people are dying of fuel poverty every year in the UK) are catastrophic.
Thanks for that, and I admire the fact that you are putting forward the Climate Change case in a generally hostile environment.
Thanks – it is a difficult habit to kick.
Anyway pretty much the only enforcement mechanism the theory has left to fall back on is indeed alleged rising sea levels – temperature itself can be easily dismissed, and whatever the factual truth behind the much-hyped increasing ‘extreme weather’ fear mongering the reality is that actual deaths and destruction from eg hurricanes and flooding have been massively falling in recent decades.
I don’t agree but the response would be very lengthy. Perhaps I can just refer you to the IPCC impacts report:
In terms of rising waters, the Climate Change lobby itself argues that any significant changes (ie in the multi metre scale) will take place over several decades. This would obviously give plenty of time to take ameliorative measures such as constructing sea barriers or simply moving to higher ground.
Tricky for countries such as Bangla Desh where enormous areas will be affected.
No cost-benefit analysis has ever been carried out comparing the price of these sorts of responses with the astronomical economic consequences of abandoning cheap and reliable fossil fuels such as coal gas and oil (already being felt in the UK in terms of crippling energy and knock-on general inflation).
Maybe not overall for the globe as a whole (not sure about that) but there analyses at country level for specific initiatives e.g.
which is a probably the sensible way to do it.
The Climate Change lobby itself also indirectly accepts that there is no guarantee that ceasing to use CO2 emitting substances would actually prevent sea level rises. It acknowledges that there can be entirely natural temperature (hence sea level) changes alongside their own alleged man-made ones.
Not sure what you are referring to – have you an example?
So the barriers and inland movements might become necessary at some stage in the future in any case, though now necessarily carried out by a massively impoverished humanity without access to construction tools (cranes, lorries and diggers etc) powered by cheap and reliable petrol or diesel.
I don’t think anyone is suggesting ditching all fossil fuel powered equipment. It is net zero – not absolute zero.
All the above is presented without even touching upon the paper-thin weakness of the anthropogenic climate change theory itself (no temperature rises for the last 20 years, CO2 is a minute proportion of atmospheric gases whose increases follow on from rather than instigate temperature rises, humanity’s annual contribution to this already tiny component is 3% etc etc);
* Even Spencer’s analysis of the satellite record shows a rise since 2002. The RSS satellite record and all the surface records show biger rises.
* It is irrelevant that CO2 is a minute proportion of the atmosphere. What matters is the absolute amount of GHGs. The fact there is also an enormous quantity of non-GHG gasses up there is beside the point.
* Humanity’s contribution to the increase is probably close to 100% with the result that at least a third of the CO2 up there is probaby human caused. You are making the common error of confusing the fact that 3% of the annual input of CO2 ishuman. However, prior to that 3% the input and output had cme into balance – so the excess is almost entirely human.
And the consequences in terms of enforced poverty and potential mass deaths (already thousands of elderly and infirm people are dying of fuel poverty every year in the UK) are catastrophic.
Clearly the transition to less fossil fuels needs careful managing – better than is happening now – but it is quite possible with a sensible blend of fossil, nuclear and renewable.
I don’t agree but the response would be very lengthy. Perhaps I can just refer you to the IPCC impacts report
The IPCC report obviously makes claims about anthropogenic climate change causing weather related problems.
My own point was that regardless of the number of ‘extreme weather’ events (and recent apparent increases can be accounted for by much more extensive observation and reporting in remote regions) and whether they are natural, manmade or some combination, the number of deaths has dramatically decreased by a factor of three since 1970.
“But, thanks to improved early warnings and disaster management, the number of deaths decreased almost three-fold. (WMO Atlas of Mortality and Economic Losses from Weather, Climate and Water Extremes 1970 – 2019)”
https://public.wmo.int/en/media/press-release/weather-related-disasters-increase-over-past-50-years-causing-more-damage-fewer
This success story is never mentioned, because it doesn’t fit the fear driven narrative.
[re flood defences and moving populations to higher ground]
Tricky for countries such as Bangla Desh where enormous areas will be affected.
Due to its topography and rainfall levels Bangladesh has always been prone to flooding. One of my main objections to the contemporary Climate Change movement (and indeed environmentalism in general) is that instead of concentrating on fixing catastrophic problems that actually exist (in this case through flood management, raising homes etc) it focuses all energy and money on alleged future problems.
In any case in terms of any possible future sea incursions into regions like Bangladesh due to rising levels (from whatever cause) I will use one word: Holland.
With regards to my point about the lack of any serious cost benefit analysis, though I appreciate you found a relevant document I am afraid I found the Renewable Transport Fuels Obligation costing report far too complex to grasp (even just the summary).
What I was really referring to was the absence of any clear and user-friendly cost-benefit analyses of the overall global programme of C02 emission suppression by eg the IPCC.
The sort of basic and comprehensible report which would be absolutely fundamental to any genuinely scientific and humanitarian project of such an epoch changing and astronomically expensive kind.
In terms of my claim that the Climate Change movement accepts that there are natural causes of temperature changes (eg solar radiation) alongside the manmade ones they allege, I though that was built into to all the standard appraisals.
In any case this a widely used graph showing dramatic temperature fluctuations over time long before mankind starting billowing smoke out of steam engines
I don’t think anyone is suggesting ditching all fossil fuel powered equipment. It is net zero – not absolute zero.
As the Climate Change agenda has progressed over time C02 suppressing restrictions (present and proposed future) have become more and more extreme. I have no doubt at all that as ICE private vehicles are increasingly phased out so attention will turn to commercial and engineering versions. Remember, this isn’t about human-assisting practicality (though I have no doubt many involved see it as such), but rather the pursuit of a religious-style dogmatic goal
Regardless of whether reliable and powerful construction equipment (ie powered by fossil fuels rather than electrically charged by intermittent wind or sun, or hugely expensive nuclear) continue to exist, future major engineering challenges (including those related to any rising sea levels) will take place against a backdrop of a dramatically poorer humanity generally far less capable of dealing with them.
If you don’t think Green measures cause poverty to increase and living standards to drop, just take a glance at what is happening right now in the UK – massive energy inflation leading to massive general inflation
At the same time as we are sitting on hundreds of years worth of coal and hundreds of years worth of frackable gas which if properly exploited would lead to all these prices plummeting / people becoming far less poor (and at least not in danger of death through lack of heating or nutritious food); it is simple supply and demand.
In terms of the technical arguments about the role of C02 in the atmosphere, the particular impact of manmade components etc:
Humanity’s contribution to the increase is probably close to 100% with the result that at least a third of the CO2 up there is probaby human caused. You are making the common error of confusing the fact that 3% of the annual input of CO2 ishuman. However, prior to that 3% the input and output had come into balance – so the excess is almost entirely human.
There is no convincing evidence whatsoever that the small human C02 component (3% annually) hangs around in and builds up in the atmosphere whilst the rest floats off – it is chemically identical to the natural variety so why would it?
The basis for this theory (and hence indirectly the whole anthropogenic climate change one) is that C02 levels are naturally level, but they have recently been rising and the only new factor is ever-increasing human C02 emissions since the onset of the Industrial Revolution.
But this claimed natural equilibrium of atmospheric C02 is based on extreme historical cherry picking, as this graphs clearly shows:

So if C02 (and obviously also temperatures, with no correlation whatsoever between the two) can indeed fluctuate wildly before humans even existed, the whole pseudo-scientific hypothesis collapses back into the political-ideological agenda it has always been.
And all that leaves aside the fact that even if humanity was somehow to be causing temperature rises there is no evidence that the proposed ameliorative approach of abandoning all the massive benefits of highly concentrated and reliable fossil fuels would do anything other than on balance make everyone much poorer (something which doesn’t affect the many political, celebrity and other leaders of the movement who are already so comfortably off that they are shielded from any genuine material hardship)
To sum up it is the ill-conceived Climate Change agenda itself which is inexorably leading to a humanitarian catastrophe, not the alleged temperature and weather alterations it is using as its enforcement mechanism.
I am afraid I don’t have time to do your comment justice. So I will just pick up on a couple of things that can be addressed quickly.
In any case this a widely used graph showing dramatic temperature fluctuations over time long before mankind starting billowing smoke out of steam engines
These are fluctuations over 10,000s of years. We are talking about sharp rises over the next 100 years.
So if C02 (and obviously also temperatures, with no correlation whatsoever between the two) can indeed fluctuate wildly before humans even existed, the whole pseudo-scientific hypothesis collapses back into the political-ideological agenda it has always been.
This is even worse! It is change over millions of years. Over those timescales continents move and the power of the sun changes – enormous but very slow moving factors that have a massive effect on climate over those timescales.
There is no convincing evidence whatsoever that the small human C02 component (3% annually) hangs around in and builds up in the atmosphere whilst the rest floats off – it is chemically identical to the natural variety so why would it?
The basis for this theory (and hence indirectly the whole anthropogenic climate change one) is that C02 levels are naturally level, but they have recently been rising and the only new factor is ever-increasing human C02 emissions since the onset of the Industrial Revolution.
Actually the human component is not chemically identical. It has a different isotopic footprint. But in any case the excess CO2 is not necessarily the same CO2 as that created by man. Co2 is well mixed. Man adds to the total input and most of the input gets recycled but man’s addition simply means total input exceeds total output.
I think this is a good explanation of why we are certain the recent doubling of CO2 levels is anthropogenic. It is one of the less controversial claims and accepted by many sceptics.
“This is even worse! It is change over millions of years. Over those timescales continents move and the power of the sun changes – enormous but very slow moving factors that have a massive effect on climate over those timescales.”
Essentially true but whether or not it is worse is unprovable and hangs on purely emotive belief. The amount of land may vary because sea levels have gone up and down as ice caps have appeared and disappeared. The distribution of land between the Northern and Southern Hemispheres has altered. Both of these paleo-geological phenomena would have had an effect on temperature because land has a far greater radiative potential than water. But whether or not it is worse than the present period is unknowable.
It may be accepted by us sceptics that there is some anthropogenic input but atmospheric CO2 content hasn’t doubled. It has increased from the ‘pre-industrial’ 280 ppm to 415 ppm. That’s not doubling. It should be noted that it has been as low as 180 ppm in recent periods and that widespread plant-death would begin to occur at 150 ppm.
I think there is a misunderstanding. All I meant was that it is even worse drawing conclusions about the present day from that chart than drawing them from the previous one. I did not meant that the distant past was worse than the current period in some way.
You are right of course – 280 to 415 is not quite doubling – it is about an 80% increase. This chart from the article I linked to above puts it in perspective.
On the widespread plant-death at <150 ppm. I found this nice comment which summarises the complexity of the answer.
During the glacial periods in the past three million years, CO2 concentration got down to 180 ppm (once; usually it was around 200). In the inter-glacial periods, it rose to around 300 (again, once, mostly it rose to around 280).
Of course, scientists are curious: if plants don’t thrive in low CO2, how did plant life survive the glacial periods?
It turns out that different plants have different responses to extremely low CO2 (tested at levels as low as 50–70), that the two types of photosynthesis (C3 and C4—the numbers are subscripts in proper notation) respond differently, that adaptation to low CO2 (180–200 ppm) can be seen within five generations, that plants show shifts in growth between root, stem, and leaf, and more.
I found this overview of the varying scientific papers very interesting, and it cites lots of other papers to investigate, too: https://nph.onlinelibrary.wiley.com/doi/pdf/10.1111/j.1469-8137.2010.03441.x
Thanks for at least reading and making some response to my admittedly over-voluminous piece – I’ll try and be briefer this time!
My overall criticism of the Climate Change agenda is really more about the vast costs involved in abandoning fossil fuels, lack of reliable and efficient replacements (even nuclear is still far more expensive and cannot be readily powered up and down) and the necessary suppression of individual freedoms involved than any technical arguments about causes of temperature increases (or decreases); which have to be dealt with regardless of the source.
But I still think the anthropogenic Climate Change science is incredibly weak:
These are fluctuations over 10,000s of years. We are talking about sharp rises over the next 100 years.
These alleged sharp temperature rises over the next century are obviously computer model based prophecies rather than anything that can be claimed with certainty.
All the Climate Change modelling to date has extensively over-estimated temperature increases as they have actually transpired.
And the real underlying picture of about plus 1.5 celsius since 1850 (taking place in a zig zag rather than straight line form) does not reveal anything either alarming or outwith normal historical patterns.
But the main point of using these sorts of graphs – which incidentally are not detailed enough to show whether or not there have been previous relatively sharp changes over 100 year periods and are largely based on inherently unreliable proxies in any case – is to show that global temperatures certainly do vary notably over time with no human involvement whatsoever.
This is even worse! It is change over millions of years…But in any case the excess CO2 is not necessarily the same CO2 as that created by man. Co2 is well mixed. Man adds to the total input and most of the input gets recycled but man’s addition simply means total input exceeds total output.
Again the point is that it shows that C02 does not inherently and inevitably sit at a level equilibrium unless humans step in and ruin everything.
It’s actually a very odd concept to believe that such a massively complex, variable and chaotic system as global C02 emissions, absorption, atmospheric integration and escape into outer space would be likely to operate in a balanced way over long periods of time – if that has indeed been the case recently it must have been a coincidence and historical aberration.
I think the C02 equilibrium argument is ultimately based on the same ‘Mother Nature Knows Best’ environmentalist faith position that claims that so-called ‘eco systems’ work perfectly and in harmonious balance – again until these monsters in human form trample over and disrupt everything!
These alleged sharp temperature rises over the next century are obviously computer model based prophecies rather than anything that can be claimed with certainty.
I was referring to changes in CO2 levels not temperature and it was what has happened over the last 100 years – not a future projection.
All the Climate Change prophetic modelling to date has extensively over-estimated temperature increases as they have actually transpired.
Actually surface temperature rises have mostly fallen within the 95% confidence limits of most models. This video explains it all quite nicely: https://www.youtube.com/watch?v=f4zul0BuO8A
global temperatures certainly do vary notably over time with no human involvement whatsoever.
Yes – but not on timescales of hundreds of years and with dramatic consequences that we would find hard to live with if they happened very quickly.
It’s actually a very odd concept to believe that such a massively complex, variable and chaotic system as C02 emissions, absorption, atmospheric integration and escape into outer space would be likely to be operate in a balanced way over time.
I though that when I first heard about it but actually it is not so odd because there are powerful negative feedback components which automatically lead to stability. For example, as CO2 levels rise then the oceans will eventually absorb more owing to the increase in partial pressure. So if there is an increase in inputs (for any reason) the level of CO2 will rise and therefore the level of outputs will inevitably rise until they match the inputs. However, this process takes time and, of course, it results in a higher level in the atmosphere.
I was referring to changes in CO2 levels not temperature and it was what has happened over the last 100 years – not a future projection.
I am afraid if you reread your original quote and my response you will see that it was indeed a discussion about projected temperatures (but an easy mistake to make amongst the huge quantity of things we have been looking at)
Actually surface temperature rises have mostly fallen within the 95% confidence limits of most models. This video explains it all quite nicely: https://www.youtube.com/watch?v=f4zul0BuO8A
Here’s an alternative climate change modelling versus reality graph (only extending to 2015, but the pattern of exaggeration continues) to the much more simplistic ones in this video
Yes – but not on timescales of hundreds of years and with dramatic consequences that we would find hard to live with if they happened very quickly.
We can in fact easily adapt almost immediately to even very dramatic temperature changes – think UK farmer who emigrates to Australia and has to not only cope with the much greater heat himself but change all his old farming methods right away.
1.5 celsius over a 170 year period does not reveal anything like that in any case, and the future projections are wild conjecture (see above graph).
I though that when I first heard about it but actually it is not so odd because there are powerful negative feedback components which automatically lead to stability.
That is just another way of saying that C02 is fated to rest at equilibrium – I simply disagree, as does the graph showing huge swings over time (and for the sake of this feedbacks leading to equilibrium argument the timescale is irrelevant)
On model accuracy.
There are three ways the sceptical community make them look bad.
1) Show models based on very pessimistic assumptions about CO2 emissions which did not happen in practice and omit models based on the CO2 emissions that actually happened.
2) Ignore confidence intervals – all models include stochastic elements and so predictions fall into a range – but the sceptics only show the mean.
3) Concentrate on the mid-troposphere predictions not the surface predictions. There is indeed a recognised problem here that the models tend to overestimate mid-troposphere but they are pretty good at surface temperature.
Your chart, which I have seen many times uses 2 and 3 – I am not sure about 1 as it doesn’t say which RCPs are being used.
That is just another way of saying that C02 is likely to rest at equilibrium – I simply disagree, as does the graph showing huge swings over time (and for the sake of this feedbacks leading to equilibrium argument the timescale is irrelevant)
But these swings are over millions of years. I am talking stability over thousands of years.
There are three ways the sceptical community make them look bad.
1) Show models based on very pessimistic assumptions about CO2 emissions which did not happen in practice and omit models based on the CO2 emissions that actually happened.
I was talking about future modelling, not hindsight evaluations (of either C02 or temperature)
2) Ignore confidence intervals – all models include stochastic elements and so predictions fall into a range – but the sceptics only show the mean.
This graph obviously shows a very wide range of models (presumably the mean of each individual one if that is what you meant) alongside the overall mean tendency, which seems to be a perfectly fair and accurate representation of the extent of the exaggeration involved.
It is very important to remember that all computer future modelling is at best educated guesswork, often with a strong bias towards preferred outcomes.
Remember Professor Ferguson’s dire Covid warnings based on modelling (and all his previous wild over-estimates of viral death tolls).
But these swings are over millions of years. I am talking stability over thousands of years.
Looking at the slopes involved changes clearly are taking place over thousand year periods, in any case the issue here is not time scale but a claim of fundamental C02 equilibrium based on feedback mechanisms.
I was talking about future modelling, not hindsight evaluations (of either C02 or temperature)
I thought we were discussing whether the models are accurate in practice – clearly you can only do that for the past.
This graph obviously shows a very wide range of models (presumably the mean of each individual one if that is what you meant) alongside the overall mean tendency, which seems to be a perfectly fair and accurate representation of the extent of the exaggeration involved.
I don’t agree. But anyhow point 3 remains. It is known that the models overestimate the mid-troposphere measurements. There is a discussion of it here. They have done much better at estimating surface temperatures.
It is very important to remember that all computer future modelling is at best educated guesswork, often with a strong bias towards preferred outcomes.
Wow! You have just thrown out vast tracts of science. Here is the list of examples of computer modelling in Wikipedia:
Specific examples of computer simulations follow:
Looking at the slopes involved changes clearly are taking place over thousand year periods, in any case the issue here is not time scale but a claim of fundamental C02 equilibrium based on feedback mechanisms.
I think you are being a bit fanciful here – I can’t see a change over less 30 million years.
Timescale is all important. Any complex system can be stable over a short period but unstable over a longer period. Your body is a good example. Negative feedback system maintain a roughly constant temperature over a period of years – but then something fundamental changes – like getting cancer- and a new equilibrium is found (with luck)
On computer modelling I should also have pointed out that I fully accept it can be a useful tool when dealing with basic and predictable chemical or other purely physical processes as a way of relatively quickly assessing various potential situations and interactions (i.e. carrying out simulations).
To me this is just the traditional science of experimental observation using a lightening fast modern tool instead of old fashioned test tubes, pen and paper etc.
Where predictive modelling falls down, however, is when it attempts to deal with complex scenarios involving at least some variables which are either to all intents and purposes random, or unknown / unknowable.
The almost infinitely complex global climate and its changes over time is a perfect example of all the above. Even short-term weather forecasting, for example, is very very far from an exact science.
Though it’s a largely a by-the-by to climate science, I would also rule out any predictive modelling relating to human behaviour because of the existence of free-will. That is why all the standard Covid models – the ones which were used as excuses to close down entire societies, ruin economies and health services etc etc etc – failed so spectacularly.
RE I think you are being a bit fanciful here – I can’t see a change over less 30 million years.
The graph consists of sloping and curved lines, not step shapes, which means that the changes are happening at all points between the peaks and troughs, including obviously thousand year periods.
So in terms of feedback mechanisms creating naturally equilibrius C02 levels which only adjust every so often due to new factors intervening, the highly complex, sloping and non-linear nature of the historical pattern does not seem to demonstrate this. The only relatively straight line is in the last couple of million years, and even that shows some sloping and curvature.
Good news, the UK is one country that could do with being warmer
Yes, it would certainly reduce energy costs in winter.
It would, now we just need it to actually happen
But you won’t be happy with the mass migration from the un-inhabitable central belt of the globe.
LOL Was the equator uninhabitable during the Holocene?
Even the IPCC assures us any warming will be in the hemispheres. Equatorial regions will remain largely untouched.
That is what paleo-geologists say happened in the past geological periods. The temperate and polar regions warm up but not the tropics.
I’m perfectly happy with it as warm as it is.
£258,700,000 in 2021, in return for a coin-flip prediction.
Sadly, the Met Office still represents stunning value for money, in government terms.
I believe that everything is 50/50. It either will happen, or it won’t.
No-one on the climate doom side ever seems to be able to think about ‘likelihood’ in their stats
So throwing a six on a die will either happen or it won’t.
Yet there is 1/6 probability of it happening.
Two things to learn here.
Throwing a die is not 50/50.
Isn’t that obvious to you?
Probably not you’re too scared of the weather.
You’re so, well, BINARY.
I find it best to ignore the Met Office. Saves so much disappointment.
Remember their predictions of a “barbecue summer” a few years ago? It rained most of the time.
Then in 2006, we were told to choose plants for our gardens that were hardy, grew in desert conditions and could cope with dry weather. In July 2007 these plants were floating, as there was flooding in many places. Remember poor Tewkesbury and the Mythe works water treatment works? That was just one place.
Anything they say is best viewed sceptically.
It’s the fixation with comparing current temperature trends with the pre industrial era. In the 16-17th century malaria existed in this country, and, as far as I am aware, the particular mosquito and parasite only inhabits warmer areas. However, the medieval and Roman warm periods have been airbrushed out of existence, despite evidence to the contrary.
One of things never discussed is how ‘global temperature’ is arbitrarily defined as ‘global surface temperature’. The article cites, correctly, that the effect on an el Nino event is to redistribute warm heat stored within the Pacific Ocean to water surfaces, the atmosphere and land. There is zero evidence that any net increase in earthly heat has occurred, merely a redistribution in a way that affects perceptions of humans.
A net increase in earthly heat comes broadly from one of three scenarios:
As a result, scientists should be far more interested in the output of the sun, the surface of the earth and the composition of the atmosphere than they should by minor perturbations caused by el Ninos.
But as the el Nino events are quicker, more quickly discernible and with a large short-term perturbation, they are the ‘big thing’.
The el Nino is a super horny one night stand.
Long-term changes in net heat absorption by the earth is what a long-term relationship looks like.
If we go from first principles, the Sun provides the energy to keep the Earth warmer than the frozen expanse of space. When the Suns output drops, as in the Dalton, and Maunder minmums, temperatures on Earth show a corresponding decrease.
During the Dalton minimum the Thames in London frose over enough to hold “frost fairs” on the ice, solid enough to walk an elephant across the river.
When the Sun returns to a higher output, the Earth warms. We are currently in a period when the Sun is at a high output state, and we can see the Earth has warmed during this time.
During period of highs output, El Nino ocean states are more frequent then La Nina events. The reverse is true during periods of low output from the Sun. Whichever is more frequent dominates Earths temperature.
These periods are cyclical, we don’t have enough data to determine with any accuracy the cause or length of these Sun cycles. During a prolonged period when the Sun has a lower output we get much cooler temperature on Earth, e.g. the little ice age, that occurred after the Medieval warm period when Sun had been in a prolonged higher output state.
The little Ice age ended around 1850, when our global average temperature graphs start.
We are currently in a period where temperatures are returning to a natural higher state.
Here is an example of what occurs on Earth during a prolonged higher state ~4940 years ago, trees were growing 100 km further North than the current tree line in the Arctic Tundra, note the growth rings on trees were thicker than the current tree line, indicating much higher temperatures.
Ice core samples show Co2 follows temperature in every historical cycle, i.e. temperature drives Co2 concentration in our atmosphere as oceans gas off when temperature rises, when temperatures fall again sometime in the future during a period of low Sun activity, Co2 will be reabsorbed by the oceans.
From first principles, there is no climate crisis.
The relation between sunspots and temperature is weak. The dip in temperatures during the Dalton minimum is more likely due to volcanic activity at the time. In any case sunspot activity has decreased since 2000 and temperatures have increased – the chart you show only goes up to 2000. Here someone has done the work to extend it to about 2010 and the dip is obvious.
The Dalton Minimum came only 50 yrs after the Maunder, which lasted >100years, comparing the last 10 years of sunspots to make your point is sophisrty. There is a lag in the sytem as evidence by the El Nino/La Nina cycles, and accumilated energy raises or lowers the starting point. Come back in another 80 years, and if the cycles are similar for that whole length people can discuss it in the middle of the Thames.
That tree stump is all you need to show much higher temps are a natural occurance on planet Earth, maybe not on planet bedwetter where you seem to reside.
If you look at your chart you can see the rate of sunspots started to dip about 1980 – so we are talking about 30-40 years of steadily dropping sunspots and rising temperatures.
The tree stump coincides with the holocene maximum. This is a period when artic temperatures were significantly higher than they are now but the global mean surface temperature was only about 0.7C higher and more importantly the rate of change was in the order 0.1C per thousand years. If temperatures were changing that slowly we and nature wouldn’t have much problem adapting.
Steadily dropping output after 180 years of relatively high output, as opposed to the Dalton after ~40 years of relative midrage, before which >130 years of very low output. Between 1600 and 1814, it was not uncommon for the River Thames to freeze over for up to two months at time. Accumilated energy, or lack therof, is a thing.
The Holocence maxima was ~8000 yrs ago, that tree grew 3000 years later. How many SUVs and coal power stations were knocking about in the Holocene?
Absoloute nonsense. Nature has no problem adapting, unless you believe everything in nature, including humans, evolved less than 8000 years ago, so suddenly it’s different. Ask a wooley mamoth how slow the last deep cold period came, some were entombed in a standing position.
Nature was thriving in much higher temps, it’s lower temps where Nature stuggles to adapt, or there’d still be trees growing where that stump is.
Steadily dropping output after 180 years of relatively high output, as opposed to the Dalton after ~40 years of relative midrage, before which >130 years of very low output. Between 1600 and 1814, it was not uncommon for the River Thames to freeze over for up to two months at time. Accumilated energy, or lack therof, is a thing.
I think we will have to agree to differ on that.
The Holocene maximum was ~8000 yrs ago, that tree grew 3000 years later.
See here.
The warmest 200-year-long interval took place around 6500 years ago ….
The tree grew about 1,500 years after that when things would still have been relatively warm – especially near the poles.
Nature has no problem adapting, unless you believe everything in nature, including humans, evolved less than 8000 years ago, so suddenly it’s different. Ask a wooley mamoth how slow the last deep cold period came, some were entombed in a standing position.
You say nature has no problem quickly adapting and provide an example which clearly hasn’t! There have been mass extinctions and smaller scale extinctions and many of them are put down to climate.
along with other hypothesis
.
OK, now where were those SUV’s and power stations?
They’ve moved the Holocene maxima since I last looked, thanks for the reference. This is from your reference (a modelled proxy study) [why no presentation of the raw data I wonder]
How do you read that without recognising greenhouse gasses play a very minor role in global warming, when it’s clear something else is the main driver?
OK, now where were those SUV’s and power stations?
Greenhouse gasses are not the only climate forcings. Others include orbital variations, changes in albedo, volcanic eruptions and, yes, to a small extent changes in solar irradiance. The point is that these are not going to cause changes as quickly as changes in greenhouse gasses.
How do you read that without recognising greenhouse gasses play a very minor role in global warming, when it’s clear something else is the main driver?
See above – there are other forcings. However, given the typical variation in other forcings, they change the climate relatively slowly, in this case over thousands of years (an exception may be large scale sustained volcanic disturbance, but there isn’t much we can do about that but hope). Even greenhouse gasses have been relatively slow in the past because the rate of change of ghgs has been slow compared to the last 200 years.
So you agree there are larger forcings than greenhouse gases, it’s a start I guess.
You don’t seem to know the effects of Co2 are logrithmic, the rate of change has little effect once the total aproaches the top of the logrithmic curve, as it is now, so rate of change is really a strawman, unless you did know, in which case that would be sophistry.
this graphic shows carbon dioxide’s contribution to the whole greenhouse effect:
http://wattsupwiththat.files.wordpress.com/2010/03/co2_modtrans_img2.png
https://wattsupwiththat.com/2010/03/08/the-logarithmic-effect-of-carbon-dioxide/
Yep, Orwellian Co2.
So you agree there are larger forcings than greenhouse gases, it’s a start I guess.
Of course it depends on how much GHG over what timescale. No one in their right mind would dispute that the sun being much less bright 4 billion years ago had a massive effect on the climate. If you think climate scientists are claiming that GHGs are the only forcing then you are attacking a straw man.
You don’t seem to know the effects of Co2 are logrithmic, the rate of change has little effect once the total aproaches the top of the logrithmic curve, as it is now, so rate of change is really a strawman,
Your conclusion doesn’t follow from your premise. Climate scientists know that the effect of CO2 is logarithmic – that’s why they concentrate on the effect of doubling CO2 levels not the effect of increasing CO2 by a certain amount. That doesn’t mean that the rate of change has no effect – it means the change from say 200 to 400 has roughly the same effect as 400 to 800. It doesn’t mean it stops! On top of this you have to add positive feedback effects – such as water vapour (see below) and decreased albedo.
I am going to have to stop now – you are welcome to the last word.
I’ll approach this from a different angle.
If our leaders really believed what they say, they wouldn’t have the immigration policy they do.
OK MTF thanks for the cordial discussion, I appreciate these threads can be time consuming. I’ll just point out an error you made in the first post (besides my graph is actually longer than your graph) you said:
The recent sleepy Sun does seem to be showing in temps, I expected a longer lag tbh, but there’s a clear downtrend in temps since 2015 (in spite of rising Co2):
https://www.woodfortrees.org/plot/
of course we will see a spike which may negate the downtrend as El Nino dumps ocean energy from the sun into the atmosphere on it’s trip out of Earth systems into space.
We can’t worry about things beyond our control.
Isn’t the climate beyond our control? I think it is.
Your Nature study is barely worth the paper it’s written on. We know medical science is considered so bad that up to 50% of it is useless.
Climate science doesn’t approach medical science in accuracy or quality. And whilst I’m as critical of the science of one side, as I am the other, the sheer volume of crap studies churned out with ‘climate’ included somewhere to ensure it gets funding is just ludicrous.
‘Chuck enough shit at the wall and eventually some will stick’ type science.
Then there’s the fantastic predictions made by people who should know better, but it doesn’t stop them trying again when their original claim fails.
And I’m sure we have had this discussion before, but data from the past is wildly unreliable, even into the 1970’s when the first satellites were launched.
Huge areas of the planet don’t have weather stations of any description, so temperatures across hundreds, to thousands of miles across regions of Africa (to name just one) are guessed at. To make it sound legitimate it’s called ‘homogenisation’ but represents nothing but a wild guess.
The most laughable thing is, to associate warming with atmospheric CO2 we must understand precisely every source of it and, to date, we have not the slightest idea how many volcanoes, vents and fissures expelling gases are on the sea beds of all the oceans on the planet.
To have the slightest chance of understanding what’s going to happen in the future we can only rely on the data we are largely certain about, which is scarce.
A bit like doing you’re household budget, you might do a mental sanity check: Income – Expenditure = Savings. If that shows you should be saving £1,000 per month and reality is you’re increasing your overdraft by £100 a month, you know something is wrong.
The climate sanity check can be expressed thus:
Assuming increasing atmospheric CO2 is causing the planet to warm:
Atmospheric CO2 levels in 1850 (beginning of the Industrial Revolution): ~280ppm (parts per million atmospheric content) (Vostok Ice Core).
Atmospheric CO2 level in 2021: ~410ppm. (Mauna Loa)
410ppm minus 280ppm = 130ppm ÷ 171 years (2021 minus 1850) = 0.76ppm of which man is responsible for ~3% = ~0.02ppm.
That’s every human on the planet and every industrial process adding ~0.02ppm CO2 to the atmosphere per year on average. At that rate mankind’s CO2 contribution would take ~25,000 years to double which, the IPCC states, would cause ~2°C of temperature rise. That’s ~0.0001°C increase per year for ~25,000 years.
The only real variable is the 3% mankind contributes. So, double it to 6%. That’s 12,500 years to get to 2°C.
Then go from the sublime to the cor blimey and double it again to 12%, that’s still in excess of 6,000 years to reach 2°C.
Let’s just go the whole hog and say ~50% of all CO2 emissions are manmade, that’s still ~1,500 years to get to 2°C.
Difficult to get worried about immediate catastrophe when we do the household budget.
Re: “If temperatures were changing that slowly we and nature wouldn’t have much problem adapting.”
How long does it take people to adapt to dramatically higher temperatures (using common sense heat and sun protective measures) when they go abroad for holidays?
I.e. to ‘cope’ with the the same climatic conditions that the locals permanently and happily exist under?
How long does it take for farmers to introduce the appropriate crops and growing methods if and when temperatures rise (ie the crops and methods used in currently hotter regions)?
Exactly the same questions can be made in the opposite direction re falling temperatures.
Given the obvious answers why on earth (sic!) did humanity decide to revert to ancient climate and weather paranoia?
The answer is the primitivist religion known as environmentalism, and all the malign political and financial agendas which benefit from it.
Correction: I said
Paradoxically the opposite is true, El Nino does appear to increase Earths temperature, but this “spike” in average temperature is measuring energy flow, the Earth is eventually dumping energy to space. La Nina appears to cool the temperature, but it causes a reduction in clouds at the equator, allowing more sunlight into the system. The theoretical 3 Watts/m2 “back radiation” from greenhouse gases only penetrates the oceans ~2 microns depth (a human hair is ~70 microns) whilst hundreds of watts from sunlight energy can penetrate 10 million times deeper.
“It’s the Sun Stupid”
For a much deeper understanding of this phenomia see this thread:
https://wattsupwiththat.com/2022/05/13/the-big-5-natural-causes-of-climate-change-pt-3-how-la-nina-warms-the-world/
I’d be very happy if the average temperature in the NW of England went up, and we got a lot more sunny days! Less central heating, less need to fly abroad to find the sun, we could grow grapes for wine and lots of different fruits, and just think how beautiful those huge juicy tomatoes are in Med countries. What’s not to love?
There are innumerable advantages to the world being a tiny bit warmer, and having more CO2 for plant growth. If we could get economic development in Africa and the asian sub-continent so that they aren’t dirt poor and can live their lives without destroying the forests for firewood, and stop using kids as a pension, then this really ought to be a golden time for the civilisation. The idea that the West effectively stops African countries having running water and sanitation because ‘the planet will boil over’ (Obama’s words), is just evil.
Wonderfully described.
The realities of climate hand wringing.
Are the Met Ofice responsible for the Chem Trails?
If not, who is? When can we have a statement about what is in them and what they are supposed to be doing to the atmosphere?
We all know it’s not about science but ideology.
the Climate change narrative is just another method of wealth redistribution and the de-industrialization and impoverishment of Western countries.
The ‘pre-industrial’ era (around 1850) strangely coincides with the end of the ‘mini ice-age’ (1350-1850) before that the U.K. had experienced much colder weather including the regular freezing over of the Thames. The mini ice-age doesn’t seem to be taught now, how strange
There was another mini Ice Age in the fourteenth century, when wine froze in the bottle and wolves invaded northern French towns. There was a ‘climactic optimum’ in the tenth to eleventh century, when Iceland and Greenland were settled. There was a ‘greenhouse’ type warming in the Eocene period, about fifty million years ago. These swings are always happening, over the shorter and longer term. Overall, we are currently in an interstadial (more benign) phase of a global ice age. In terms of geological history, having any ice at all at the poles signifies an ice age. More often than not, there hasn’t been any.
Yes, El Nino is a concern. Those Americans who value truth, freedom and prosperity are having to deal with El Nina.
Still, at the Met Office, we have Madge to keep us informed, or disinformed.
The Met Office staff and others spreading the lie should be sacked. Of course they won’t be unless we can get rid of Boris & Co. and replace them with a truly British government.
So THATS where Neil Ferguson went to?. We can all safely ignore any warnings.
As a sceptic, I’m naturally inclined to wonder whether Chris Morrison has any personal vested interest in downplaying or denying the existence of man-made climate change?
I’m not saying he has, I’d just be interested to know.
”Fake Invisible Catastrophes And Threats Of Doom” by Patrick Moore. All you need to know about the lies and manipulation.
Tony Heller has been reporting on these ‘man-made’ temperature record adjustments (cool the past, warm the present) for years. Because it’s so blatant, it unfortunately gets accepted as normal. It’s still lying and utterly despicable though, and you wonder if criminal, as it’s so deliberate.
Crooks!
Won’t be surprised if the World Hell Organisation ( WHO ) recommends a CO2 Vaccine! that’s how stupid the whole damned thing is
“Britain’s Met Office says it is a 50-50 call…”
So the toss of a coin, to all intents and purposed.
That’s “the Science” now, is it?
Using wayback machine it can be shown that in the early 2000’s NASA’s Gisstemp (the most adjusted of all temperature data sets) showed that at least in the U.S. 1933 was warmer than 1998. I’m sure I read somewhere that this was also true for global temperatures, but can’t find the source. Since satellite data shows that 2015/2016 were only very slightly warmer than 1998 this means that the peak of current (natural) warming is roughly the same as the 1930’s when there was at least 100ppm less carbon dioxide in the atmosphere.
Organisations such as NASA GISS and Hadcrut can adjust temperature data sets, but they can’t permanently delete previous ones.