

The Prime Minister may have acknowledged reality and stated that being double vaccinated “doesn’t protect you against catching the disease, and it doesn’t protect you against passing it on” but others appear to remain in denial.
On Sunday I asked whether now that the PM had let the cat out of the bag the media would start reporting properly on the UKHSA data showing higher infection rates in the vaccinated than the unvaccinated. It appears the answer is no, at least if the Times‘s Tom Whipple is any indication.
In a typically mean-spirited piece – in which anyone who doesn’t agree with his favoured scientist of the hour is smeared as a conspiracy theorist and purveyor of misinformation – Whipple quotes Cambridge statistician Professor David Spiegelhalter, who heaps opprobrium on the U.K. Health Security Agency (the successor to PHE) for daring to publish data that contradicts the official vaccine narrative. Spiegelhalter says of the UKHSA vaccine surveillance reports:
This presentation of statistics is deeply untrustworthy and completely unacceptable… I cannot believe that UKHSA is putting out graphics showing higher infection rates in vaccinated than unvaccinated groups, when this is simply an artefact due to using clearly inappropriate estimates of the population. This has been repeatedly pointed out to them, and yet they continue to provide material for conspiracy theorists around the world.
This is the graphic he is presumably referring to.
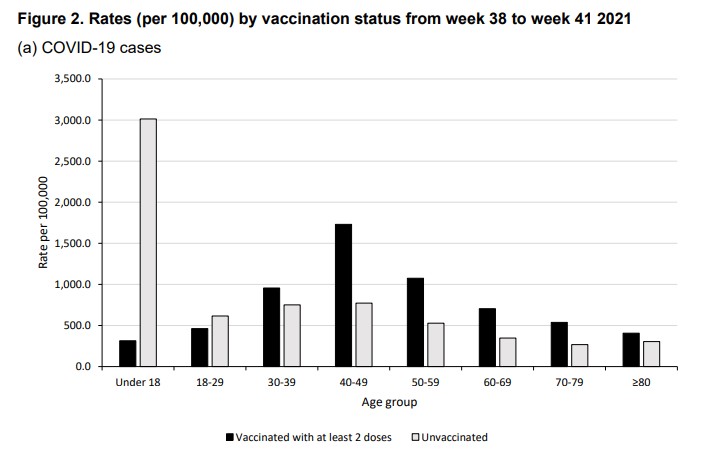
If Professor Spiegelhalter has a source for his claim that higher infection rates in the vaccinated are “simply an artefact” of erroneous population estimates then he doesn’t provide it.
Whipple says the data has been “seized upon around the world”.
The numbers have been promoted by members of HART, a U.K. group that publishes vaccine misinformation. They have also been quoted on the Joe Rogan Experience podcast in the US, which reaches 11 million people.
Appearing on that podcast, Alex Berenson, a U.S. journalist now banned from Twitter, specifically referenced the source to show it was reliable.
The UKHSA is adamant that it is doing nothing wrong. The Times quotes Dr Mary Ramsay, head of immunisation at the UKHSA, explaining: “Immunisation information systems like NIMS are the internationally recognised gold standard for measuring vaccine uptake.”
So Professor Spiegelhalter thinks that the gold standard gives “clearly inappropriate estimates of the population”, and using it is “deeply untrustworthy and completely unacceptable”? That may be his view, but the UKHSA can hardly be criticised for following the recognised standards for its work.
A more measured criticism is provided by Colin Angus, a statistician from the University of Sheffield, who the Times quotes saying that using NIMS data makes sense but the “huge uncertainty” in the population estimates should be clearer.
Whipple, however, goes further and claims that “using population data from other official sources shows, instead, shows that the protection of vaccines continues”. Yet he does not provide those sources or go into any detail about how they back up his claim.
For now, the UKHSA is defending its report (we’ll see how long it holds out for). But even so, Dr Ramsay is adamant that the report rules out using the data to estimate vaccine effectiveness: “The report clearly explains that the vaccination status of cases, inpatients and deaths should not be used to assess vaccine effectiveness and there is a high risk of misinterpreting this data because of differences in risk, behaviour and testing in the vaccinated and unvaccinated populations.”
This defence somewhat misses Professor Spiegelhalter’s criticism about population estimates. But it’s also misleading in that the report doesn’t “clearly” explain that its data “should not be used to assess vaccine effectiveness”. What it says is it is “not the most appropriate method to assess vaccine effectiveness and there is a high risk of misinterpretation”. But, as explained before, using population-based data on infection rates in vaccinated and unvaccinated is certainly a valid method of estimating unadjusted vaccine effectiveness, which is defined as the reduced infection rate in the vaccinated versus the unvaccinated. While a complete study would then adjust those raw figures for potential systemic biases (with varying degrees of success), we shouldn’t necessarily expect those adjustments to be large or change the picture radically. Indeed, when a population-based study from California (which showed vaccine effectiveness against infection declining fast), carried out these adjustments the figures barely changed at all.
The UKHSA report adds: “Vaccine effectiveness has been formally estimated from a number of different sources and is described earlier in this report.” In fact, though, most of those estimates are reported as low confidence (see below), which means: “Little evidence is available at present and results are inconclusive.” While it claims high confidence for its estimates against symptomatic disease, a footnote explains that this only holds for 12-16 weeks: “This typically applies for at least the first three to four months after vaccination. For some outcomes there may be waning of effectiveness beyond this point.”
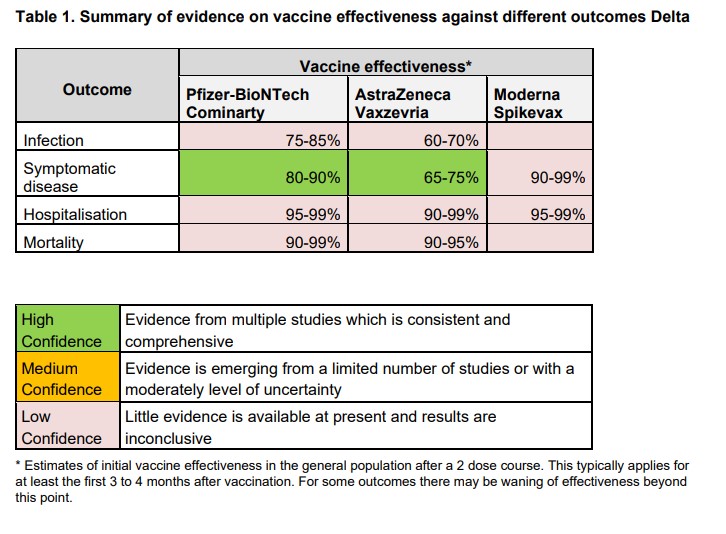
It is precisely this “waning of effectiveness” that the latest real-world data is giving us insight into. Rather than trying to discredit that data and those who report it by throwing around general, unquantified criticisms, scientists and academics like Professor Spiegelhalter should be redoubling efforts to provide constructive analysis to get to the bottom of what’s really going on with the vaccines. If there are issues with the population estimates then those need to be looked at, and if there are biases that need adjusting for then those need to be quantified. But do, please, get on with it – and lay off the smearing of those who raise the questions.


Discussion
Comments
This week across the site:
To join in with the discussion please make a donation to the Daily Sceptic.
Profanity and abuse will be removed and may lead to a permanent ban.
“The party told you to ignore to reject the evidence of your eyes and ears. It was their final most essential command” – G. Orwell
The Probability and Law website (Prof Fenton and O’Neill) http://probabilityandlaw.blogspot.com
explains the disparities between the different estimates of the size of populations of vaccinated/unvaccinated. Unlike Spiegelhalter who simply asserts, they present a reasoned case which shows that actually the numbers of unvaccinated are underestimated. This would make both the risks of being tested positive and all deaths mortality figures better for the unvaccinated and so the relative risk of the vaccinated against the unvaccinated would be worse.
Being of a somewhat cynical frame of mind, I suspect that the reason why governments want 100% vaccination is so that there aren’t any ‘unvaccinated’ to compare against.
Quite ironic that the Professor for the Public Understanding of Risk fails to give any explanation for his assertion, to add to our understanding of what he is claiming.
Thanks RS, Can you provide a link to that article please.
Re: UKHSA COVID-19 vaccine surveillance report for Week 42
https://assets.publishing.service.gov.uk/government/uploads/system/uploads/attachment_data/file/1027511/Vaccine-surveillance-report-week-42.pdf
Using the data in Table 2 on page 13 :
Table 2. COVID-19 cases by vaccination status between week 38 and week 41 2021
The population totals in England for the unvaxxed and double vaxxed can be calculated for each age cohort using the case counts provided for the “Not Vaccinated” and “Second dose ≥14 days before specimen date” and their respective rates / 100,000. These calcs result in a total unvaxxed population of 21,558,191 and a double vaxxed population of 37,682,881 giving a total population of 59,241,071 for non vaxxed plus double vaxxed.
Page 3 of the report states :
By 10 October 2021, the overall vaccine uptake in England for dose 1 was 65.5% and 60.4% for dose 2.
So, the 37,682,881 double vaxxed calculated above from the rates / 100k, should equate to 60.4% of the population, which works out at 62,388,876
If that is accurate then, this leaves 3,147,805 ( 5% of 62m ) difference from the calculated population totals above, who are neither “not vaxxed” nor “double vaxxed” = single vaxxed.
The problem of checking these population figures is proving difficult.
The most… Read more »
Just to add to that this is the calculation I did last week when the report came out but it agrees your figures (see attached)
21.6 million unvaccinated
37.7 million double vaccinated
59.2 million unvaccinated or double vaccinated (excludes the partially vaccinated)
And the Norman Fenton paper says
According to the NIMS vaccination survey the population of England is 61,941,471, whereas the ONS population survey estimate is 56,550,138.
It did dawn on me earlier that I was being completely silly (as is often the case) but the vaccine surveillance report table 2 is for England? (it doesn’t explicitly say that).
And so there is a serious overcount of total population going on? Albeit it is how the overcount is distributed between the vaccinated, unvaccinated and partially vaccinated that determines what the effect of that overestimation is on relative efficacy. And that’s the bit where views differ.
Indeed. I assumed Table 2 was for England only, simply because the charts in Figure 1 on page 9 are explicitly stated to be for England on page 8. The UKHSA was PHE also and neither the UK nor Wales are mentioned anywhere in the report.
Thanks. It was when I got the high population figures I started to doubt myself.
Great original post by the way. I hadn’t noticed you could estimate the single jabbed from the overall vaccine uptake figures on page 3.
That the usual suspects are attacking the UKHSA vaccine surveillance report makes me even more confident that it is not only close to the truth, it almost certainly OVER estimates vaccine efficacy against infection, hospitalisation and death. Every attack makes me more determined not to be injected.
It may seem like an innocuous-enough change in the title for an organization that previously was playing second-fiddle to SAGE in its role in “advising” the government and the nation.
However, the difference is, I think, more than subtle; We are universally familiar with the concept of “health”. Hence the perceived role, as well as the description of Public Health England (or PHS, etc), was fairly clearly consolidated and justified in the minds of most of the British public.
According to Wikipedia:
“To protect health and wellbeing and reduce health inequalities”
The protection of health and wellbeing is intuitively perceived to be virtuous, so whatever its misgivings, at least it makes sense as an entity.
But then along came the UK Health Security Agency to take its place. It’s new purpose (bearing in mind this is supposed to be essentially the same organization), again according to Wikipedia:
“For the UK-wide public health protection and infectious disease capability”.
Nowhere in this description is there any mention of “wellbeing”, and the focus now is upon health protection and specifically concerning infectious diseases.
This is in fact a profound shift acting as a milestone in our manipulated psychological descent into an obsession with… Read more »
Wasn’t Spiegelhalter a voice of reason in the early days of the so called ‘pandemic’?
He is undoubtedly an excellent statistician.
What we are seeing – as pointed out elsewhere – is the immense power of group-think and conformity pressure.
Rather than comparing Vaccinated to Un-Vaccinated, due to potential denominator issues with the latter, the most relevant info might be derived from simply looking at the trend in growth or reduction of cases per 100K within each age category in the separate groups.
The 40-49 Vaccinated trend looks the most meaningful, approx. 3-4 months after that group had their 2nd jabs.
I’m wondering if we might get to a situation where the unjabbed as a group has achieved herd immunity and have strong natural protection, whereas the unjabbed keeps spreading it amongst themselves, since they won’t have good protection against potential variants?
I couldn’t edit my comment – it should of course be ‘whereas the jabbed keeps spreading it amongst themselves’ ….
A Question of Vaccines : What happened next ?
Also, where does this discussion end up ?
Scenario:
All of the unvaxxed now have their jabs. Everyone is double jabbed.
But, we know that being jabbed does not prevent transmission or infection.
So what happens next ?
Here is an updated version (today’s date) of the Martin Neil, Norman Fenton and Scott McLachlan paper
Discrepancies and inconsistencies in UK Government datasets compromise accuracy of mortality rate comparisons between vaccinated and unvaccinated
http://www.eecs.qmul.ac.uk/~norman/papers/inconsistencies_vaccine.pdf
There is a response within to the David Spiegelhalter tweet
The full paper needs to be read but this is the direct response to Spiegelhalter
Contrary to the implications in Prof. Spiegelhalter’s tweet, it is not at all clear why the NIMS population estimate is any more ‘biased’ than the ONS estimate (which we believe drastically underestimates the proportion of unvaccinated). Moreover, no such concerns were expressed in previous weeks when rates amongst vaccinated were more favourable despite use of NIMS data for the population denominators. However, even though we are interested in mortality and not ‘cases’ getting the most accurate estimates of the number of people vaccinated and unvaccinated is equally critical for comparing rates between the two groups.
In summary – there is no way of validating the data, and this cuts both ways.
What is really interesting is that the Narrative starts squealing only when the output heads south.
The wider data is clear – snake-oil shows no useful impact – just wishful thinking.
Though denominators may be disputed, there is clear evidence of a trend in case rates that does not favour the double vaccinated. Taking the 40-49 age group, the last 4 reports show case rates of vaccinated / non-vaccinated (i.e. increased risk) of 1.66, 1.86, 2.09 and 2.24. Even the 18-29 age group does not look good: 0.55, 0.60, 0.67, 0.75.
Protection against infection appears to wane quite rapidly. Is there a scientific basis to suggest that the spike protein vaccines may have a negative effect on immunity? What then? – do we recall the sacked care-home workers and ask forgiveness?
“Follow the science!”
“But the science proves me right.”
“I have now redacted the science. Follow the science!”
Dictionary:
FUD, confirmation bias, cherry-picking – see: Professor Spiegelhalter
More details on this from David Spiegelhalter:
‘Take care with claims about unvaccinated case rates’ by David Spiegelhalter and Anthony Masters
https://www.theguardian.com/theobserver/commentisfree/2021/sep/19/take-care-with-claims-about-unvaccinated-case-rates-covid
This item from ONS provides a more positive take on vaccines preventing infection:
Coronavirus (COVID-19) Infection Survey Technical Article: Impact of vaccination on testing positive in the UK – Office for National Statistics
It opens by saying:
“Vaccination significantly reduced the risk of people testing positive during both the Alpha-dominant period and the Delta-dominant period.”
Does anyone with better statistical skills than me know whether it’s convincing or not?
The Infection Survey is a busted flush.
We will see more and more of this – any data, form whatever source, that contradicts the Big Lie will be brutally suppressed, as will anyone who looks like gaining traction.
Almost every powerful institution on the planet is up the their necks in the folly and evil, they will stop at almost nothing to cover up their wickedness
“It is precisely this “waning of effectiveness” that the latest real-world data is giving us insight into.”
Precisely. I’ve been disappointed in Spiegelhalter for some time – he seems to have been captured by the Narrative, given that what I’ve seen of his interventions have always been on that side, whilst all the other egregious data errors seem to have gone largely unremarked.
There is contrary analysis from Professor Norman Fenton (Queen Mary College) – easily the equal of Spiegelhalter in the field of Risk assessment , but also subjected to attack and censorship – which suggests greater reliability in academic terms. See :
Comparing age adjusted all-cause mortality rates in England between vaccinated and unvaccinated (normanfenton.com)
Fenton has been consistent and strong rather than selective in his attacks on data inaccuracy from the start. Spiegelhalter pops up occasionally.
In terms of real world data – we can now see that, in broad observational terms, comparing 2020 with 2021, there is no strong evidence of vaccine efficacy – after jabbing an insane proportion of the population.
Further this inefficacy was known through absolute reduction figures from at least these sources :
(a) early test data from Israel
(b) the submission… Read more »
Ah, the old ‘shoot the messenger’ ploy.
There is now plenty of evidence that being double-jabbed does not protect a person from getting Covid. A good friend of mine was off work for a week with the virus, even though she’d had two shots of the Pfizer “vaccine”. Would she have suffered a more severe illness if she’d not been jabbed? It’s a moot point, but I’m not convinced the answer to that question is “yes”.
Surely the most important point is that even if you use a different denominator and get a improved vaccine ‘efficiency’ as a result that efficiency has been declining rapidly over time? If you always use the same denominator and compare like with like and the result is changing then you are seeing a real effect. Its obvious that vaccine efficiency at preventing transmission is declining fast after 3 months post injection, it could be actually negative now, or it could be having no effect at all vs the unvaccinated, either way, its dropped massively.
I wonder how much Whipple, Spiegelhalter&co will like this data, calculation and conclusion:
ONS Data reveals the Fully Vaccinated are 6 times more likely to die than the Unvaccinated due to all-causes
Raw Covid-19 Mortality and All Cause Mortality Data from the UK Office of National Statistics (ONS) has revealed that double vaccinated people were six times more likely to die of All Causes than unvaccinated people from the end of April to the beginning of July 2021. This is the first time the government has published…
https://theexpose.uk/2021/10/27/fully-vaccinated-6-x-more-likely-to-die-than-unvaccinated/
(3x as much adjusting for more elder people being vaxxed initially)
Like the climate charlatans, these people run a mile from real world evidence, maintaining that only the models can be trusted.
‘Artefacts’ on the part of the UKHSA versus ‘arty facts’ presented by our elected government and their MSM running-dogs.
The time for Professor David Spiegelhalter to have made his argument about ‘artefacts’ was surely when such comparisons first appeared. Of course, he didn’t squeal earlier because it suited him not too, since in many age groups the vaccine was then showing a marginal benefit.
But as has been pointed out before, it makes little difference if the unvaccinated denominator (for the rate calculation) has a degree of uncertainty. Put error bars of +/- 50% on the unvaccinated rate if you wish and the story stays the same: there is no statistically significant benefit to vaccination.
It is astonishing that Professor David Spiegelhalter thinks otherwise when studies from various countries, including Israel and Qatar, show the very same phenomenon, as did the cohort in the Pfizer trials who were vaccinated last year, and as Pfizer admitted to the FDA on September 17 that their vaccine effectiveness against infection was ‘not statistically significantly different from zero’.
Perhaps Professor David Spiegelhalter should turn his fire on Pfizer for that rare flash of honesty (there was an ulterior motive, though: to have boosters approved because the vaccine effectiveness was shot after a few months).
Quite. Also Scotland data (although that seems as shonky as the rest).
All this data shows is the government mandated experimental injections cause a significant increase in the risk of illness and death from the disease the injections are claimed to immunize. I don’t see what all the fuss is about.
Having looked through some of the published papers on vaccine side effects I found one that said the Pfizer version was safe. Fortunately authors have to declare any sponsorship of the research, for this paper the listed sponsors included Pfizer and the Gates foundation.
I came across something similar a few years ago when looking at the side effects of statins, there was one paper that said they didn’t cause raised blood sugar or muscle aches. That paper was sponsored by the manufacturer of one of the main statins used in this country.
If ever I look at any literature that says there’s no evidence of a problem when others say there may be, then I always check the affiliations of the author(s). Always be cynical and sceptical.
Does any of the stats take into account the number of school children using orange juice to get a positive result and bunk off school?
My son says he knows two kids who swore Sprite did it for them. Why waste perfectly good orange juice.
I’ve got a load of those lateral flow test things. My mother in law pushed them on us when our daughter got a cold, for some reason. They’ve just been sitting there, gathering dust. I’ll put them to good, scientific use, and report back.
For anyone who wants complementary data sets that show the UKHSA are reflecting what is seen elsewhere in the UK, you can see here.
https://www.health-ni.gov.uk/publications/vaccination-status-deaths-and-hospitalisations-previous-publications
https://www.health-ni.gov.uk/publications/vaccination-status-deaths-and-hospitalisations
This is data for Northern Ireland. In particular look to deaths by vaccination status (table 2). All adults.
Partially vaccinated (12.4 per 100,000) + fully vaccinated (11.7 per 100,000) = 24.1
Unvaccinated = 20 per 100,000
**Yes 24.1 v 20 for all adults.**
They should always be aggregating these partially and fully vaccinated groups in my view but they split them into two categories and many people will miss it.
I am even then still not happy with the definitions, but there you go.
Finally, the data there lines up with Public Health England data – as in around 75% of deaths in September for NI (the 4th deadliest month of the pandemic with 80% adults vaccinated).
I’m not sure it’s valid to add those two numerators together. They are for different groups. For example, if you were saying 10 per 100,000 men and 10 per 100,000 women then that doesn’t equal 20 per 100,000 people.
What it does tell us though is that the difference between one clotshot and two is statistically negligible. This means either the second clotshot is unnecessary as it has little benefit, or the unvaccinated stats are fraudulent.
Most people seem totally unable to grasp the concept of real levels of risk.
Good point. I glimpsed at it earlier and came to the same conclusion that you couldn’t add the two figures together.
It’s a good question, but actually – you can add them together because they are normalised. eg, if 1 in 10 is green and 5 in 10 are blue, then 6 in 10 are either blue or green. That is what BEPOP… was saying. You cannot simply add the raw figures and then normalise, but by using the same denominator, they are comparable. Or to to use the example above, if 50,000 out of 100,000 are women, and 50,000 out of 100,000 are men, then 50,000 + 50,000 out of 100,000 are either men or women.
Oops – on reflection I think my comment above is incorrect as they are different populations.
The exact same population estimates used in the ‘cases’ table of the vaccine surveillance reports are also used in the hospitalised (after emergency care) and deaths tables to determine the rates per 100,000.
Will’s articles have much more caveats about the ‘cases’ figures than the hospitalisations and deaths. And yet the supposed efficacy against hospitalisation and death may be because the unvaccinated proportion is understated. So he can hardly be called a purveyor of mis-information etc.
The key to me is not whether the total population figures are right or not it is whether the proportion of unvaccinated vs double experimentally vaccinated is correct.
In the 70-79 age group, if we take out the partially vaccinated, then of the remaining population of either unvaccinated or double ‘vaccinated’, the figures assume 95% of the age 70-79 age group is double ‘vaccinated’, and 5% unvaccinated.
Given that there is twice the rate of ‘cases’ in that 70-79 age group in the double ‘vaccinated’ group, the true proportion of unvaccinated in the 70-79 group would need to be about 97.5% in order that the ‘case’ rate is the same in the vaccinated and double ‘vaccinated’. Is Spiegelhater really claiming that more than 97.5%… Read more »
The old saying, “you are entitled to your own opinion, but not to your own facts” comes to mind.
I still back vaccination for adults 30+ (not sure about boosters and won’t get mine). I also totally back those who have seen the data on bad reactions, know that there is less than a year of data and say, “no thanks.” Clearly Mr. Whipple does not.
There is a pretty clear reason behind this. The vast majority of 30 plus unvaccinated have been infected. Yes, the greater percentage of real Covid deaths are among unvaccinated (and so the least healthy have sadly died), but the rest of the population they now have a stronger immunity base than those jabbed, and it hasn’t waned as much (still today, true double infections in people whose first was symptomatic is exceedingly rare).
why can’t we just allow people all the data and to make free choices?
Right, because some people want to remake society in their own image.
30+?
Why.what happens at 30 years of age that means that metric alone determines your need for a vaccine? Please include harms from this medical treatment in your assessment
I could understand backing the jab for the over 70s and for those whose immune systems aren’t all that, but why for over 30s, especially once waning immunity is considered and you’re against, what one can only logically conclude, is never ending rounds of ‘boosters’?
Simple answer: at 30 or 31 the risk of death from the vaccine becomes less then risk of death from Covid. I’m working with the best data I have at this point (how many deaths from the vaccine…yeah, that is hard to find).
You are right that truthfully only those 70+ and immuno compromised should have been encouraged to be jabbed and then leave it open to others. I got jabbed (age 50 at the time) because a) we were told get jabbed or lockdowns forever and b) the NHS ruled me immuno compromised. News to me but, I guess 500+ kidney stones (no, really) makes me such.
As more data comes out of vaccine issues, that line will rise to older and older. I’m just trying to base it on death vs death. Do I honestly think a 45 year old in good health should get jabbed? Um, no. But that is their decision to make.
But basic answer was the crossing point of fatality age risk.
Given that the long-term risks are unknown, that’s a very shaky claim. The decision is actually between a known very small risk from catching the virus, and an unknown risk (which could be large if ADE proves to be an issue) from the ‘vaccine’.
How do you do these calculations?
I based mine (age 48, female, BMI 21, good overall health) on http://www.qcovid.org risk of death in 3 month pandemic period of 1 in 55,000.
Vs risk of death from vaccine: seems to be at least 1 in 30,000. Quite possibly it is 1 in 10,000. Eudravigilance data suggests it is around that level.
I think a 3 month window is fine to use, as the vaccines also only have a benefit for around a 3 month window, as far as I can tell. Conveniently.
Maybe my BMI is the big differentiator? That needs to be considered.
(ETA also I now have COVID, so I know my risk of death from it unless I suddenly keel over, is actually zero. Though I’d better avoid walking under a bus in the next 22 days, as otherwise I could still be a covid death I guess).
I’d forgotten about the qcovid calculator, but it’s a good time to bring that back up.
There were old conversations where we tried to do back of the envelope calculations to relate the risk figure from that calculator with the possible risk reduction that an experimental vaccine might provide in terms of assessing estimated benefits against estimated harms.
Someone who has already had natural infection has I’d argue a lower risk than the calculator suggests. Talking of natural infection are you fully recovered now by the way?
And then there was the issue that a theoretically effective vaccine that stopped you testing positive for covid if hospitalised for another condition but did not prevent your death from that other condition needed to be deducted from the qcovid risk in terms of calculating a potential vaccine benefit.
But there was always an issue, how do you compare the risk of dying from covid in the 3 months around April 2020 with the future risk of dying from covid that a theoretically relatively safe and long term effective vaccine might prevent. Of course it was around March/April 2020 where people were getting ill from the symptoms of covid (albeit that this strongly… Read more »
“at 30 or 31 the risk of death from the vaccine becomes less then risk of death from Covid.”
Irrelevant.
What is relevant is the absolute risk reduction – which is less than minimal.
“I could understand backing the jab for the over 70s”
As one of those old farts – I can’t. Age doesn’t equal senility, and you have to be ga-ga to accept a jab on present evidence, with no controlled testing.
How do you know the majority of 30+ unvaccinated have been infected? The N protein prevalence data suggests 20pct of the population have been infected, and that will be be primarily in those who are either unvaccinated or were infected, then vaccinated. I don’t think you can tell who?
We know it’s not the vaccinated and then infected though.
Loads of double/triple jabbed f*ckwits I know have tested ‘positive’. Funnily enough, when you don’t believe in Covid, and never get tested, Covid never catches up with you at all.
As a double jabbed f*ckwit* several times compulsory tested as hospital inpatient, never been positive despite being immunocompromised thus being due a third primary jab on top of one & two and then a booster jab so four in all just for starters although the health service seem somewhat confused about implementing this.
Not had a cold or flu as far back as I can remember either.
*not through fear of Covid or belief in the efficacy of phoney vaccines rather not wishing to be discomforted at a later stage. Unnecessary as it turned out.
Odd that, isn’t it!
It’s almost as if Covid ‘case numbers’ rely on large numbers of people who have no symptoms, which in previous times would not have counted as ‘cases’ of any infection…