
Israel Begins to Ease Lockdown Restrictions as around 80% Of Its Population Are Now Vaccinated
With almost 80% of its population having been vaccinated, Israel has scrapped the requirement for people to wear masks outdoors....

With almost 80% of its population having been vaccinated, Israel has scrapped the requirement for people to wear masks outdoors....
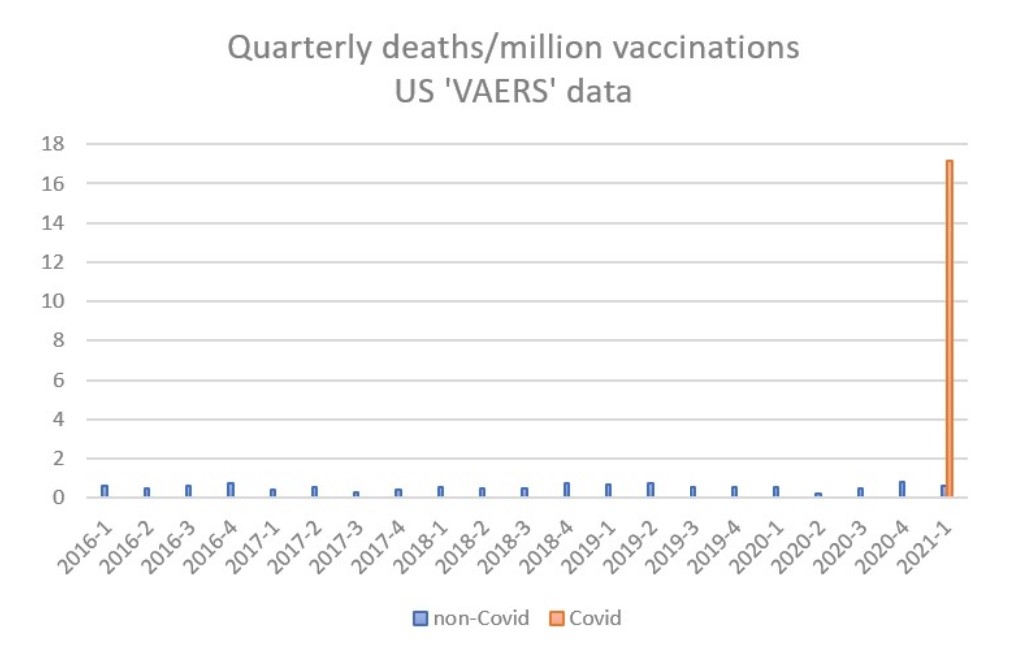
Is the Yellow Card vaccine reporting system fit for purpose? HART's Dr Ros Jones argues no, pointing to the 30-fold...

We're publishing a short piece today by Sinéad Murphy in which she praises a new book called The Covid Consensus...

Nicola Sturgeon has warned that restrictions on international travel should not be lifted too soon because of the "big risk"...

Glen Bishop has analysed a paper produced by one of the SAGE modelling teams and discovered an interesting fact: it...
by Glen Bishop In May last year, after the UK had been plunged into lockdown for the first time, the...

It is still "too early to say" whether the reopening of indoor hospitality can take place on May 17th because...
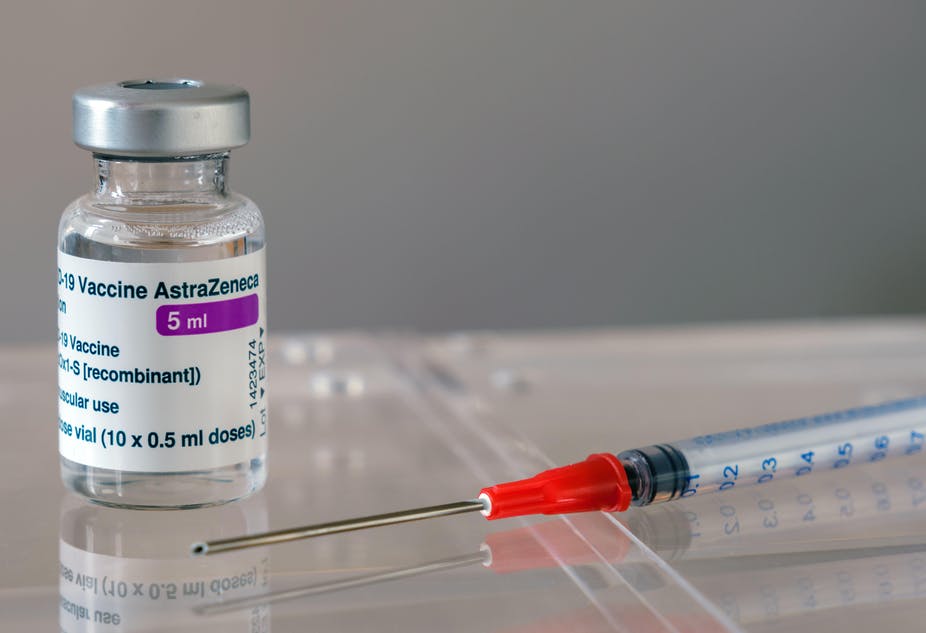
The first cases of blood clotting linked to the AstraZeneca vaccine occurred in January and February but the algorithms used...

A summary of all the most interesting stories that have appeared about the virus in the past 24 hours –...
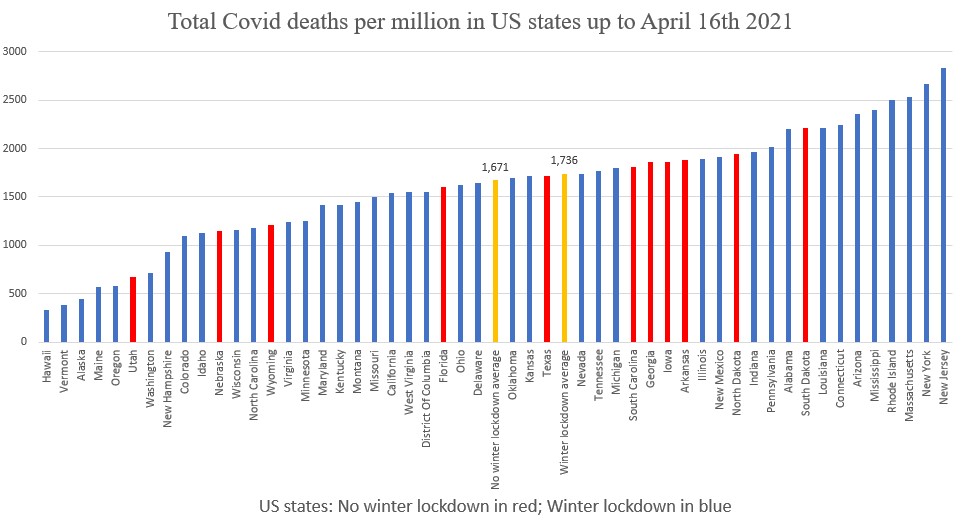
Academics who produce models predicting doom for places which don't lock down should be challenged to hindcast for states which...