
The crew at the Oxford Centre for Evidence-Based Medicine (CEBM) have done an analysis of excess mortality for 2020 across 32 countries to get a clearer picture of the impact of the pandemic and lockdowns. They used excess mortality instead of “Covid deaths”, they explain, to avoid problems with recording and classification of deaths and include any impact of anti-Covid measures. They used age-adjusted mortality to take into account differences in the average age of populations. They compared 2020’s figures to the average of the previous five years to give a percentage increase or excess during the pandemic year (they have made the tool they used to analyse the data publicly available).
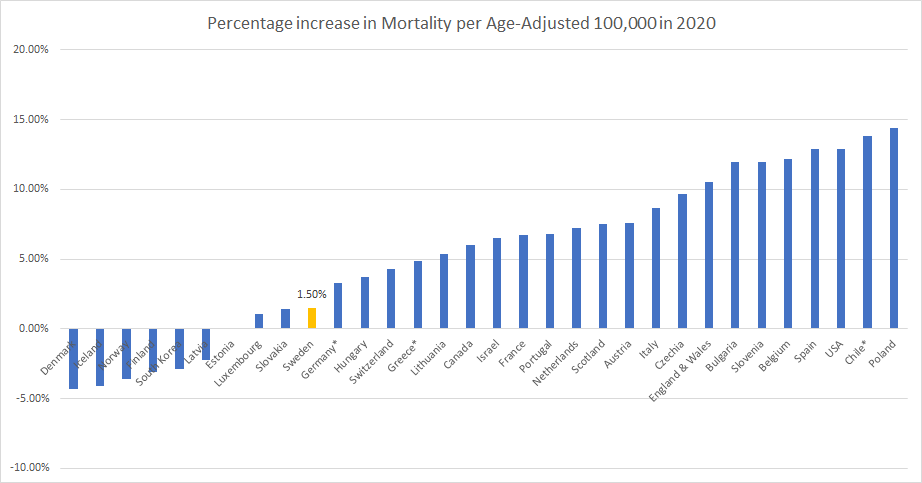
The results are plotted in the graph below. Perhaps the most telling result is that Sweden, which did not impose strict lockdown measures throughout the year (it kept all retail and hospitality and most schools open and imposed no restrictions on private gatherings) saw only a 1.5% increase in age-adjusted mortality. Surely no one can argue that such a small increase in mortality (and almost entirely among the elderly and already unwell) can justify the severe and harmful suspensions of civil liberties we have endured over the past year?
The CEBM team made the following observations on the results.
Relative excess mortality in the countries we have examined ranges from -4.3% to 14.4% and is strongly positively correlated with the recorded number of COVID-19 deaths (r = 0.8). Denmark, Finland, Iceland, Latvia and Norway experienced fewer deaths in 2020 according to our analysis. As we would expect, these countries have recorded a lower number of COVID-19 deaths than other countries. For example, Iceland, Norway and Finland have all recorded fewer than 12 per 100,000 COVID-19 deaths. Denmark and Latvia are perhaps exceptions to this having recorded 32 COVID-19 deaths per 100,000 and Latvia 54 per 100,000.
A number of eastern European countries saw little or no excess deaths in the first half of the year but have experienced significant excess mortality in the second half of 2020. Bulgaria, Czechia, Croatia, Hungary, Lithuania, Luxembourg, Poland, Slovakia, and Slovenia with Poland and Bulgaria exhibiting levels of excess mortality of the same order of magnitude as the countries in the centre of the first wave (e.g. Spain, France, England and Wales, Italy).
The USA which has often been cited as the worse affected country (often using the total number of COVID-19 deaths) has relative excess of 12.9%, which although one of the highest, is below some with even higher relative excess mortality such as Poland and Chile.
Talking of the USA, here’s an update on how the states are doing, comparing those which issued stay-at-home lockdown orders this winter with those that did not. No-lockdown states continue to have fewer Covid deaths per million than lockdown states, though the gap has narrowed a bit since February 1st, when lockdown states had 5.7% more deaths per million, to 4.2% on March 13th.
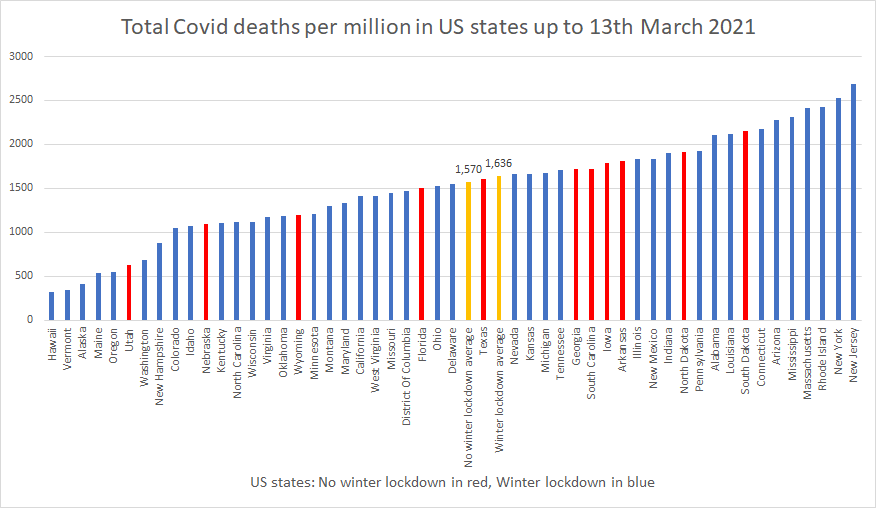
Lockdowns were sold to the public as a way of suppressing the virus that would otherwise kill many times more people than it would under lockdown conditions. The data from a year of lockdowns clearly contradicts the models which predicted such an outcome. With no-lockdown countries and states recording fewer Covid deaths per million than those which locked down, such models evidently massively over-estimated both the deadliness of the virus and the efficacy of lockdowns.
A clear-headed Government would now learn from this data and reject any advice based on such unreliable modelling and insist any models to be used for policymaking be calibrated against real-world controls such as Sweden and Florida. If models cannot accurately predict the death toll for places which do not implement interventions then they must be rejected. This is the bare minimum that must be asked of our scientific advisers and their mathematical models.
Lockdowns were first imposed by China and introduced into the West by Italy, having been peremptorily endorsed by the WHO, despite having no evidence to support their efficacy and being contrary to official guidance and pre-prepared pandemic plans.
As an increasing number of states in America reject lockdowns as a means of infection control, we need to do all we can to ensure the lockdowns of the last year become a blip in history and not a permanent feature of Western disease management.


To join in with the discussion please make a donation to The Daily Sceptic.
Profanity and abuse will be removed and may lead to a permanent ban.
“The Provision of Covid Marshalls”
Hertfordshire has put out a contract to supply 60 such Marshalls
Job description
1. Provide practical support to aid and
encourage compliance (= physical coercion).
a. This can be collated through an intelligence led approach (= spying and informants).
ii. Introduce measures to aid public and business awareness . . . (= barrage of hectoring propaganda).
a. Dissemination of the Covid19 guidance where additional local restrictions are in place (= enforce any local demands Hertfordshire might fancy).
b. Engagement or tailored communication to sectors or groups (= chop and change depending who you are picking on).
Does not add up to much of a job really but it’s clear none of this lockdown nonsense is going to change any time soon.
“The
livesviri of others.”A covid-stasi member in 2022 Britain questions his role.
From Dr Horst’s excellent analysis:
“the virus is now endemic anyway, that is to say it is constantly circulating – and mutating – in the population. This at least the mass testing has demonstrated for certain. Neither the isolation of clinically healthy people, nor any other government orders, can alter this fact.”
In other words, what the PCR tests do is to prove that lockdowns don’t work.
The Telegraph points out the “growing signs that COVID-19 restrictions will remain in place long after the summer solstice”
We knew that a year ago
Sad to say, but I think the real question now is how many years restrictions remain in place. And whether last Saturday was just the start, if they carry on with discriminatory and totalitarian restrictions beyond June 21st. After promising people that vaccines and drugs are the way out of this.
Incidentally, is there the slightest chance that sports fixtures from the autumn will see broadly similar attendances to before 2020?
I think masks, distancing, mass testing, capacity limits and travel restrictions, track and trace, vaccine bullying are all here to stay for a very long time.
Can’t grumble now? Do we have to wait until they bring back the DDR? Schon genugend – total Unsinn!
N ice? Nice?
Nice as C S Lewis’s NICE was nice in That Hideous Strength. The National Institute for Coordinated Experiment, staffed by evil subhumans, controlled by devils.
I going to dig that out for another read. Now you mention it, it has some distinct similarities to how we are all now!
I’m not so sure it’s what most people want, but they believe it’s necessary.
“growing signs that restrictions will remain in place long after the summer solstice” because COVID was the excuse, not the reason.
“We knew that a year ago”
We knew an awful lot a year ago that has been subsequently confirmed.
I remember vividly moving from wariness about the virus to astonishment last April as the reality became clear to anybody who cared to do basic research and look at the actual numbers.
Even my scepticism about Johnson and his government had not prepared me for the massive gap between truth and narrative.
What is the point of their lives!? what has happened to people??
Oh, Friedrich, welcome to my world! Lost many friends this last year, and many family members don’t want to know either. I could write a bloody book on this lunacy. I wouldn’t min, but they all virtue signal to the world, but break every bloody rule when it suits their purpose! I’ve just “cancelled my contracts” with them all, that is I’m steering clear of them and watching how this all plays out and getting on with my life as best as I can. Maybe I’ll be able to get back with some of them but the damage is already done. Just getting planning what I can for an unstable future, moving forward and accepting that life is changed forever now, unlike them, who think that “going back to normal” is around that…next corner, and “whats wrong with a vaccine passport/facemasks/testing etc?” “I feel safer for it!”
“Vaccinating adolescents could prevent UK third wave . . .”
This from the ‘Tony Blair Institute for Global Change’
(TBI, why not IGC ?).
On a bit of a sticky wicket there Tony, if healthy teens start keeling over after getting jabbed it would be quite difficult to blame that on a sudden onrush of Covid deaths.
The report is full of the usual ‘could’, ‘possibly’, ‘might’ caveats and is based on Expert Models yet again which presume a ‘third wave’ of covid.
“A further surge in hospitalisations and deaths is preventable if the *right policy changes* are made in time”.
He then lists his three (actually four) *right policy changes* none of which are even slightly radical or original.
“While no one (?) of these three (4) policy changes is sufficient to prevent a further large wave of infections, the combined package ACHIEVES THAT AIM (my caps).”
In other words if bozo does the three (4) little things that clever Tony suggests the ‘further large wave’ will have been prevented by implementing his very own *right policy changes*.
Why does anyone listen to this arrogant unqualified prick ?
The dudes a pimple on the backside of humanity.
A pimple? More like a cancerous sore!
An insight into what a poisonous character he is.
I was listening the other day to a moving documentary about the formation of an Iraqi youth orchestra.
The incidental descriptions of what those young people have had to face as a result of the Bush/Blair criminality was hard to listen to.
And he has the gall to pretend to wisdom on anything ….????
I thought it would look bad if the Queen or Prince Phillip died after taking that covid jab, but few seem to have noticed.
So “vaccines” aren’t actually the way out of this? Do these sort of idiots actually think there is any way out of this? “Oh yes, many years from now, when the whole world has been “vaccinated”, and get their variant “vaccines” every few months, after a long and painful struggle for the the greater good” – honestly, it’s like communism – and as wrong-headed!
Do you actually think the Queen or any World Leader had the real ‘vaccine’? I don’t, we’ve already seen fake injections caught on camera. Wouldn’t be hard to give a placebo.
Note yesterday’s comment/article about a bunch of people (somewhere in Europe) found to have been injected with just saline solution.
Why would a batch of securely manufactured Covid vaccine have been bottled with saline solution in the first place ?
Exactly. Only three possible answers. A simple manufacturing error. Only possible if saline in large quantities is used somewhere in the process. A White Knight sabotaging manufacture in order to save lives. Lastly, a supply for those ‘chosen’ not to receive the experimental gene therapy. Occam’s razor applies here. The latter is the simplest (if most horrific) explanation.
Many years ago I lived and worked in Bahrain. One day, an American colleague, who loved his pancakes in the morning, opened a new bottle of a (market leading) maple syrup. To his initial surprise (and subsequent joy), he found it contained bourbon. Needless to say a return to the supermarket found stocks removed from the shelves. Bahrain was and remains a relatively liberal country with respect to alcohol, but neighbouring Saudi Arabia is not. This was an example of a planned deception derailed by a simple shipping error. It seems likely that the ‘safe for VIPs’ doses simply ended up on the wrong pallette.
I’m going with “safe for VIPs” re the saline batch
This was my effort last year..
That reminds me, we had a poster last year for VE day – “No more stay at home cowardice – be brave like our heros”. Looks like we’ll still need it next year…
Tony Fucking Blair. By now, surely, any sane person, would steer well clear of anything this guy recommends. But he’s clearly doing his bit for… what exactly? It looks like injecting that stuff into kids is a top priority, perhaps to get them started early on the vaccination passport which then becomes their digital ID managed by Big Tech, Big Pharma and Big Finance. So expect more wards filled with kids with COVID-19, upsurges in Congo kindergartens, etc etc.
Ha! Just noticed the Guardian (always ready to get with the programme) didn’t dare put Blair’s name in it’s headline: Vaccinating adolescents could help prevent third wave of Covid in UK – study. The bad faith is revolting and revealing
Plenty of Guardian readers choking on their muesli this morning once they got into the article !
Yes – most Lefties hate Bliar even more than righties do!
Including this one.
Trotskyit Tony The Tyrant is never far from the worst elements of this murderous oppression.
Oh FFS – give over on the brainless typifications that suit ready-packaged received nonsense.
I told you before prick, don’t respond to my posts if all you have to offer is insults.
The COVID mutaween need to be treated with utter contempt.
What are mutaween?
The AIER article : ““Are Covid Fatalities Comparable with the 1918 Spanish Flu?” ” is fascinating.
Whilst it’s intent and thrust are absolutely correct, it disappears up its own fundamental orifice in trying to prove the patent absurdity of the proposition in terms of that nebulous concept of ‘excess deaths’.
Actually, showing one simple bar chart – of historical mortality – does the job. It immediately rubbishes the claim of Covid being ‘exceptional’ or ‘terrible’ in terms of mortality.
This seems to highlight a common failing of some making the rational case – over-anxiousness leading to confusing complexity.
It really is so simple : Covid has been in no way ‘exceptional’.
Sainsburys lose £261 million.
GOOD!!!!
Bullying people including your’s truly into “shopping alone” and instructing their “goons” to harass people who were shopping together, they deserve worse than losing a few million.
Wokeburys are the worst of the worse.
They went woke, and are going broke.
Wokeness is a sign the company doesn’t know or care about it’s customers.
I believe that Tesco’s are even worse.
Regarding India,
There were already cases of fabricated covid19 stories with images (dead people on the streets) from gas leak that happened in May 2020. being used to cover the story on “current covid-19 surge”. One misused/fabricated image/story by one media (think it was NYPost) doesn’t mean there’s nothing going one, but it does mean that atmosphere of hysteria is high enough for certain media to think they can so blatantly lie and swap images.
And we already seen this thing with “dead people on the streets”, “piled up bodies”, etc. with stories on China (with Chinese authorities also staging some of these fake scenes on purpose), Lombarida/Italy, New York, etc. last year.
The virus should have already passed in India (and much of the world btw) and became endemic. Take swine flu from 2009-10. It’s R0 is (was) ~1.5. According to CDC, it was detected in April, 2009. in US and passed by the end of November, 2009 “after the peak of illness during the second wave had come and gone in the United States“.
https://www.cdc.gov/flu/pandemic-resources/2009-h1n1-pandemic.html
So, the virus with R0~1.5 came and went in US in 9 months. The virus with R0~2.5 (c19) should have done that in shorter time. We have strong indications lockdown do not slow the spread (for sure not significantly), and indications that the virus was already around the world earlier than thought (few to several months).
US has 3x larger surface area than India and 4x less population, making India population density about 10 times higher. People in India don’t travel by plane a lot but travel by train (and foot) a lot. And even if you assume lockdowns do have some effect in the West, it would still be impossible to maintain them in India. In fact, lockdown measures might have resulted in more people mixing since good number of people had to return home from places where they were working. Virus with R0~2.5 should have come and gone in India by now. Also India, like other Asian-Indo-Oceania parts of the world, might have more pre-existing immunity to coronaviruses due to larger exposure to them.
It is more probable that the surge is an artifact of testing, politics, or that vaccines are casing it (as was seen in many other countries that started mass vaccinating).
When MSM media in the West keep sticking to some crazy concept, sometimes people have it easier to report stories and opinions in non-western media. That’s ok, but just to keep in mind that RussiaToday (RT) and Sputnik are Russian propaganda machines and are capable (and can get away) with way larger manipulation than Western ones (especially in Russia and places where Russia has strong influence). Russia is happy to report on stupid and wrong things which are happening in the West (like vaccine passports/passes, ignoring 300k people protesting in London by BBC, etc.) but that does not make Russian media objective (or more objective).
Not saying news from these outlets should not be shared, I’m just noting…
I’ve just been blanked by Faecebook for another 24 hours. My crime? Including in a post the words ‘Great Reset’. In the same post I quoted Gates on his speech detailing the need to ‘slow down’ population growth. I specifically made the point that at no time has he advocated culling 3 billion people. Finally I referenced a recent BBC article saying that Boris’s (I wanted to say Carries’s but didn’t) latest Green agenda will mean ‘less international travel, fewer cars, and less meat eating’. All of these were reported in the MSM.
It appears that Faecebook are now censoring people who put two and two together from publicly available information.
Yes – after all the bullshit about the developments in new modes of communication enhancing freedom, we see the big money interests in the field grouping with their natural allies – money and power.
Well – who’d have thought it?
The interviews noted in Round Up ““Sketch notes on a pandemic – Prof Carl Heneghan” are very interesting.
Most of us have great regard for Heneghan and the CEBM, but his treading warily is notable. Obviously, crucial his role is the need to be an advocate for evidence, but I was surprised at an initial tentativeness in promoting the need for more evidence ahead of the simple fact that if you don’t have prior indication of benefit, then you don’t use a medical intervention, pharmaceutical or non-pharmaceutical.
He was less cautious last year, when the CEBM was calling (June/July?) for an immediate end to lockdown.
Am I over-suspicious in seeing an induced greater caution?
I was even more surprised to hear him implicitly accepting the vaccine success narrative, and advocating studies on children in order to acquire an evidence base – even when he was pushed on the lack of a prima facie evidence base re. possible benefits for children.
Nor was there any attempt to rehearse the basics : that SARS-CoV-2 is not an exceptionally virulent virus – a piece of evidence from which all else flows.
A lot of his comments and insights are otherwise excellent – especially re. the resource implications and NHS priorities – but this drift towards the narrative that I see more generally does worry me.
As Mike Yeadon points out, not everyone is in the same position as himself. Many experts are dependent on grants for their research, and indeed upon higher authorities for their very job. Most of these grants come from a limited number of sources. If you rock the boat you may place both job and grant at risk. The choices are stay quiet, take the risks, or, sadly the middle road. This entails being a high profile ‘sceptic’ within parameters laid down by your handlers. In this way they hope to create the illusion of open discussion whilst in reality controlling both sides of the argument. It would appear that Tim Spector of ZOE falls into that category. Maybe Carl Heneghan has made the same choice.
I think that you are absolutely right. My questions were largely rhetorical – the pressure on academics to go easy is immense – as, in fact, Heneghan has himself noted.
I also appreciate that his role in heading up the notion of ‘evidence based medicine’ puts him in a difficult position in terms of making assertions either way.
But it is worrying how creeping, unwilling assent to a false narrative grows. The liars end up getting their way.