There follows a guest post from our in-house doctor, formerly a senior medic in the NHS, who draws attention to the errors made repeatedly by the modellers and government advisors and the huge implications of them.
Napoleon Bonaparte remarked that “history is the version of past events that people have decided to agree on”. When the official version of the pandemic is written, I wonder what analysis will be made of the role of statistical modellers and public health experts in driving Government policy over the last 18 months?
To inform this question it may be helpful to examine the recent evidence of how predictions have matched up to real events. For example, on September 8th, SPI-M-O (one of the multitudinous acronym salad bodies advising the Government), produced a paper entitled “Medium-term projections“.
Perhaps mindful of the woeful inaccuracy of previous predictions, the very first sentence heavily caveats the entire document:
These projections are not forecasts or predictions. They represent a scenario in which the trajectory of the epidemic continues to follow the trends that were seen in the data up to September 6th.
If that is the level of confidence the authors of the report have in their own abilities, one rather wonders what value this publication contains – yet this is the level of advice being given to decision-makers.
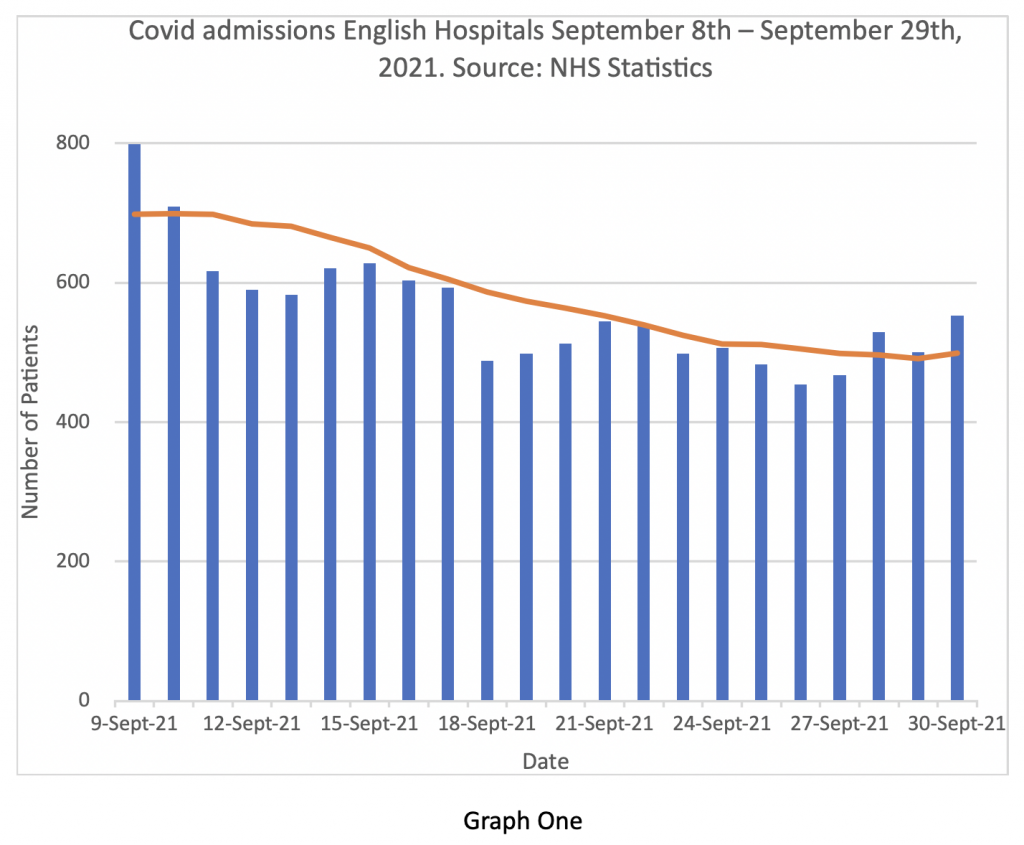
Firstly, to the “projection” of admissions. The document is in PDF format, so I am unable to reproduce it here, but the graphical representations show a 90% confidence interval fan chart for the period September 12th-28th. Hospital admissions in England are “projected” to be between 600 to 1,200 per day – a fairly wide spread. Graph One shows what actually happened – daily admissions on the blue bars, seven-day moving averages on the brown line.

It is clear that admissions have been consistently below the lower ‘projection’ for the entire period and the seven-day moving average at the end of the month was below 500 admissions per day.
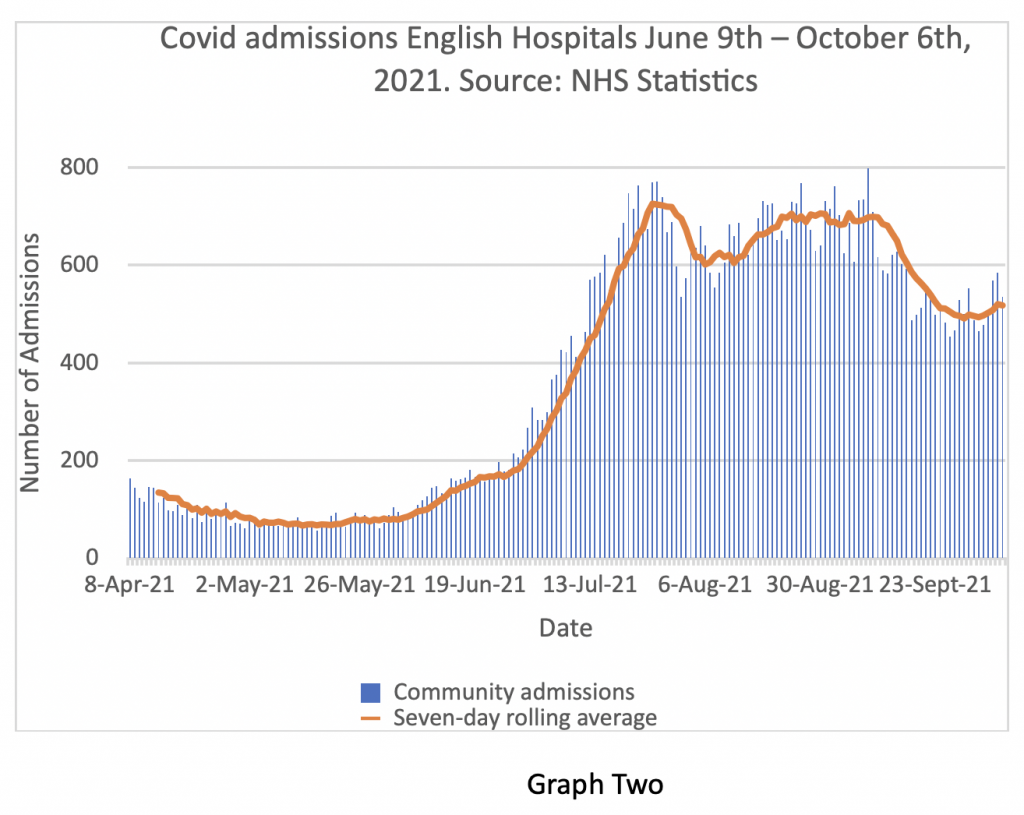
For context, it is helpful to present that period of September alongside the data from earlier and later in the year in Graph Two.

So, having projected that hospital admissions would continue to rise, the real-world data shows that they in fact fell quite significantly over the period in question.
Earlier in the year, the influential modelling group at Imperial College produced a ‘projection’ for SAGE looking at the effects of lifting Covid restrictions on July 19th.
In this paper, they estimated that hospital admissions by mid-September would be between 2,500 per day (optimistic case) and 12,000 per day (pessimistic case). The real data shows the average figure to be around 700 admissions per day.
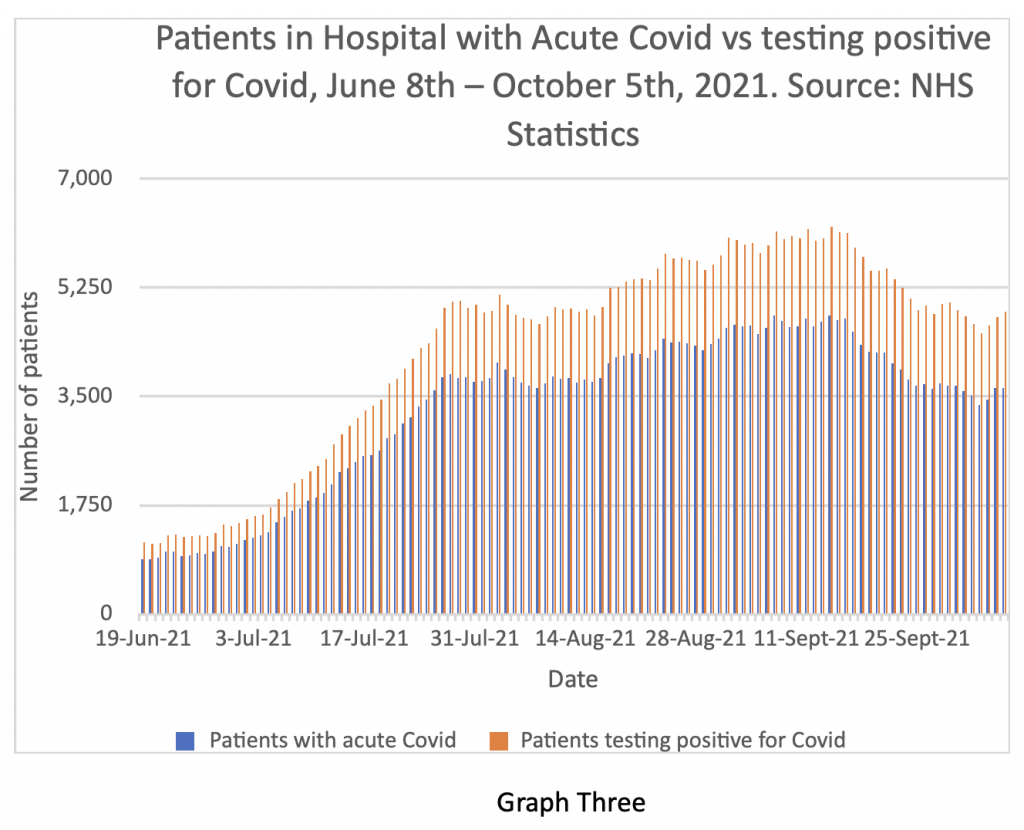
Total patients in hospital testing positive for Covid have also continued to fall, as have patients being treated for acute Covid over the period – Graph Three shows that as of October 5th there were 3,630 patients being treated for acute Covid in English hospitals with a further 1,231 patients testing positive for Covid but being treated primarily for another condition.

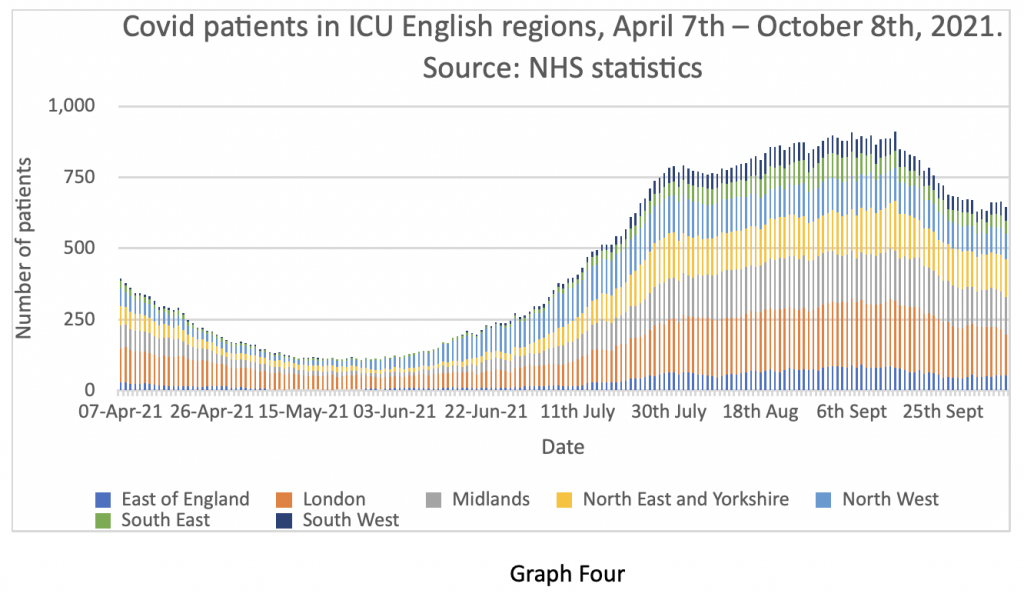
In line with these trends, the ICU Covid bed occupancy has also fallen – depicted in Graph Four.

On July 7th, SPI-M-O produced a report containing data from three modelling groups (Imperial, Warwick and LSTMH) in relation to ‘projections’ after lifting of Covid restrictions on July 19th.
The data is quite dense, but in summary, their most optimistic projections around admissions, hospital inpatient and ICU load and deaths were overestimates by at least a factor of two. Worst-case predictions were overestimates by up to 10 fold. Positive tests in the community were predicted to be over 100,000 per day by the end of September – the reality was around 35,000 and the ratio of hospital admissions to cases has been falling steadily from around 8% at the beginning of the year to around 2% now.
The point of my article today is not to poke fun at data modellers, most of whom are probably trying their best to be helpful. My intention is to observe that almost all ‘projections’ I have seen over the last year have shown a remarkable consistency in grossly overestimating the numbers of Covid hospital admissions – yet the modellers and governmental advisors do not appear to have adjusted their calculations in light of observable real events and keep making the same errors. This constant catastrophising has real-world implications – not just for civil liberties, but for cancer diagnosis, chronic disease management and not least the state of the economy, which pays for the Health Service.
We have a long tradition of politicising healthcare in this country, with a corresponding corrosive effect on sensible decision making. The Covid pandemic has taken the tendency a step further by politicising a specific individual pathogen. I fear we are about to compound the error by extending the precedent to all seasonal respiratory infections. Having crossed the Rubicon of national lockdowns, there now seems to be an appetite among senior Government advisors for repeating the mistake. Professor Ferguson, giving evidence last week to the Parliamentary Select Committee on Covid, referred to ‘Plan B’ – in relation to re-imposition of societal restrictions should Covid hospital admissions exceed a threshold of 1,200 per day. Professor Van Tam has warned the public about the possibility of a serious influenza outbreak this winter and attendant pressure on the NHS. Is this evidence of prudent governmental contingency planning or ‘pitch rolling’ for re-introduction of ‘non-pharmaceutical interventions’?
I close this piece with an observation from another significant historical figure – Winston Churchill – a journalist and author before he became Prime Minister. Churchill remarked that “history will be kind to me – for I intend to write it myself”.
It is known that our current Prime Minister is an admirer of Churchill. I wonder how that enquiry will turn out?


To join in with the discussion please make a donation to The Daily Sceptic.
Profanity and abuse will be removed and may lead to a permanent ban.
I have a NPI for them, expand hospital capacity, hire more nurses, train more Drs, reduce waste and scrap a tier of middle management.
How will they afford this? Oh I don’t know, maybe they could offset the cost against an open economy?
Anything that can be done can be afforded because, as the last eighteen months as shown, there isn’t actually any restriction on the amount of money.
You always pay for it by spending the money. Money is made round to go around.
It’s finding people with the vision and drive to do the transformation that difficult.
Models overestimate…just as (certainly, until recently) climate models have consistently predicted higher temperatures than we actually experience.
The Quote from Napoleon could almost be “models are the version of future events that everyone has agreed on”.
In terms of both climate change and Covid there does seem to be a lot of agreement between different models, indeed new models are tested against existing ones to judge their accuracy. In both cases (climate change and Covid) I’m not aware of any models that say it isn’t going to be that bad, it’s “only” real world evidence that points to that conclusion. This has been proven with Covid (e.g. in Sweden, Florida etc.) and is likely with climate change (e.g. long term data shows no increase, so far, in extreme weather such as hurricanes, droughts etc. despite what the models predict)
And let’s not forget all the wacky models that led to the financial meltdowns in 2008
That was caused, in 1997, by Gordon Brown taking banking regulation from the Bank of England and splitting it between 1) the Treasury, 2) the Bank of England, and 3) the Financial Services Authority. None of them knew exactly what they were supposed to do, nor were they informed of what the others were supposed to do. Thus banks became unregulated and 2008 happened.
American banks realised that lax or non-regulation banking in Britain would allow them to circumvent the Glass-Seagall Act it they shifted their centre forward to operations to London. So many did that Clinton repealed the G-S Act on his last day in office in 2000, leading to the American banking disaster.
Jeepers! How does one edit entries here?
I meant ‘centre of operations’.
The article is interesting but based on the same flawed premise of many DS articles, namely that the mess is due to error of judgement. In this case, bad models, misplaced trust.in modelling.
There is no mistake here. This is all planned and instigated and the outrageous modelling is one of the tools used by the perpetrators.
…….the same flawed premise of many DS articles, namely that the mess is due to error of judgement.
That is official flawed DS/LS policy, but we have to live with it.
Neil Ferguson has openly stated he is happy to be wrong in the right direction. The only questions are why such people are setting out to be wrong, and what purposes setting out in such a direction serves.
There’s no downside for someone like Ferguson overestimating.
If things aren’t as bad as he predicted then his recommended interventions stopped things from being worse.
However, if things were to be worse than he predicted then he could take the political blame.
Professionally, he’s much better off erring towards an overestimation every time.
I don’t think the failure to mention it is a mistake or a flawed premise at all.
I think it’s cowardice.
Clip:
https://www.youtube.com/watch?v=WgarNtY7gz0&t=88s
Full interview
https://www.youtube.com/watch?v=0Kn6AFl5G1c
Thank you for those links. Breath of fresh air much needed. More Krystle’s needed everywhere. I’m sure they’re out there but need this kind of encouragment.
Wow! Thank you for the links.
Krystle has bigger balls than all the politicians put together.
Great display of sacrifice, honesty, integrity and common sense.
Respect Krystle!
Error? Barely credible.
Imperial College’s infectious disease modelling bears about as much semblance to reality as Mario-Kart.
In 2002 they predicted 50,000 people in the UK would die of “mad cow disease” and less than 200 did; shortly after forming the MRC in 2007, they predicted up to 200 million deaths from H5N1 bird flu, this has resulted in an estimated 455 deaths globally and a year later they “modelled” 65,000 UK swine flu deaths. Less than 460 died.
It’s Pantsdown. The horrid little squit knows very well that the direst predictions get you the most kudos. the fact that they are always grotesquely wrong has no importance whatsoever for the disgusting little squit or the cretins that believe him.
He just says what his paymasters want him to – and manages to do it with a straight face, even though it’s clear he doesn’t believe his own bullshit.
“…not to poke fun at data modellers, most of whom are probably trying their best to be helpful …”
You could say the same about the village idiot.
Yes. Just look at Neil Ferguson. Professor Never F’inright yet he still churns out alarmist rubbish, time and time again…He’s a grotesque fantasist.
And still in the job! I want a job like that.
He’s performing very well against the funders benchmarks: to create chaos almost to order.
“and not least the state of the economy, which pays for the Health Service.”
We’re not going to get anywhere until people realise that is backwards. The Health Service pays for the economy, and by doing so itself.
The NHS is vast and huge amounts of business activity and investment is induced to serve it by the NHS’s spending. And that all helps keep people employed, as well as driving forward innovation and investment as many, many people work to improve the effectiveness of healthcare.
And that is what all those people would be doing anyway if the NHS didn’t exist, because there is no better alternative use for those people. We don’t need them to farm sheep because our farming technology is so efficient we can farm sheep with very few people engaged in the operation.
The NHS is the economy and the economy is the NHS – because a health care system is a vital component of maintaining the population production ready.
They are part of the same thing, not separate entities.
Funding for anything comes from the effort of the people engaged in the activity. Money is just a metaphor for ‘real funding’ that pops in and out of existence to ensure the ‘real funding’ happens. There isn’t a fixed amount of money. There is a fixed amount of ‘real funding’.
You can only get more effective and efficient activity by reducing the amount of ‘real funding’ engaged in an activity without reducing the output of that activity. And that requires investment in improved productive methods and techniques.
In a sense, NHS workers are sheep-farmers. How about, rather than this downward Keynesian spiral into ever-greater hospitalisation and drug-dependency, some of these people get employed researching health? How about, if they disagree over any of the results, all the evidence can be presented to the flock for them to make up their own minds. Like, rather than being sheep, they might be people capable of thinking for themselves. Like they might find taking control of their own health fulfilling. Sorry, just indulging in some crazy idealism for a moment.
Dr. Johnson, the a Great Cham, said that a man was either a fool or his own doctor at forty.
The modellers are not making mistakes. They know exactly what they are doing….spreading fear and anxiety.
Isn’t it a shame early treatment with effective repurposed drugs is not used. Lives could have been saved. Don’t you wonder why the health authorities would not even try these repurposed drugs?
Because Invermectin and Hydroxychloride cost pennies, and don’t make politicians’ friends billionaires.
You can’t drive people into a trap which you maintain control of if you make them fit & well, while asking nothing of them.
What relevance do those patients testing positive for covid, without having acute covid, have here? Did they even have covid, or just some trace of SARs-CoV-2, the virus that can cause covid? Why, if you are in hospital with a broken leg, would you care if you have a virus your immune system is capable of dealing with?
You wouldn’t of course, but it’s a potential opportunity for those that do, to add another one to the clearly fake and misused “statistics”, to attempt to justify to the mostly gullible public, what “measures” they want to impose next.
I imagine they will be reluctant to give that up any time soon somehow.
FWIW the modellers/Sage/BBC etc etc are very useful idiots.
Those really in charge know exactly what they do and why. Fear.
This was never and never will be about a deadly virus.
It’s all about digital control – and it has barely begun.
But I am only stating the blindingly obvious – at least to the majority here.
What the hell will it take for sheep to wake up.
The basic question is always ignored – If this is a devastating global pandemic, where are the half a million bodies littering the streets that the ‘experts’ shouted would happen if we didn’t do exactly as they told us to do?
its a scamdemic put up by a government intent on controlling us.
projections, graphs, figures, warnings – they are all a blind to confuse and control. Just ask ‘Where are the bodies?’
Oh come on, cut them some slack, they really have tried their best.
They stopped doctors giving any early treatment, or any treatment advice, they stopped any news of effective prophylaxis getting into the public domain, they threatened anyone with medical experience from discussing the disease with the public, they jerrymandered trials of effective antivirals to show no benefits while actually killing trial participants, they permitted use of an expensive drug that according to the WHO has no benefit and that trial show can injure and kill patients, they persisted with practices that ensured high levels of nosocomial covid in hospitals and care homes – even deliberately spreading the virus into care homes – they told sick symptomatic people to take a paracetamol and only try to get admitted to hospital if their lips turned blue.
What else did you expect them to do!!!!!?
Well I think their provision of grant cash to local authorities to add more (ludicrously large) cycle paths in many areas recently, was to give an opportunity to suitably hired “bellends on bikes” to noble a few more pedestrians at speed, is another they have.
Bozo is keen to demonstrate how it’s best done apparently…
Ferguson is the grit in the oyster. He’s utterly unqualified to do what he does. But he’s very valuable to his institution despite being worse than a monkey with a dart board because of the loot he brings in.
The funders know what they’ll get so find the costs tiny compared with the benefits to them.
He could be defenestrated but it would take lots of people to act against their own short term interests. So it won’t happen.
His name being mentioned back in March 2020, and his modelled predictions, was not just a Red Flag but a whole line of them……why can’t our parliamentarians see the connection? Why would the government use such tainted goods…..except they have had a tainted agenda from the outset. The scene was set in Jan 2020 with the hazmat suited medics wheeling a patient on a trolley in a York hospital.
My slightly crude preferred alternative…
“Ferguson is the shit in the oyster. He’s utterly unqualified to do anything useful.”
So ‘covid’ is going to be known as ‘flu’. Since last September ‘flu’ has been known as ‘covid’. How convenient.
Perhaps they should choose “fluke” – that’ll cover it all…