
Covid deaths continue to fall in England and Wales – to such an extent that the number of daily deaths from Covid for the past month has been lower than the five-year average of deaths from influenza and pneumonia. The Telegraph has the story.
For the past month daily Covid deaths in England and Wales have been lower than the typical number of people dying from the flu, data shows.
Since late March there have been fewer Covid deaths each day than the five-year average of deaths from influenza and pneumonia, which normally stood at 86 during the months of March and April, according to preliminary figures published by the ONS.
As of the week ending April 16th, there have been on average 29 daily deaths where Covid was mentioned on the victim’s death certificate, as opposed to an average of 80 involving influenza and pneumonia at the same point in the years between 2015 and 2019.
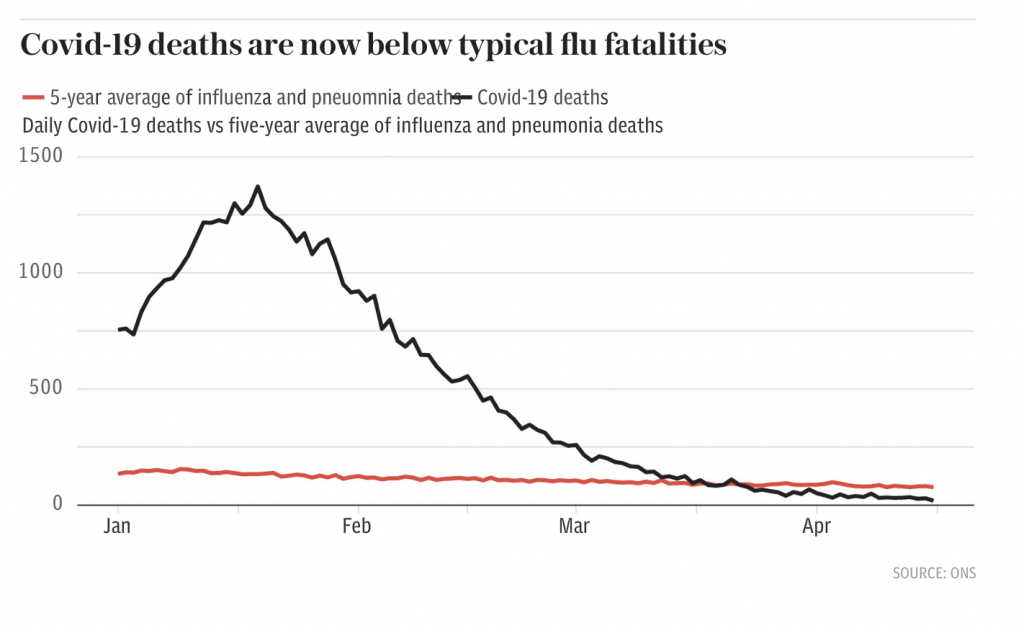
While Covid deaths are now lower, the data also shows how they massively surpassed typical flu deaths during the worst days of the second wave, and continued to remain significantly higher over a month into England’s third national lockdown.
On January 19th there were 1,372 deaths mentioning Covid on the death certificate, a tenfold increase on the average number of flu deaths at that time of year of 133.
Even a month later by February 19th Covid daily deaths stood at 407, four times higher than the five-year average of influenza and pneumonia deaths of 107 at the same time of year.
The ONS data also reveals the extent to which the spread of Covid has now been brought to heel, with the country’s top epidemiologists claiming the coronavirus has moved to manageable “endemic” levels.
Not only that – even SAGE modellers have admitted that a “third Covid wave” probably won’t happen, as Toby reported here.
The Telegraph’s report is worth reading in full.


To join in with the discussion please make a donation to The Daily Sceptic.
Profanity and abuse will be removed and may lead to a permanent ban.
Maybe if they hadn’t emptied all the old and sick out of the hospitals last March, we would have been in a better place.
“the number of daily deaths from Covid”
This has never been a reliable figure – even when it’s ‘good’ news.
So reading between the lines, we had hardly ANY deaths of ANY respiratory disease last month.
Because any deaths like pneumonia, flu or other respiratory infection would have been put down to covid. Considering how cold it has been, that is really rather good.
Bad news for gardeners, a record (?) number of frosts in April. Because of global warming, or something.
They won’t scream Covvideath if the corpse has been Vaxxinated..
But, we’re now rather low on “dry tinder”, thanks to the number of elderly people dispatched about a year ago – at least in part because of the clearing out of our hospitals, including the sending of (nosocomially) infected people back into their care homes.
Someone please tell me why a packed stadium of 3,000 (March 14th 2021) is so dangerous today?
The 5 year average looks incredibly low to me. Is anybody else having this feeling?
Well, it would certainly have been interesting to see what the flu/pneumonia deaths would have looked like if deaths had been taken as ‘died within 28 days of a positive test for said infections’!
And yet Boris, egged on by Gove, is still forcing old people to stand in the cold and rain outside shops in queues – I saw it myself yesterday. Isolated old people shivering outside to meet their friends in gardens. Hundreds of thousands have to march so that imprisonment stops for those fragile people in nursing homes, so many of whom his policies have killed,
What a cruel man he is. What a liar. What a self seeker.
The shops still festooned with demands for hand cleansing, yet the Government has known since May last year that Sars2 does not spread by touch. Still full of arrows and threatening signs which discriminate against the disabled.
A curse on both their houses, him and Starmer.
Was it a poster or a t shirt that I saw
MAKE INFLUENZA GREAT AGAIN
When is “the five year average” going to be updated? It is remarkable that comparing 2020 figures to anything other than the 2015-19 average was heresy, but here we are in 2021 and the 2016-20 average is never used.