We’re publishing an update this morning from the Daily Sceptic’s in-house doctor in which he analyses the latest NHS hospital data. Conclusion: no need to panic.
I have been a bit quiet lately, partly due to being on holiday and partly due to waiting a while to examine what trends are emerging from the hospital admissions data over the later summer.
On looking at the latest figures and associated media commentary I have been reminded of an old Russian aphorism from the Soviet era: “The future is certain, but the past keeps changing.”
For example, on February 3rd, 2020, Boris Johnson, warned of the danger that “new diseases such as coronavirus will trigger a panic”, leading to measures that “go beyond what is medically rational, to the point of doing real and unnecessary economic damage”.
I didn’t catch any reference to that (very reasonable) remark this week when the Prime Minister imposed further taxation on the working-age population and the companies that employ them. Before returning to the airbrushing of recent history, I will consider the hospital level data over the last month to discern trends and discuss what reasonable inferences we can draw from the numbers. I confess that some of the information doesn’t quite make sense to me – I will elaborate on this point later.
The first and most glaringly obvious fact is that the catastrophic tsunami of hospitalisations confidently predicted by all the experts who have assumed the governance of the U.K. has failed to arrive. How annoying that must be for Richard Horton, Editor in Chief of the Lancet, who described the relaxing of restrictions in July as “driven by libertarian ideology” rather than the data. Or Trish Greenhalgh, Professor of Primary Care Health Sciences at Oxford University, who said that “the Government policy seems designed to increase cases” and predicted there will be hundreds of ‘superspreader’ events in the coming weeks. The Lancet published a letter signed by 122 self-identifying experts which suggested that the Government was conducting a “dangerous and unethical experiment” in removing societal restrictions on July 19th.
Just to push the point home, readers may wish to consider Graph One. This shows the seven-day average of positive Covid tests on largely asymptomatic people against total patients testing positive for Covid in hospital. It can clearly be seen that the community tests peaked on July 23rd, rapidly falling off thereafter. Hospital numbers barely changed in response to changes in community test rates – so where is the epidemiological stupidity?
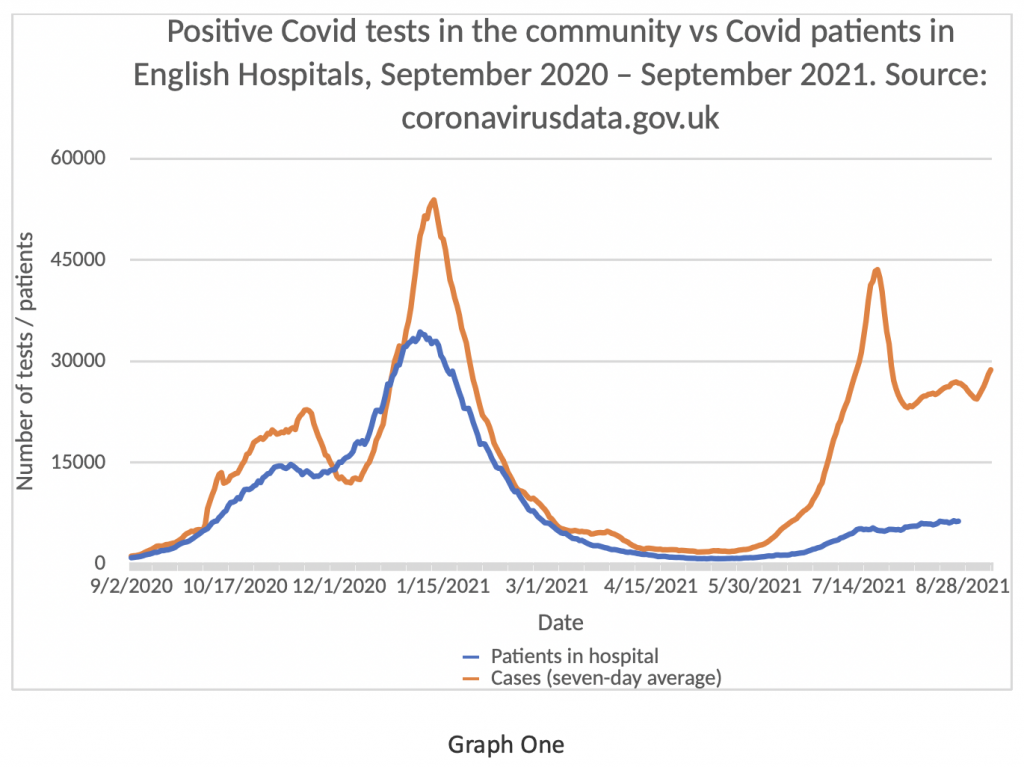
The latest updates on community testing from Public Health England (PHE) suggests that the current incidence of positive tests has been stable or decreased from week 28 (w/e July 22nd) to week 35 (w/e September 9th). I may have missed it, but I have not so far noticed a retraction letter in the Lancet from the expert commentariat.
Graph Two shows the number of patients testing positive for Covid admitted daily to English NHS Hospitals on the blue bars, with the seven-day rolling average on the brown line. It seems clear that there has been virtually no change in this graph since July 19th – the upslope trend levelled off and has remained flat ever since. Perhaps one of our epidemiological intellectuals could explain to me, a humble clinician, why it was ‘stupid’ to at least attempt to get our economy back to some sort of normality?
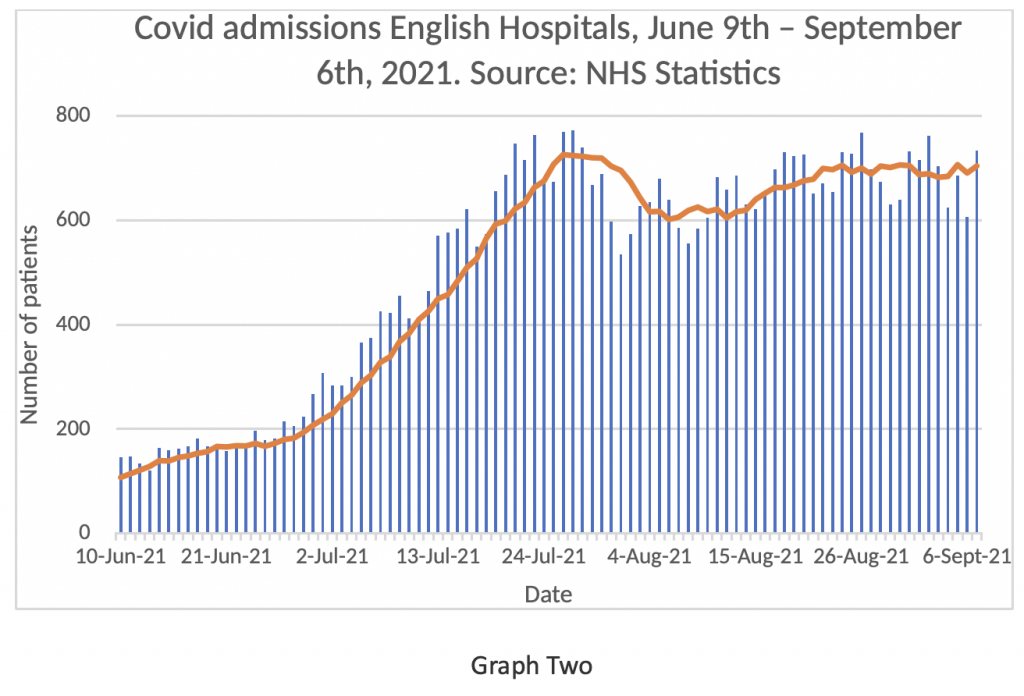
I noticed something else slightly odd about this graph. I have highlighted the Mondays (or Tuesday August 31st in the case of the bank holiday) in red. It seems to me that there is a ‘weekend trend’ emerging in relation to Covid admissions from the community. How can that be? Acutely ill admissions with respiratory infections do not usually predominate during the working week and fall off at the weekend. One possible explanation is that on Mondays the numbers could be boosted by patients being admitted for routine matters who just happen to test positive for Covid, rather than being acutely ill. There may be other explanations for the weekly pattern of variance which are not immediately obvious to me. Graphs Three and Four might shed light on this point.
Graph Three shows the number of patients in hospital testing positive for Covid over the last few months. There has been a small increase in numbers over the last six weeks, but not by any means a massive rise. Given that there are approximately 120,000 beds in the English NHS, this represents a Covid positive bed occupancy of around 5%.
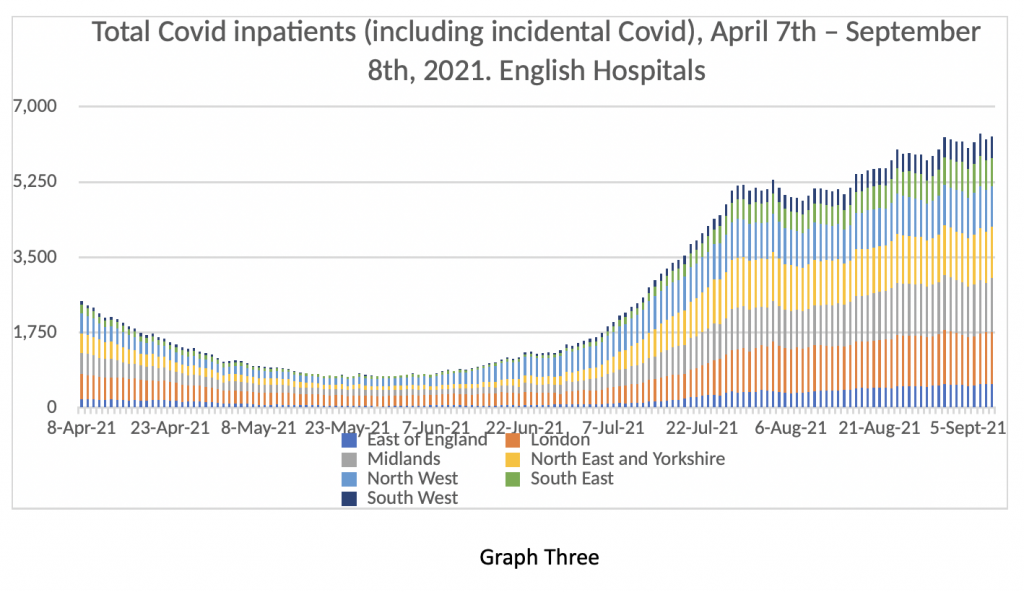
And yet, Graph Three is not all that it seems. Readers may recall the Department of Health was forced in July to release the ‘Primary Diagnosis Supplement’ – an extra spreadsheet detailing patients in hospital testing positive for Covid but not suffering from acute Covid – in other words where a positive Covid test may be an incidental finding. Graph Four shows that the NHS is still overstating the numbers in hospital with acute Covid by about 25%.
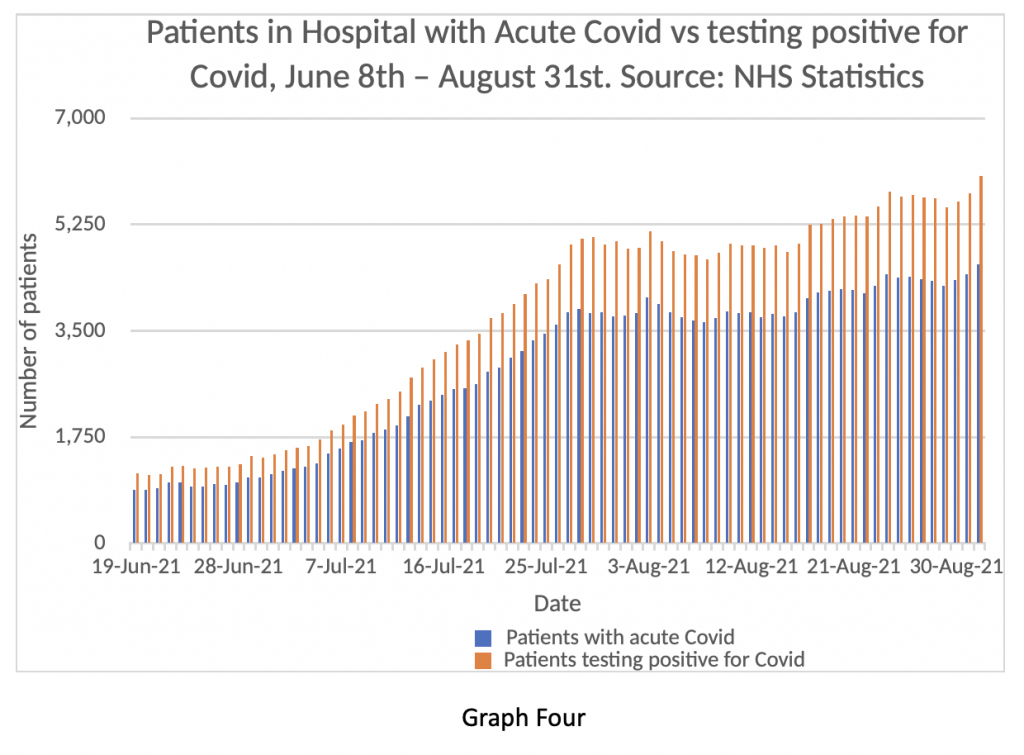
I naively expected when the authorities were forced by political pressure to finally release this information that NHS spokespeople would then revert to expressing the daily numbers differently and report only the numbers of patients in hospital with acute Covid. But clearly not. So, when the NHS say there are about 6,000 patients in hospital who have tested positive for Covid, by their own published numbers one can see that just over 4,000 of these are actually suffering from Covid symptoms – a bed occupancy of 3.3%.
To explore this point further, Public Health England have just released an influenza and COVID surveillance update. To summarise the information in this very detailed document, the rates of both hospitalisation and death from COVID per 100,000 population are much higher in unvaccinated people compared to fully vaccinated. Transmission of the virus seems similar in both groups for ages over 40, but transmission that does not lead to hospitalisation is of dubious clinical relevance. Unfortunately, the report provides figures as ratios, rather than providing raw numbers, which makes detailed analysis difficult. Further there is no breakdown in the document in relation to severity of hospitalised cases. My anecdotal information (which I can’t reliably corroborate) is that the majority of severe cases in ICU are unvaccinated or markedly obese and that severely ill vaccinated patients almost always have very significant co-morbidities.
This data really matters because it is now clear that there is a defined ‘at risk’ segment of the population susceptible to severe infection, and that for the vast majority of British citizens the virus really does pose minimal threat. That being the case, there can be no justification for any further restrictions on civil liberties with the attendant economic damage so clearly articulated by the Prime Minister in February 2020.
Graph Five shows daily Covid discharges on the blue bars displayed against Covid admissions and positive tests in hospital on the orange bars. Again, these numbers don’t really make sense to me – if there was this degree of disparity between admissions and discharges, one would expect the numbers of inpatients to accelerate at a much faster pace. There may be some double counting going on, or the definition of an ‘admission’ may also encompass patients seen in A and E and sent home without spending any time in hospital. Release of length of stay data could help resolve these discrepancies – such data does exist, but we are not permitted to see it. Readers may draw their own conclusions.
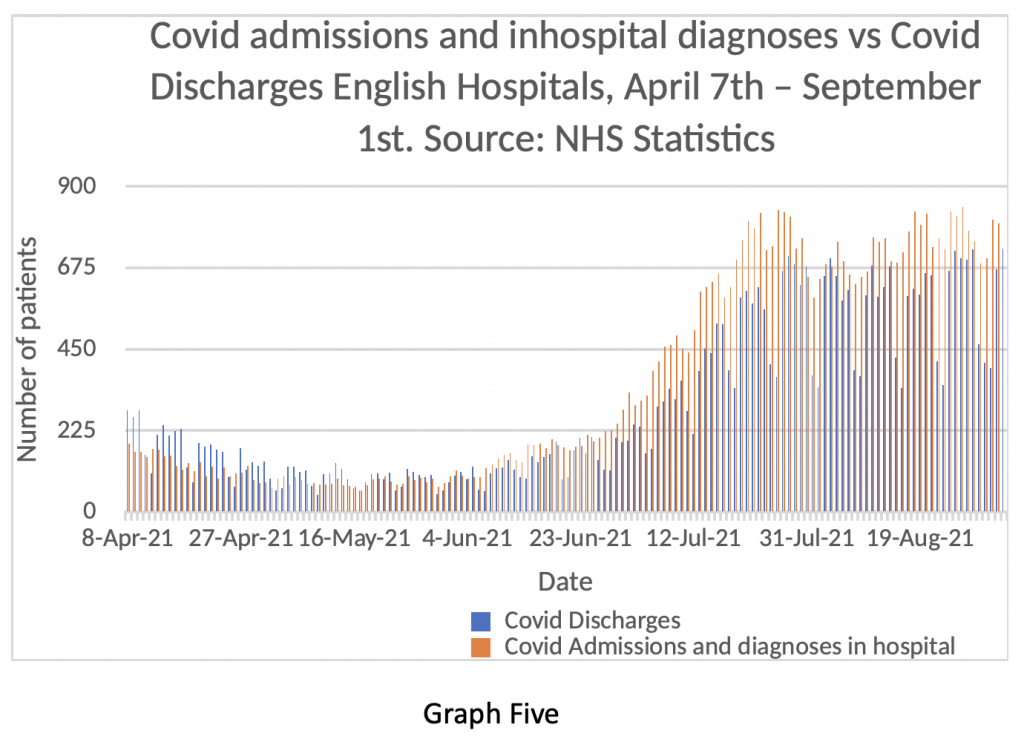
Once again, the ‘weekend effect’ can be clearly seen in the blue bar discharge data. Despite all the hype around seven-day working, the NHS doesn’t really function at the weekend. Maybe the extra £20 billion of taxpayers money might change that. Or maybe not.
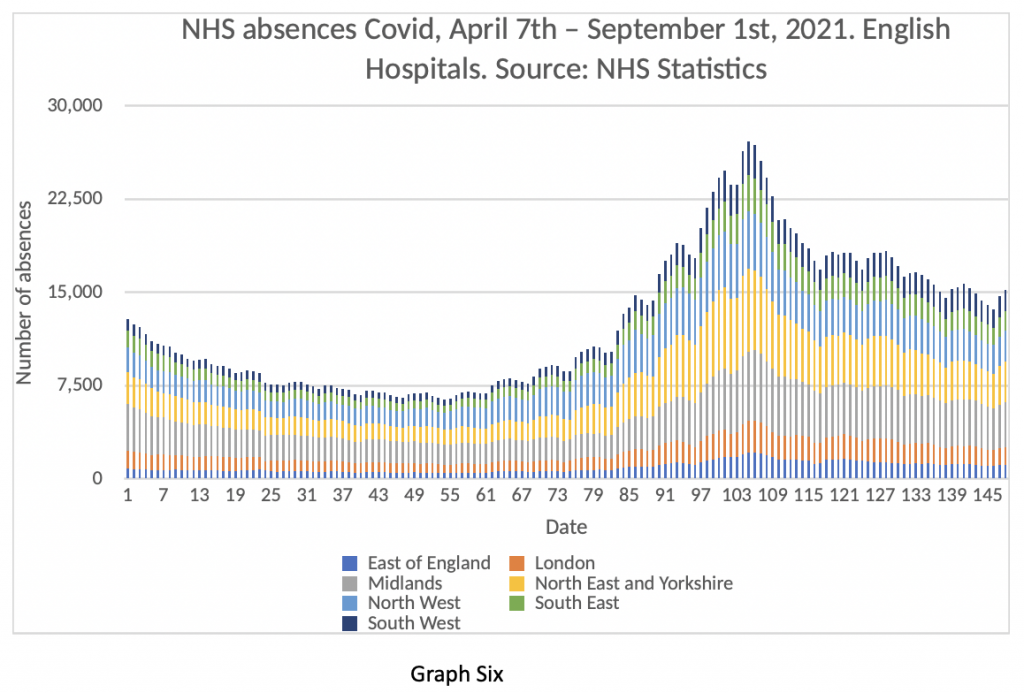
Finally in this update, readers may wish to assess Graph Six – the number of daily Covid staff absences in the NHS – still running at about 15,000 per day. The total number of staff off work every day for reasons of ill health is about 73,000.
So, what can we make of all this information? Well to be frank, it’s really quite boring. I could have written many more pages with charts of ICU patients and deaths and comparisons of real-world data vs. various confidently stated predictions from experts. They all show the same thing – no significant change in hospitalisations or deaths, or severity of disease for at least the last six weeks, despite the predictions of doom.
Does this mean the ‘pandemic’ is over? Again, to be candid, I simply don’t know. Further, I don’t think anyone knows. I have seen some well-argued pieces lately, particularly by Andrew Lillico in the Telegraph, analysing the herd immunity threshold in relation to the RO of the virus – his conclusion is that it is highly unlikely we will see a resurgent wave this autumn and winter. I sincerely hope he is right – time will tell.
In autumn 2020 we also had a gradual rise in cases which flattened out in late autumn before the Alpha variant took everyone by surprise in mid-December and kicked off the winter surge. Could this happen again in 2021? The difference this year is that we know vaccines have a significant effect on preventing hospitalisations. According to the Office for National Statistics, approximately 93% of adults in England have Covid antibodies either by natural infection or induced by vaccines.
There are two plausible ways in which Covid could make a resurgence in the same way as April 2020 or January 2021. The first is a novel variant which escapes vaccine induced immunity. The second is early waning of immunity induced by vaccination or natural infection. In the latter case, this should be detectable early and remediable by booster vaccines if needed. I note that Dame Sarah Gilbert recently commented that vaccine induced immunity seems to be holding up well and that, in her opinion, booster vaccinations should not be necessary for the majority of people.
It seems to me that we are now in the consolidation phase of the Covid episode, characterised by various professional groups striving to consolidate their gains over the last 18 months. Lest readers think I have adopted pretensions as a preternaturally gifted savant, I conclude this based on the behaviour of homosapiens over centuries. Humans have tended to pursue power, money and influence throughout the course of documented history and to exploit moments of crisis to accrue more of these things – I can’t see why this would change now. In detail I note that:
- The Government are demanding extension of emergency Covid powers to the middle of 2022 ‘just in case’. In other words, we continue to be governed by ministerial fiat, without parliamentary scrutiny on the pretext that we are in an emergency – the data does not support that argument.
- The NHS high command seems to have achieved almost complete ‘state capture’ and judging by this week’s announcement on raising NI contributions they now appear to be running the Treasury as well as virtually every other Government department. Spending on health and social care is expected to account for 40% of Government expenditure by 2025 and seems set to rise further – as the MP Marcus Fysh observed, the U.K. now appears to be a Health Service with a country attached to it.
- The various testing companies and associated paid advisors (some within parliament such as the former minister Owen Patterson who is paid £8,333 per month by Randox) will attempt to extend their activities into other infectious pathogens such as influenza, particularly if we have a significant flu outbreak this winter. The genetic sequencing firm Oxford Nanopore, a conspicuous beneficiary from the pandemic, has announced its intention to float on the London Stock Exchange, prominently advertising the potential profits still to be made from testing services in this and possible future pandemic threats.
- The unions, especially the teaching unions, are doing their best to prevent their members from actually doing any teaching on the grounds that interfacing with children is too dangerous for their members.
Most importantly from the consolidation perspective, the fear among the public must be maintained. Fearful people are more compliant and less likely to push back against arbitrary rule. The prospect of an imminent catastrophe must constantly be front and centre to ensure maximum benefit for the full spectrum of vested interests. Models will continually be adjusted to reflect the possibility of danger ahead – the woeful track record of predictions to date will be tactfully ignored by the mainstream press, to keep the confected risks in the public mind – danger and worry sells more papers than calm reassurance and sober assessment of the numbers.
The 19th century German philosopher Frederick Nietzsche commented in one of his essays that circumstances can arise where “the dead bury the living”. He meant that a false interpretation of history creates a situation where the living are too fearful to live fully, preferring instead to cower away, just in case calamity strikes. In this case, people are willing and indeed grateful to cede liberty and authority to centralised government in return for the illusion of safety.
The future is certain.


To join in with the discussion please make a donation to The Daily Sceptic.
Profanity and abuse will be removed and may lead to a permanent ban.