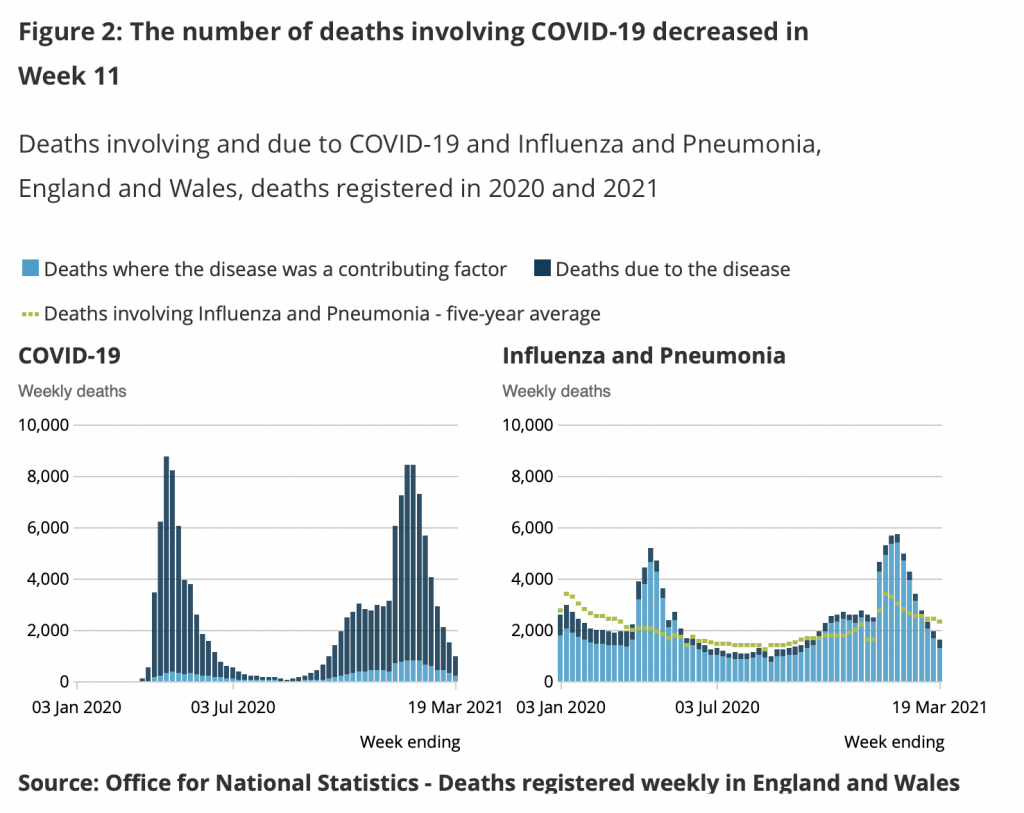
Covid was involved in fewer than 10% of all deaths in England and Wales by mid-March, according to the latest figures from the ONS. New data also shows that the number of excess deaths has fallen below zero for the second week in a row. Here are the key findings from the ONS.
The number of death registrations in England and Wales involving the coronavirus decreased from 1,501 in Week 10 to 963 in Week 11 – a 35.8% decrease. Of all deaths registered in Week 11, 9.3% mentioned Covid on the death certificate.
In England, the number of deaths involving Covid in Week 11 was 912, accounting for 9.4% of all deaths compared with 13.9% in Week 10.
In Wales, there were 49 deaths involving Covid in Week 11, accounting for 7.9% of all deaths compared with 9.9% in Week 10.

And on excess deaths:
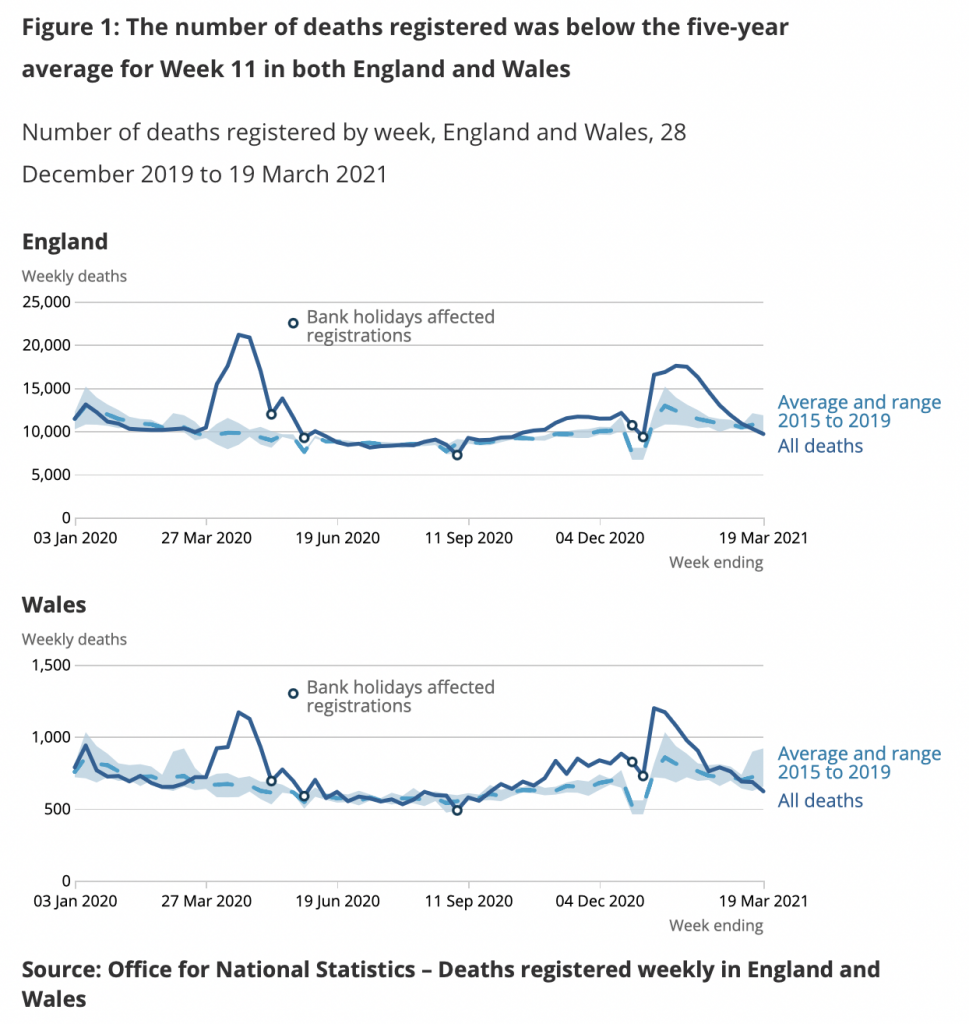
The provisional number of deaths registered in England and Wales decreased from 10,987 in Week 10 (week ending March 12th 2021) to 10,311 in Week 11 (week ending March 19th 2021). The number of deaths was 8.0% below the five-year average (894 deaths fewer).
In England, the number of deaths decreased from 10,277 in Week 10 to 9,673 in Week 11, which was 774 deaths (7.4%) fewer than the Week 11 five-year average. This is the second consecutive week that deaths have been lower than the five-year average in England.
In Wales, the number of deaths decreased from 685 in Week 10 to 621 in Week 11, which was 106 deaths (14.6%) fewer than the Week 11 five-year average. This is the third consecutive week that deaths have been lower than the five-year average in Wales.

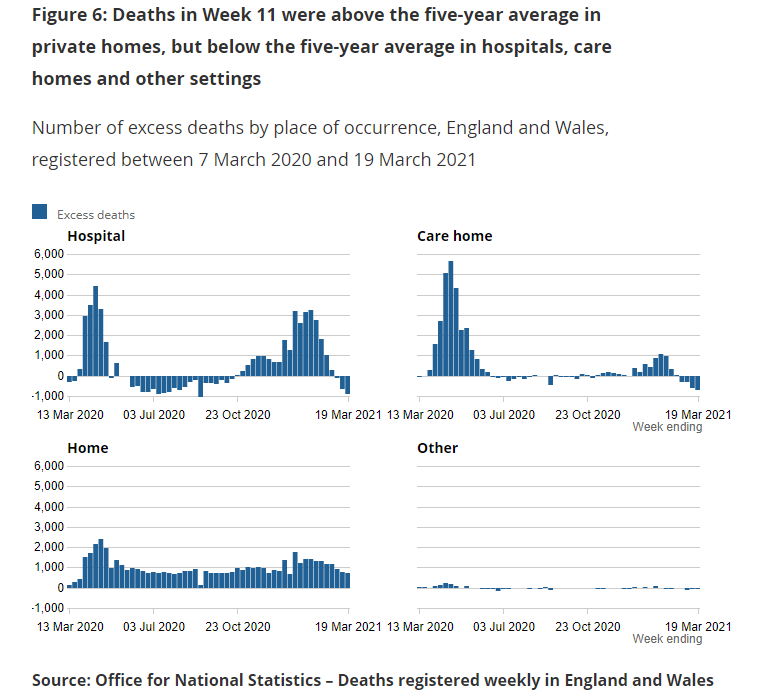
Deaths in private homes continue to run significantly above average, as they have since the first lockdown, with 715 excess deaths or 27.7% above the five-year average in the week ending March 19th. Many of these deaths may be avoidable as they reflect people not accessing medical care.

Worth reading in full.


To join in with the discussion please make a donation to The Daily Sceptic.
Profanity and abuse will be removed and may lead to a permanent ban.
I made the point on another site in around Sept that all that had happened was people who were late for their appointment in 2019 (dry tinder) had just caught up and that some more people had their appointments brought forward.
Oddly enough it upset some people who seem to think we’re immortal.
The ‘dry tinder’ effect is very noticeable, especially when you analyse data over a two-year period.
Periodicity is clearly an issue in terms of viral effects and, ultimately, mortality. As you say, too many people think asinine sentimentality over the immutable facts of life (and death) represents some nebulous virtue. They confuse it with compassion.
all cause mortality is very low now. there are no ‘of’ covid deaths – only some people who died of old age who a) had covid b) had covid in the previous 6 months that showed up on PCR c) false positives
Absolutely.
If the covid deaths were extra deaths then we’d be running at 8% + 9.3% (percent of covid labelled deaths) = about 17% below the 5 year average of deaths. And at a time where healthcare for other conditions has been in short supply, with missing cancer diagnoses and treatment and increased suicides etc etc etc
That can’t be the case and you can pretty much consider all covid labelled deaths are other deaths packaged up as deaths from covid. The loose filling in of death certificates shouldn’t fool anyone.
It’s below the 5 year average because many of the vulnerable have passed due to lack of access to treatment for other conditions, respiratory deaths during a hard Winter and unexplained deaths after experimental vaccination.
Just a couple of errors :
(a) Again – 2015-2019 is a stupid baseline for comparative purposes in those graphs.
(b) “death registrations in England and Wales involving the coronavirus“. ‘Nuff said – ‘involving’ isn’t ’caused by’. It’s the same old PCR shit.
Re. (a) – just to explain ‘Why?’ – It’s because that selection of years is both too short, even if recent, and, because of its abnormally low mortality, tends to exaggerate the relative level of 2020-21 mortality.
Time for a jailbreak from lockdown, folks.
The way the death certificate mechanism has been fraudulently manipulated by the government. PHE. and WHO working together, means that the influenza/pneumonia numbers and the covid numbers are not additive. The ’cause of death’ in the vast majority of these cases is pneumonia. The death certificate mechanism means that without PCR test, without specific symptoms diagnosed by a doctor , covid will be recorded as the cause of death even when it could be influenza and or some other agent causing the pneumonia. No-one knows if the dark blue ‘ in the covid graph should in reality be dark blue in the influenza/pnuemonia graph, but its highly likely.
Another 715 excess home deaths this latest week, and even if you subtract the deaths labelled as covid that still leaves you with 619 excess home deaths this latest week.
Some of these 619 might have died had they been hospitalised but many would not if you reasonably assume hospitalisation has a purpose.
In total about 45,000 excess ‘non covid’ home deaths since March 2020.
And this compares with 912 covid labelled deaths, which has already been said effectively includes next to nobody who has died from covid.
Not much mention of the home deaths though is there.
As recently as 20 years ago, investigative journalists would have been all over this, whatever the ‘OF’ck’ warnings were. But the internet has killed them off. So now we are left with blogs etc which are so easily switched off and are minority sports.
Computers, the internet and social media all controlled by a few companies in silicon valley have made this so easy for them.
You’re all missing the point!
90% of deaths are NOT from covid.
WE NEED TO DO SOMETHING!!!!!
Dear Mr Curzon
I have no faith in the government’s concept of covid mortality and have been plotting all-cause excess mortality by age group compared with the average for the previous 5 years for England and Wales by age group.
The latest version up to Week 11, ending Friday, 19 March 2021, is available at:
https://www.flickr.com/photos/189200946@N04/51084445312/in/dateposted-public/
The 85+ group is now significantly below the average for 2016-2020. Only the 45-64 age group remains above average.
The anniversary of the start of the epidemic is imminent, peaking in the weeks ending 17th and 24 April 2020. The data for the 85+ age group should start to show a very marked decline compared with the average for the previous 5 years.
Doubtless the usual suspects will claim this as a victory for vaccination, overlooking the fact that the 85+ age group is a small cohort – circa 1.6 million – and most of the over 85’s who were susceptible to the virus have already died. The same will apply to the other at-risk groups, namely those over 65 with other medical conditions.
Other graphs uploaded yesterday plot all-cause mortality for 2015, 2018, 2020 and 2021, and excess mortality for the same years (2015 and 2018 being the last two bad ‘flu years).
Using ONS ‘with covid’ data, the fourth graph compares excess with ‘with covid’ deaths and plots the difference. Excess deaths have been below deaths ‘with covid’ since about the first week of October last year, and have been running about 2,000 fewer per week since mid-January. Presumably this is merely an artefact of the concept of dying ‘with covid’.
Mr Legiron has observed that a vaccination programme such as the one the government has stampeded the public into, is not without risks. He has commented on the matter here:
https://underdogsbiteupwards.wordpress.com/2021/03/18/the-vaccinators/#comment-60986
DP