
On Friday, I argued that 2022 was a normal year for mortality in England and Wales – contrary to some recent headlines. My two main points were that 2022’s age-standardised mortality rate was the third lowest ever, and age-adjusted excess mortality was negative (fewer people died than normal, after taking account of ageing).
The article attracted some criticism. One objection was that absolute number of deaths is a better measure than the age-standardised mortality rate, and the former shows substantial excess mortality in 2022. Another objection was that the second half of the year saw substantial excess mortality, even if the first half of the year did not.
I disagree with the first objection: the ASMR is a very widely-used statistic, which is closely related to life expectancy. So if you’re sceptical of the ASMR, you ought to be sceptical of life expectancy as well.
It’s also an odd objection coming from sceptics. When lockdown proponents were citing the absolute number of deaths in 2020 as evidence for the necessity of lockdown, it was sceptics who pointed out that the ASMR wasn’t that unusual. The chart below, taken from a BMJ article, was widely shared by sceptics on social media (and rightly so):
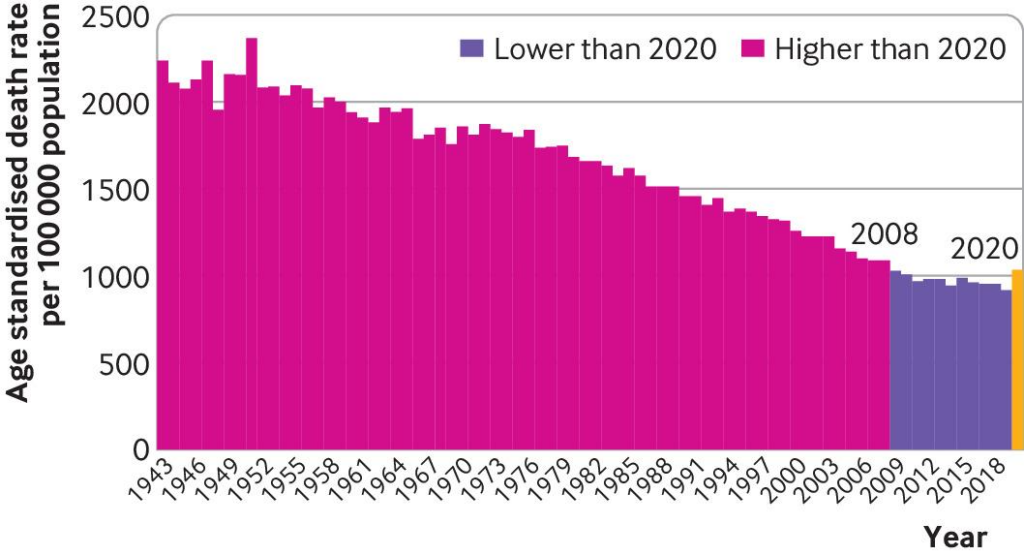
If you say the absolute number of deaths is the right measure to use, you have to accept the mainstream narrative that 2020 was a very unusual year. In fact, 2020 wasn’t a very unusual year. But we only know that from looking at the ASMR.
The second objection is slightly stronger. The latter half of 2022 did see non-trivial excess mortality: the ASMR was about 5% higher than the five-year average. If this trend continues, it will make sense to talk about unusually high mortality.
On the other hand, the first half of the year saw negative excess mortality: the ASMR was about 6% lower than the five-year average. This means the positive excess mortality in the second half of the year could be due to ‘dry tinder’: fewer people died in the first half, so there were more at risk of dying in the second.
Last time, I plotted the annual ASMRs in England and Wales. But we can also look at them by the month. Here’s the monthly ASMR in England, going back to January of 2001:
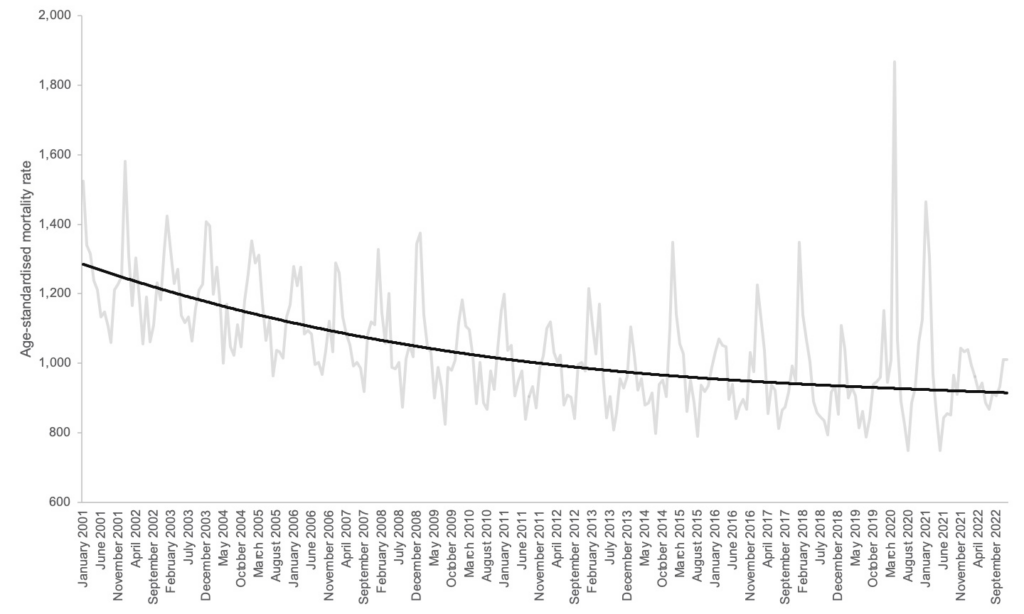
The black line is a third-degree polynomial (a cube term) fit to the data from 2001 to 2019. It gives a prediction of what the monthly ASMR would have been if the pre-pandemic trend had continued.
Looking at the most recent months, the data (in grey) are not too far from the black line – indicating that mortality is not particularly unusual. An important caveat is that mortality typically peaks in January, and the latest datapoint is from December. So the grey line will probably rise substantially next month.
However, notice that the mortality peaks in 2015 and 2018 were both very far above the black line, even though there was no pandemic or crisis in the NHS. Just because mortality comes in higher than expected for a few months, doesn’t mean there’s anything wrong.
It’s possible that a serious crisis is developing in the NHS, and mortality will remain elevated for some time. However, we’ll only know that once we have the data. At the moment, there’s no reason to panic.


To join in with the discussion please make a donation to The Daily Sceptic.
Profanity and abuse will be removed and may lead to a permanent ban.
I wrote a similar comment against a piece yesterday. I broadly agree with this, but don’t forget that there is a reverse side to the “dry tinder” effect. So when a large proportion of your elderly population, who were infirm and susceptible to a mild but novel virus (against which initially there is no immunity) are (as it were) “tipped over the edge,” there is then little dry tinder in the following years. This is just another natural cycle of which there are many in nature (consider e.g. insect populations). It is difficult to ascertain for example, where excess mortality would be if it were not for the vaccines. Under normal circumstances, with that kind of an event, we would expect it to be negative but it isn’t. And of course in many countries (I haven’t done the analysis, but at a glance they appear to be where there were lower death rates during the pandemic proper), there is now “inexplicably’ high excess mortality While Covid itself has become a very mild disease.
Lower mortality rates do not therefore axiomatically indicate the vaccines are not damaging as we do not know for sure where mortality rates would be without them. To assess that we have to see death broken down by age cause and vaccine status and determine if there is disproportionate death in categories related to vaccine effects. Figures the ONS surely have, but that, for some reason, they are reluctant to make public.
Great post!
Precisely! Those big peaks of deaths in 2020 and 2021 will have knocked out all the really sick and close to death people, plus quite a few who were actually fairly healthy. Deaths in 2022 should have been well below the black line, and even the winter 22/23 peak should perhaps only be just reaching that line. But thats not whats happened. Look how the summer trough in 2022 hardly drops anywhere near as low as in previous years, way above the 2021 and 2020 troughs. Eyeballing it looks like its the highest trough since 2011. 2022 only looks ‘OK’ on the basis that you ignore the fact that the peaks in 2020 and 2021 ever happened.
‘… (against which initially there is no immunity)…’
Clearly there was natural immunity, likely cross-over from the other coronaviruses that have been circulating for decades/centuries) as evidenced by the large number of people on the Diamond Princess cruise ship that did not get it, and many others in the general population – me included – who didn’t get it despite (because) not wearing a mask or being vaccinated.
All government and MP’S should be made to study the Diamond Princess. 15 minutes well spent and shows just how “novel” the virus really was.
One source of information I always try to factor in to my thinking is a very simple one: the eye test.
I don’t observe any unusually high rates of mortality among my acquaintances. I must.know several hundred people of varying ages, so it’s not a completely meaningless sample.
The same was true for covid deaths. Didn’t really know anyone who died of covid.
Interestingly I personally know several people with covid jab injuries of varying degrees of severity.
Hence my general belief that there was no pandemic, at least in the former sense of the word and the jabs don’t kill too many people but they do cause quite a lot of harm.
Yes. The ‘died suddenly’ has taken on such a life of its own, that people are now focusing on premature/sudden death as the main problem with the vaxx. Once Damar Hamlin was released from hospital, the story itself seemed to die suddenly. But what happened to him, will he ever be fit enough to return to pro-football?
Same with any young person who suffered heart problems, whether the problems were detected or not – what does this mean over the longer term? What is the effect of diagnoses of myocarditis in youngere people following the vaxx going to mean in terms of life insurance and the like, health care premiums in countries without (good) public health care?
As for the excess mortality, the problem is not limited to England, as we know. After Noah’s article last week I had a look at NL annual mortality going back to 1990. There was at least one year where mortality actually went down by about 5%, without a peak before or after, only trending upward gradually after that. Nevertheless, by and large the trend upward (with an aging population) has been steady, no year showed an increase or decrease of more or less than approx. 5% (I did not make calculations, just had a precursory look). Until 2020 – a more than 10% increase in mortality from 2019 and the average of the preceding 5 years. This 10% increase compared to 2019 was maintained in 2021 and 2022 (in fact higher in both years – no dry tinder effect to be seen).
Just about every week since March 2022 has seen elevated mortality, in most cases excess, of well over 10%. The Dutch figures take account of an aging population, the excess is therefore over and above an adjusted count. March 2022 was 3 to 4 months after poke 3, and a few weeks after poke 4 for over 60s. The line only started heading down in September, only to rise again almost immediately after the start of poke 5 (4 for the population over 12).
But again, too much emphasis is being placed on the deaths. I think the greater problem with the vaxx will be in longer term cardiac disease, things like diabetes and kidney disease, blood disorders, cancers and autoimmune diseases. The real test will be whether we see a noticeable increase in this diseases in people at younger ages.
>The real test will be whether we see a noticeable increase in this diseases in people at younger ages.
Which, heaven forbid, does happen then those who made these decisions must be made accountable – at lease so this doesn’t happen again. That’s why we have air crash investigators – a plane crashes, the investigate it and instigate changes to try and prevent it happening again.
The IFR was known well before the vaccine rollout and it reduced with milder strains. Nobody knows/knew the long term effects of a novel vaccine. Do no harm should have applied but no, we coerce an entire planet to take it based upon the fallacy of reducing transmission and therefore protecting others.
It’s like we lost our collective minds.
Don’t we need to see mortality broken down by age?
Exactly
Trouble with ASM is that it only tells you about deaths in the oldest ages and at those ages it’s heavily dependant on the dry tinder effect
But if you must look at ASM let’s look at the under 75 ASM for England? We seem to be back to mortality levels from 20 years ago
And how is mortality in the 15-44 age group? (adjusted for population in that age group)
And how is mortality in the 45-64 age group? (adjusted for population in that age group)
On the topic of illnesses and injuries, rather than deaths, ebygum posted a link to this very thought-provoking article here a couple of weeks ago, at a time perhaps when not many people saw it. I’m surprised that generally it hasn’t been more widely reported and highlighted, I think it’s highly significant. It’s a recent report by the obviously highly reputable Institute for Fiscal Studies:
“In summer 2021, each month 15,000 or so working-age people started a PIP claim. That monthly figure had remained little changed for years. It then steadily increased, such that by July 2022 (the latest data) it had doubled to 30,000. This report investigates the increase.”
Why would this be happening?
https://ifs.org.uk/sites/default/files/2022-12/The-number-of-new-disability-claimants-has-doubled-in-a-year-IFS-report-R233.pdf?fbclid=IwAR1k-a8Om62k8oxzlRqcMbmBf9Rk-JKuIMNvnWST-i3VmnM8SnJtbenITyw
John Dee on substack plots it against the vax rollout.
“The second objection is slightly stronger. The latter half of 2022 did see non-trivial excess mortality…”
I dispute the word ‘slightly’!
(Also, I’m not so sure about the word ‘stronger’ either, as it suggests the first objection is weak.)
So here I am again feeling a bit bamboozled due to the contradictions in data interpretation and people seemingly coming to different conclusions. As someone not particularly data-savvy I rely on others to decipher these stats and translate them into laymen’s terms. For instance, here is someone saying the last 2 weeks of 2022 saw a 20% increase in excess deaths when compared to a 5 year average. What to make of it…?
“As of Dec. 23 2022 there were 14,530 deaths and 2,493 excess deaths registered in England and Wales. This was 20.7% above the five-year average.
Fast forward to the following week of data. By the week ending Dec. 30 2022, England and Wales registered 9,517 deaths, and 1,592 excess deaths which was a shocking 20.1% above the five-year average.”
https://jamescintolo.substack.com/p/new-study-171-of-kids-suffered-cardiac
I shall accept your cat offering, much obliged.😍 I’ve always thought Mogwai is a perfect cat name but mine is named something else. Yours looks like it’s on a movie set..
LOL! It’s the cat from The Matrix, I think….showing there’s a ‘glich’ in the system!
It perfectly sums what you and I are thinking…which is, why is Noah’s stuff at such odds with the other data?? Or maybe Nelli just thinks Noah is part of the Matrix? LOL!….
Considering how many years since I saw that movie I doubt I’d ever make the connection!😄
I agree…I think Noah is just plain wrong on this…
….besides the people who post here, Norman Fenton has pointed out the problems with the data sets Noah is using…I think!!?
This is Dr Campbell discussing the nearly 8% rise in excess deaths around the 20-44 year old in 2022…as opposed to 2019…using insurance actuary data…
LOL I just shared that further down. Great minds…. 😉
Maybe we are plugged into adjoining ‘pods’….LOL!! I’ve also just put it on the other piece by Will!!
>So here I am again feeling a bit bamboozled
In that you’re not alone. I feel battered by data and charts fighting against each other.
I said this on your last piece and I’ll repeat it as you decided not to include it in your rebuttals piece here.
Please look at age stratified excess mortality.
That is where the scandal will reveal itself.
I’m neither an expert in public health nor an expert in data analysis, but I do find the shift in tone on pandemic issues since the beginning of this year kinda strange.
Berenson is now calling for calm and meekly waiving a white flag. Scott Adams says the “anti-vaxxers clearly won”. And the DS is calling BS on stats it was screaming about constantly for the last two years. What the flugen is going on?
Agreed, I’ve been thinking the same thing. I have no problem with keeping a level head, in fact I welcome it. It does seem strange though, that the main sceptics or most outspoken critics seem to be switching to a softly softly approach all at the same time.
Perhaps because it looks like a very, very large number of people are walking around with quite significant concerns about literally just dropping down dead or never waking up. Some admit to this, but even those who don’t admit it, give away their concerns. When I read some of the comments I feel really bad for them and don’t think the high degree of concern is warranted. I think the vaxx is toxic garbage and that people definitely, definitely, definitely must stop taking any more of it and work on improving their health overall, but walking around thinking any minute might be your last may well be more damaging than the actual vaxx for most people.
And no, I haven’t forgotten the mandates, the coercion, no jab no job, exclusion from society BS, but I separate that from people who are clearly worried for themselves and/or people they love. I’m reserving my hatred for the politicians, public health authorities, $cientists and whore media that engineered all that.
Memento mori
Has to be a syringe filled with you know what.
Age and population adjusted excess deaths is the standard. But isn’t the concern about excess deaths, that happening in younger age groups, not the overall figure?
The problem with averaging over a range, is a decrease at one end could balance out an increase at the other. Therefore the previous year’s cull of the elderly hiding the increased mortality among the young.
Isn’t the excess apparent in the number of sudden heart attacks of no apparent cause?
We also see a correlation (yes, yes) of increased mortality with vaccination campaigns particularly booster.
Let’s not get distracted by statistical niceties. A lot… à lot!… of fit, healthy young people are dropping dead – why?
I was asking about actuary data the other day and here is John Campbell, once again flying by the seat of his pants within the constraints of the YT guidelines, talking about excess deaths and citing this very data source. For instance, 2022 saw a total increase in excess deaths of 7.8% in the 20-44yrs age group compared to 2019.
https://www.youtube.com/watch?v=OD0na_NZaLM&ab_channel=DWNews
That’s based on the CMI (Continuous Mortality Investigation) data. The CMI are owned by the Institute of Actuaries.
They do their calculations based on age standardised mortality (ASM) but they compare against 2019 as a base year. They basically work from ONS mid-year population figures split by age and sex and then fill in the gaps between these mid-year figures and adjust to the European standard population. Or in simple terms they broadly replicate what the ONS do.
There was criticism of the CMI change to using 2019 during the pandemic here on the Daily Sceptic as it was a low year and tended to overstate excess deaths. Of course it can now still be criticised for overstating excess deaths.
All the issues of using ASM apply here, but the age banded figures have some use.
This was the article when the CMI changed from the 10 year average to 2019 as a baseline
https://dailysceptic.org/2021/05/26/why-has-this-mortality-monitor-suddenly-changed-its-baseline-from-the-ten-year-average-to-2019-the-lowest-mortality-year-ever/
Thank you! 🙂
I’ve got a great idea.
Why don’t we differentiate between the jabbed v. unjabbed re the apparently puzzling increase in deaths.
ONS has been hiding that since July 2022 I think.
Surely you need to break it down by age ranges. The vaccine signal would be more obvious in the young.
Leaving aside the obvious is it surprising that more people are dying of late. There isn’t exactly a sense of a bright future awaiting us; show me one man in a billion who predicts a sunny outlook for the short to medium term. People do die of despair why would you apply energy to staying alive in a world moving in this direction. If you were on your way out your impulse would be get things moving perhaps. Like when you hear about things like mental health awareness week when the very fundaments of the culture are utterly inimical to mental health.
That is one very bleak outlook. However, I think you speak the truth of what many are feeling and nobody wants to say out loud. Honestly speaking, I feel like this is the single worst time to have mental health problems, ever! I think if you had issues before all of this kicked off then it will have just worsened things for you, and I’m wondering ( because we never tend to hear anything relating to this ) just how many people are having mental health challenges that they didn’t have a few years ago.
And I’m not just referring to the whole ‘Plandemonium’ Covid thingy but all the other manufactured crises. Is it just me or did we not hear about all of these militant Trans people and the entire ‘Wokedemic’ back in 2019? I honestly cannot remember reading any of the stories we’re seeing now. Yes there’s always been climate change loons, but did people used to glue themselves to priceless works of art and tip tomato soup over themselves? Either I was oblivious or every ‘crisis’ has been ramped up and people are getting really nasty and really extreme across the board. It’s like everybody has to pick a cause and then go for it great guns. Perhaps I’m showing my age but I thought life was meant to be enjoyed, valued and lived to the fullest. What kind of out-dated attitude is that to have nowadays?? 🙁
Pro Tip: Stop reading the news, including this website. Then go enjoy life.