Throughout the pandemic, those in favour of more restrictions have argued there is a straightforward relationship between restrictions and case numbers. When the government imposes restrictions, the number of face-to-face interactions goes down, meaning there are less opportunities for transmission.
A week or so later, you should see case numbers start to fall. Or so the argument goes. Yet as David Paton noted in my recent interview with him, the assumption that “governments can turn infections on or off like a tap” simply isn’t true.
Last spring, almost every country around the world saw a large drop in mobility – as measured by indexes that track people’s smartphones. In most countries, this drop not only coincided with the start of lockdown, but also preceded a fall in case numbers by one or two weeks.
It was therefore widely assumed that mobility could serve as a proxy for the kind of behaviour change that causes infections to go up or down. However, examples like South Dakota – where infections fell rapidly without much change in overall mobility – cast serious doubt on this assumption.
In other words, just because mobility has fallen, doesn’t mean case numbers will go down; and just because mobility has risen, doesn’t mean case numbers will go up. This suggests the relationship between restrictions and case numbers is far from straightforward.
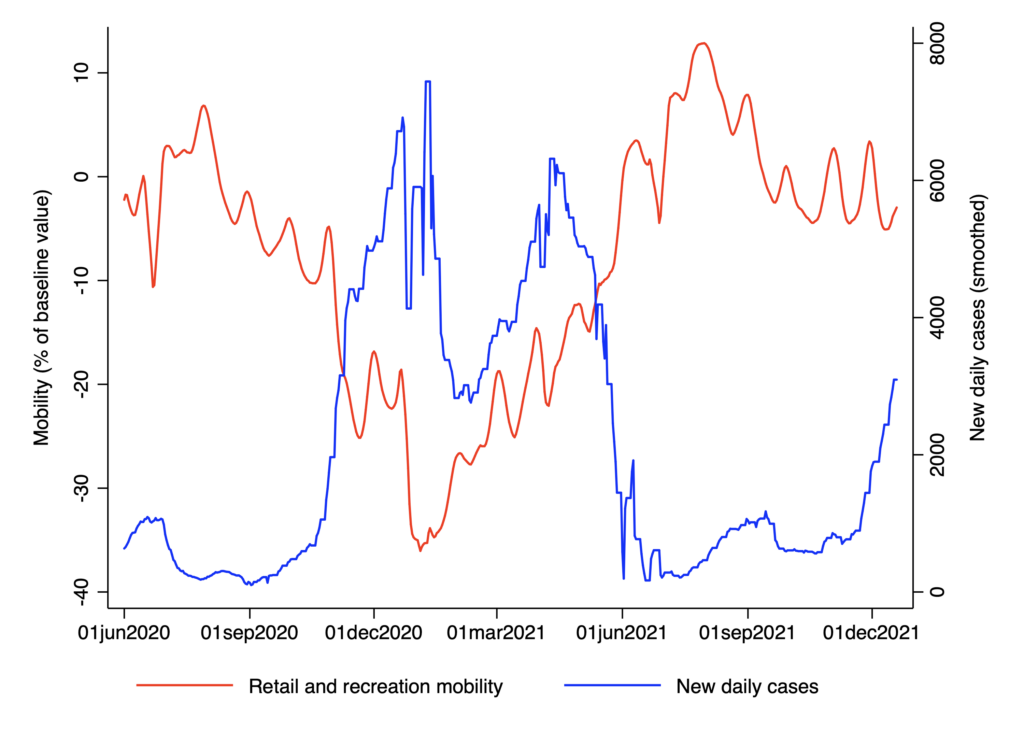
I plotted mobility alongside new daily cases for Sweden – one of the countries where restrictions have been least stringent. If mobility were closely related to infections, we’d be able to pinpoint precisely when restrictions should have been made more stringent, in order to get case numbers down. But that simply isn’t possible, as you can see below.

Mobility starts rising in mid January, which initially coincides with an increase in case numbers – so far so good for the theory that restrictions drive behaviour and behaviour drives infections. Case numbers then start falling in May. Yet mobility continues rising for another three months.
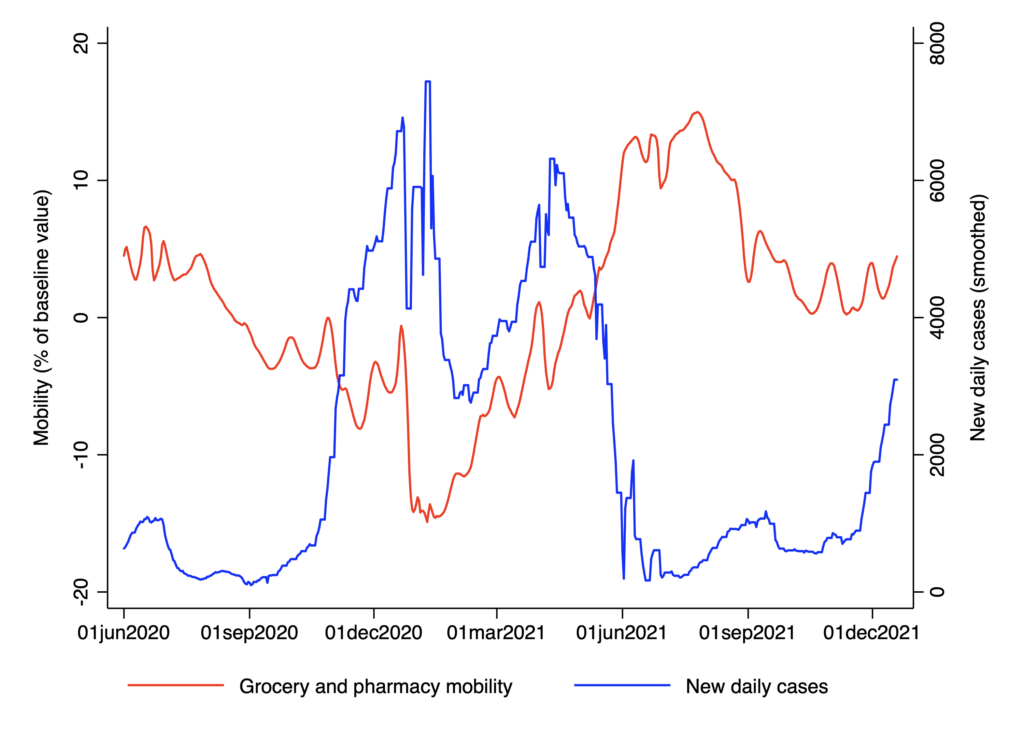
The chart above shows retail and recreation mobility. Exactly the same pattern is visible if we look at grocery and pharmacy mobility:

Mobility reaches a value that’s almost 15% higher than baseline in late July. But it’s not until mid November that case start rising again.
How can it be that mobility has such a weak relationship with the number of infections? After all, the virus is spread through close contact; it isn’t transmitted over email or via the telephone.
The most likely answer is that factors like viral evolution, seasonality and population structure are more important than overall mobility. Which is not to say that mobility doesn’t matter. But the evidence that it’s what drives the epidemic is surprisingly scant.


To join in with the discussion please make a donation to The Daily Sceptic.
Profanity and abuse will be removed and may lead to a permanent ban.