I previously reported on Youyang Gu’s analysis of Covid death rate and average stringency index across U.S. States. As you may recall, Gu found essentially zero association between the two variables: there was no evidence that states with longer and more stringent lockdowns had fewer Covid deaths.
One weakness of Gu’s analysis is that he used the official Covid death rate as a measure of mortality. This is problematic for two reasons. First, different states may count Covid deaths in slightly different ways. And second, the official Covid death rate doesn’t account for differences in the age-distribution across states.
Since older people are much more likely to die of Covid, states with more old people will tend to have more Covid deaths. For example, more than 20% of Floridians are over 65, compared to only 12% of Alaskans. Hence you’d expect more Floridians to die of Covid, all else being equal.
Incidentally, Gu did find an association between average stringency index and the unemployment rate. (States with longer and more stringent lockdowns had higher unemployment.) This suggests that average stringency index at least partly captures the extent to which different states curtailed economic activity.
As I noted before, the ONS recently published estimates of age-adjusted excess mortality for most of the countries in Europe, covering the entire period from January 2020 to June 2021. And this measure doesn’t suffer from the two problems outlined above.
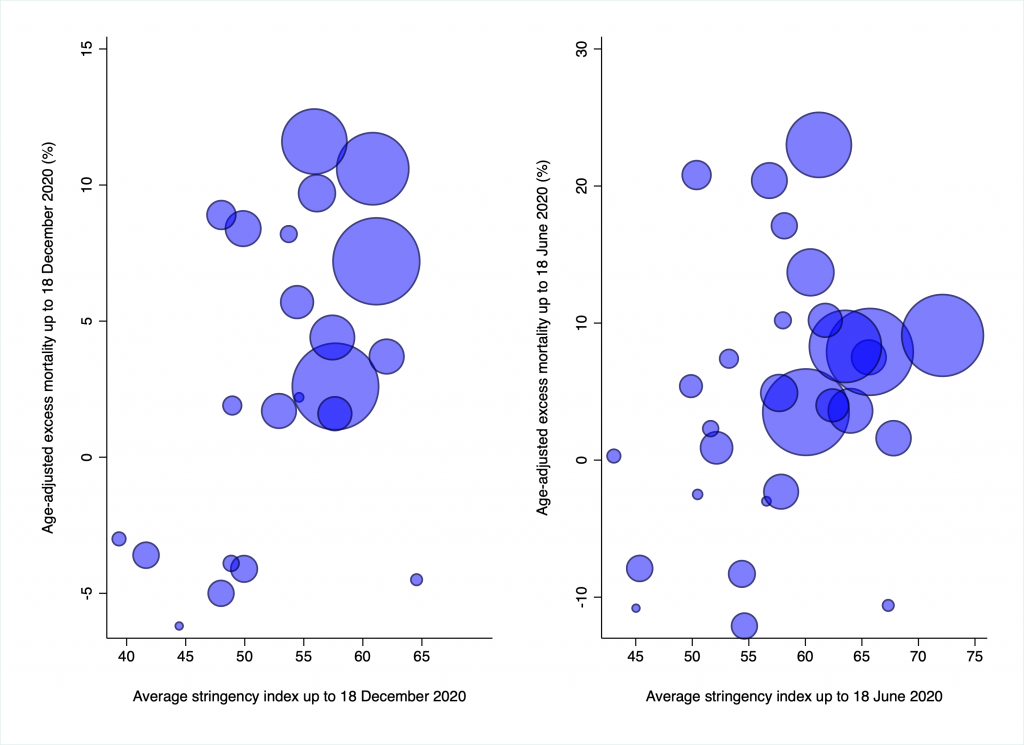
I therefore decided to check whether there’s a negative association between average stringency index and age-adjusted excess mortality. Other commentators have produced similar plots before, but I haven’t seen one based on the latest estimates from the ONS.
Results are shown in the figure below. The left-hand chart corresponds to the ONS’s earlier estimates, covering the period up to 18 December. The right-hand chart corresponds to the latest estimates. (The reason I included the left-hand chart is that the one on the right is somewhat affected by the vaccine rollout.)

In any case, neither chart shows any hint of a negative association between average stringency index and age-adjusted excess mortality. States that had the longest and most stringent lockdowns do not have lowest mortality. In fact, both the correlations are positive.
This doesn’t mean lockdown had no effect on the epidemic’s trajectory in any country. But it does suggest that any effect it did have was swamped by other factors (e.g., geography, population density, household structure).
The countries clustered at the bottom of the right-hand chart are the Nordics, Cyprus and Malta. As I noted last time, these are all geographically peripheral countries that used border controls to contain the virus. The only one that made extensive use of lockdowns was Cyprus (see lower right-hand corner). And this appears to have paid off.
However, larger countries that made similar use of lockdowns (see centre of chart) have had much higher mortality. I take this evidence that lockdowns may work in countries like Cyprus or New Zealand when combined with border controls. But that they don’t seem to do much in large, dense, highly connected countries like Britain.


To join in with the discussion please make a donation to The Daily Sceptic.
Profanity and abuse will be removed and may lead to a permanent ban.
Nobody can be trusted with our data. Least of all the state and the government.
The author may scoff at the obtuseness of DS readers, but he is even more ignorant of his own blind spot.
Governments are the biggest abusers of power. The bigger the entity, the bigger the abuse.
This man/woman just doesn’t get it.
Exactly, Stewart. Perhaps the author can be persuaded to reveal who he/she is. As far as I am concerned, it’s gaslighting.
Yep. Exactly this, government are always the biggest threat to citizens. A few examples, ww1 the mindless slaughter of young men to no purpose, convid the ventilation to death of the elderly and finally the stabbination program that randomly killed/maimed all ages groups.
The difference between big tech and goverment is what? The two are the two side of the same coin.Anyway see an example of whether to trust goverment- see Hallet inquiry.
Why so certain they don’t know what we’re buying?
There will be a transaction code and the till generates a receipt number so even if they don’t CURRENTLY know what we’re buying it’s not a big step to join the two up…
Add to this reports of when the police are trying to track people for identity theft they look at what brands/products they’re buying to try and link them it suggests some parts of the state already can/do so
Gives the lie to the NatWest bullying, doesn’t it – bet they’re not targeting existing veggie noshers. Supermarket chains can already tailor vouchers to previous purchases; similarly Ebay, Amazon and other online retailers – they’ll all try and sell you another gizmo like the one you just bought. If they hold that data, don’t tell me the bank data scrapers can’t access it if they wanted to. It’s what ‘purchase history’ is all about!
The option of non-banking PIPs to provide wallets sounds intriguing; but what’s the betting they’ll make it extremely difficult for the FSU or other motivated organisations to set one up – as with anyone wanting to start an independent bank, for example.
Ditch your Nectar and Clubcards. You’re selling your data and facilitating surveillance.
Also get rid of your bank’s app on your phone, and certainly don’t use google or apple pay either.
I wonder how many excitable Islamofascist Jihadis have already been debanked?
None and zero point zero being even vaguely considered?
Well! My flabber is absolutely ghasted!
Quite why you’re always ‘anonymous’ is not clear to me but that aside I simply don’t agree with you. If it’s programmable, digital currency using online access, it can, in theory, be taken over and abused by other less-than beneficial parties. That makes it unsafe and far from secure. Personally, I see this drip-drip of articles in support of some sort of digital currency as nothing but gaslighting. Am I to believe that the DS has also been co-opted and corrupted?
Exactly Aethelred. I am all for hearing the alternative point of view but how many more times do we have to have the case for CBDC’s in the face of resolute ‘no thank yous’ from the DS membership?
The possibility that CBDC’s will not be abused is so remote as to be on a par with a government that would act in the best interests of its people.
One reason could be that ‘anonymous’ doesn’t necessarily have to be just one person. Of course the Elephant in the room is that we all hide behind a nom de plume on DS.
My name really is Aethelred though!
“Sustainable Development”——–The lowering of living standards and therefore well being and life expectancy based on a political agenda regarding the earths resources and wealth ,all to be controlled by technocrats at the global government in waiting at the UN and WEF and to which all western politicians have signed up to. We see that with their endless preaching about a climate crisis unsupported by any science and their determination to enforce NET ZERO.
That’s everything in a nutshell.
wink
Beautifully put.
wink to you as well. ———–I have been looking into this issue since about 2007. I don’t think I know everything but I do feel I understand this issue better than ordinary people that are being fleeced. But often you find those being fleeced think that any opinion that contradicts the current narrative of a climate emergency must be some kind of conspiracy theory.
The last paragraph seems plausible , maybe something like that will materialise 🤞
Has Anonymous IT Reporter ever explained why, in his opinion, governments are so keen on CBDCs?
I make many of my purchases using a credit card which I pay off automatically in full each month. Best of luck to my bank in assigning a carbon footprint to these purchases from home and abroad.
“The design choices will need the wisdom of Solomon”.
Considering that these deign choices will have gone through multiple iterations and passed through the hands of multiple technical and management committees, wisdom of any sort will have been lost at an early stage.
Boom. Nail on head, but, no, CBDCs are not the solution. The solution is rebalancing society, which means razing the current political system to the ground, and introducing legislation that makes it unlawful to restrict how people use their own money. The solution is not to provide even more potential for the state to engage in totalitarian control. To have lived through the last few years and come to the conclusion that CBDCs are the answer is absolutely perverse.
Like others, I think we must know the authors identity. Tony, please step forward.
How do you introduce legislation after razing the current political system to the ground?
Related to Net Zero in the name of saving the planet. Goes to show just how far removed from concerns about the flora & fauna of the natural world the net zero zealots are.
https://www.spectator.com.au/2023/11/killing-koalas-to-save-wind-farms/
To make the case against CBDCs, watch this:-
https://twitter.com/Alphafox78/status/1703924055508656404
Here we go again.
As we saw during the Covid Lunacy, the Government and the B of E are the chief protagonists of control, surveillance, propaganda and currency destruction (inflation).
Climate Change propaganda and coercion comes direct from the Nudge Unit.
A CBDC isn’t the way to fight propaganda, coercion, surveillance and cancel culture: it’s the way they intend to make it unstoppable and impossible to oppose.
Hmm, the private sector’s making a really bad hash of it. Let’s hand it to the Government to do. When has that ever worked?
Natwest started calculating your “Footprint” LAST YEAR. it’s Orwellian. you can turn it off but it continues to monitor in the background. it makes suggestions like “Buy used clothing” etc. It must have been in the small prints somewhere & they just launched it. I have moved a huge chunk of money out of my natwest account as these bankers are NOT on our side.