Public Health England (PHE) published their latest weekly vaccine surveillance report on Thursday. Usually these just summarise other studies so are not particularly interesting, but this week something new appeared that has been widely asked for but elusive: data on cases, hospitalisations and deaths broken down by age and vaccination status.
Although the fortnightly technical briefings on the variants of concern have a breakdown of sequenced Delta cases broken down by vaccination status and into the over-50s and under-50s, this is the first time PHE has published general data on all cases (not just sequenced ones) split up by age and vaccination status.
The data comes from the Second Generation Surveillance System (SGSS), the relationship of which to the Government dashboard data is unclear, though the figures are similar. It reports 722,728 cases in the reporting period, compared to the dashboard figure of 727,010 by specimen date, so this seems comprehensive. On the other hand, it includes 6,605 hospitalisations, whereas the dashboard has 21,242, more than three times as many, though this may be due to how it counts hospitalisations (“Cases whom [sic] presented to emergency care (within 28 days of a positive specimen), resulting in overnight inpatient admission”). It has 2,381 deaths, against the dashboard’s 2,496, so again this is most of them.
It is just data for the past month, August 9th to September 5th. We can use it to calculate a rough estimate of unadjusted vaccine effectiveness in different age cohorts for this four-week period.
However, the report itself cautions against using it for this purpose. It says: “The vaccination status of cases, inpatients and deaths is not the most appropriate method to assess vaccine effectiveness and there is a high risk of misinterpretation. Vaccine effectiveness has been formally estimated from a number of different sources and is described earlier in this report.”
These “different sources” are the various studies that are released by PHE from time-to-time, which tend to involve some heavy adjustments to the data and a number of other issues, and which consistently overestimate vaccine effectiveness compared to real-world data.
The report explains why the data should not be used to calculate vaccine effectiveness:
In the context of very high vaccine coverage in the population, even with a highly effective vaccine, it is expected that a large proportion of cases, hospitalisations and deaths would occur in vaccinated individuals, simply because a larger proportion of the population are vaccinated than unvaccinated and no vaccine is 100% effective. This is especially true because vaccination has been prioritised in individuals who are more susceptible or more at risk of severe disease. Individuals in risk groups may also be more at risk of hospitalisation or death due to non-COVID-19 causes, and thus may be hospitalised or die with COVID-19 rather than because of COVID-19.
This is claiming that the vaccinated are more likely to be in high-risk groups, which implies to me that a breakdown by other risk factors like comorbidities would be useful. However, now that most of the population is double vaccinated, particularly in the older age groups, this point would seem to be much less valid, so that the picture painted by this real-world data should be truer to the reality. In any case, let’s see what it shows.
I have calculated the unadjusted vaccine effectiveness against reported infection, hospitalisation and death for each age group and also for the under- and over- 50s.

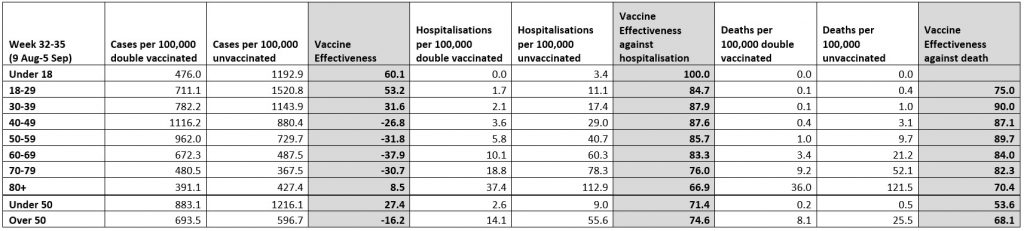
Strikingly, during this four-week period the vaccine effectiveness is negative in all the over-40s age bands except the over-80s – the vaccines seemed to make things worse, with the vaccinated having disproportionately more infections than the unvaccinated. For 60-69 year-olds it hits as low as minus-38%. This makes a nonsense of vaccine passports or any measure based on the notion that vaccines prevent infection.
One factor in this will be that, as we know from the technical briefings, the vaccinated curve rose and peaked later than the unvaccinated curve, which will have exaggerated vaccine effectiveness initially and underplayed it later. A longer period than the last four weeks would therefore be useful to take into account this unexpected phenomenon.
The vaccine effectiveness against hospitalisation and death is still looking pretty good. One thing worth noting is that the vaccine effectiveness in the larger age brackets of over- and under- 50s can be lower than it is in each finer age band. So the vaccine effectiveness against death in the four age bands over 50 is up at 89.7, 84, 82.3 and 70.4. Yet in the over-50s group when taken as a whole it is only 68.1%, lower than in each of the individual age bands. This is an odd quirk that occurs because of the big differences in risk between the age bands, so that as the very high number of deaths in the highly vaccinated over-80s are mixed in with the deaths in the younger age groups the overall effect is to depress the vaccine effectiveness. This means the more age-specific values may give a more accurate guide to the true effectiveness of the vaccines than those from the broader age cohorts. Interestingly, for effectiveness against infection in the over-50s the pooled value is higher than the value for the separated age bands, though is still negative at minus-16.2%.
Looking at the proportion of reported cases and hospitalisations which are vaccinated and unvaccinated, overall 39% of reported cases are double vaccinated versus 35.4% unvaccinated. In the over-50s, 82.6% of reported cases are double vaccinated versus 7% unvaccinated. For hospitalisations, overall 48.9% are double vaccinated versus 43.8% unvaccinated. In the over-50s this is 69.2% double vaccinated versus 26.7% unvaccinated. These statistics give the lie to any claim that it is the unvaccinated who are primarily spreading the disease or being hospitalised with it.
Having said this, 71.1% of hospitalisations in the under-50s are unvaccinated versus 16.5% double vaccinated. Also, 38% of total hospitalisations (2,538 out of 6,605) are in the under-50s, so this is not a small number. However, it’s worth noting that only 6.7% of the deaths are in the under-50s, so these hospitalisations are considerably less serious than the 62% of hospitalisations in the over-50s.
It’s good that PHE has finally released data broken down by age and vaccine status, even if only for one month.
Here’s a radical suggestion for PHE: why not make all the data publicly available so people other than the chosen few can analyse it for themselves and get a fuller picture?
This post has been updated.
Postscript: This article was subjected to a fact check by Full Fact who found it was “incorrect”. You can read that fact check here and Will Jones’s response here.
To join in with the discussion please make a donation to The Daily Sceptic.
Profanity and abuse will be removed and may lead to a permanent ban.
“make all the data publicly available” ? – why break the habits of a lifetime (or the last couple of years, at least)
I would very much like to see the yellow card reported vaccine related deaths by age group. I notice 20 more deaths reported since last week (when the MHRA mysteriously removed some of the reported deaths from the system). These 20 surely have to be from the pool of healthy young people who are currently receiving first or second injections. 20 people in a week. 73 over the last 4 weeks. And those are just the ones reported to the yellow card system. And we’re told the experimental shit is safe, and the pros outweigh the cons in young adults. And now they want to give it to our kids. Just no.
CDC vaers makes for an eye watering read as well. Agree it would be helpful to know age of deceased. I believe this is included in vaers.
Totally unscientific but something just doesn’t add up when I look around at my local community. It’s like we were living in two worlds – the real world and the media/government world. This could be the reason why one gets the feeling that Covid locally is (slightly) worse than last year when we didn’t have any vaccine. I don’t want that to be true but that’s what it feels like.
Funny how this distinction is only important now that it shows their miracle cure isn’t all it’s made out to be.
Bingo!
They are fudging the numbers as much as they please, because they know the masses won’t take notice.
Statistics like these are a manipulated fraud. The NHS changed the way they count cases, hospitalisations, and deaths after the vaccine came out to make it look as if it’s effective.
https://off-guardian.org/2021/06/11/the-nhs-just-changed-how-they-count-covid-cases-heres-why/
In the US the CDC is even more blatant, openly declaring that vaccinated patients get their PCR tests done with much lower cycle counts than the unjabbed.
https://off-guardian.org/2021/05/18/how-the-cdc-is-manipulating-data-to-prop-up-vaccine-effectiveness/
VaccinesExperimental mRNA injections are extremely dangerous in all age groups.Have NEGATIVE Effectiveness in the Over-40s, as Low as MINUS 38%, Shows New PHE ReportUpdated information, useful resources and links: https://www.LCAHub.org/
‘They blame the unvaccinated. They blame the “Delta Variant” or the “Mu Variant” or the “Scary Greek Letter Du Jour Variant.” But the vaccine nannies, including pretty much everyone in the Biden-Harris regime, cannot fully get around the numbers without major gaslighting. The data is crystal clear and leads to one of two possibilities.’
https://thelibertydaily.com/joe-biden-is-lying-data-shows-we-are-actually-experiencing-a-pandemic-of-the-vaccinated/
The author makes a very important point: The goal IS to “to turn the vaccinated against the unvaccinated.” It’s working.
This is perhaps why Governments are obsessed with getting everyone vaccinated. They do not want a compassion group of unvaccinated people as it will show that they have destroyed economies for no reason
Also I fear they don’t like having a small number of unvaxxed that can be used as an (inconvenient) control group!
Good point. I recently posted a comparison of COVID cases at Duke University (610 in 30 days) to nearby North Carolina State (about 300 cases in the same period of time). Duke has a 98 percent vaccination rate among students. NC State is “fewer than 50 percent.” NC State also has an undergraduate enrollment that is nearly 4X as large as Duke.
Take-away: The university with only 50 percent of its student body vaccinated (that is 4 times larger) had half as many cases as the smaller, fully-vaccinated campus.
The vaccine advocates don’t like having such a “control group” to allow comparisons like I just made.
There’s always been a disconnect between the leaflets issued to us in the UK promoting the use of the “vaccines”, and the political claptrap alongside it, though. The NHS leaflets make it clear that it’s only expected to reduce the severity of the illness; nothing more than that. However, there are those who sell it for other reasons, and pretend it’s an elixir.
I think this is a little more of a solid analysis. There are certainly caveats to some of this, especially the fact that PHE count someone under 14 days of their shot unvaccinated. However, it agrees on the negative efficacy for cases on under 50s, but tempers the effectiveness of on other categories because it takes into account the PHE count on unvaccinated one dosers but also roughly includes the numbers vaccinated in each cohort.
https://boriquagato.substack.com/p/are-covid-vaccines-working-take-2
The key table is this
“Vaccines Have NEGATIVE Effectiveness in the Over-40s, as Low as MINUS 38%, Shows New PHE Report”
And we know that the under 40s are at vanishingly low risk of death from COVID.
Only 0.24% of those who died with COVID in England and Wales in 2020 were under 40.
So there is no justification for the vaccine programme. None.
Actually by your own figures it’s .54% under 40. The .24% is in the 30-39 age group. Still a tiny number but the Covidian Cult focussed on such minor discrepancies and conflates them to muddy the truth.
…and how many of that 0.54% already have co-morbidities and/or are seriously overweight/not healthy? I bet the vast majority of them.
That’s why the newpapers focus on the rare cases of some ‘superfit’ young person who died of/with COVID – because there are so few. I’d put good money on more people in that group dying of injuries from car/motorbike accidents or stabbings.
Apologies you are quite correct.
And some context would be nice. A group (40 and under) that makes up approximately 50 percent of the total population accounts for less than 1/2 of 1 percent of all COVID deaths.
And one strongly suspects that 50 percent of the deaths of those under 40 were people who died “with” COVID not “from” Covid.
Well, that’s also interesting. If you assume that 0.5% of the population tests positive each week, then over a 28 day period, we might see 2% of the population testing positive. Our expected mortality each year is something around 600,000 of non-covid deaths. In our definition of dying “with covid” rather than of covid then, shouldn’t we expect to see about 2% of the normal deaths to be labeled “with covid”? That’d about 13,000 per year or 35 per day.
And this is before noting that it’s more likely to catch covid in a hospital than anywhere else—and, I think that we can all note that people in hospital are much more likely to die than people who are not in hospital.
This analysis is very much off the cuff. I would be very interested to see a more formal analysis of how much overstating using dying “with covid” is likely to generate. If you can factor in the increased risk factor of both death and catching covid of those being admited to both hospital and care homes, then I think that the results might be quite surprising.
I wrote an article on the UK study that analyzed all deaths of children (0 to 17) in the U.K. in the first year of the pandemic. The authors performed detailed “cause of death” assessments of every hospitalized child in the UK (through February of this year). They found that only 25 children died “from” COVID. The previous “official” numbers had recorded 61 deaths for this age cohort. So the authors reduced the “real” number of COVID deaths by 59 percent (from 61 deaths to 25). One suspects a similar detailed assessment of other age cohorts might have produced a similar reduction in mortality numbers/percentages.
Also, the authors said that of the 25 deaths of children “from” COVID, that 19 of these deaths occurred among children with severe or “life-altering” medical conditions. So only six deaths occurred among “healthy” children. That’s six deaths in an age cohort of 12 million. The mortality rate for “healthy” children was thus 0.000 percent.
Once one had a good analysis of how much the covid deaths were overstated here, one should be able to take the expected mortality based on demographics, etc. and project how much other countries are over/understating their statistics. Obviously, not precisely, but it would be interesting nonetheless.
Because of the definition of dying within 28 days of testing positive with COVID-19, I would be willing to bet that you could write a pretty good paper showing that motorcyclists are more likely to die of the coronavirus than car drivers. Or other equally absurd correlations.
That’s a great way to express the point. Must remember that for future use “covid likes killing motorcylists”.
The mortality data in Sweden is striking. Only 82 citizens of Sweden under the age of 40 have died of COVID in the last 18 months. An age cohort that makes up about 50 percent of the population has accounted for 0.56 percent of COVID deaths.
Almost 90 percent of all COVID deaths in Sweden have occurred in the population aged 70 and older. 66.8 percent of all deaths have occurred in the population that is aged 80 and older.
By far the largest number of COVID deaths (5,982) have occurred in the age cohort 80 to 90. The age cohort “90 and older” (which comprises less than 1 percent of the national population) accounts for 26 percent of all COVID deaths in this nation.
So in Sweden most COVID deaths have occurred among the population that had already reached or exceeded the national life expectancy of 82.5.
Here is the mortality figures by age cohorts in Sweden as of September 8, 2021 (per Statista). The population of Sweden is 10.17 million.
Age: Number of deaths
0 to 9: 9
10-19: 4
20-29: 22
30-39: 47
40-49: 119
50-59: 377
60-69: 1,041
70-79: 3,290
80-90: 5,982
90+: 3,8111
Deaths in Sweden under the age of 20: 13
Deaths in Sweden under 40: 82 (0.56 percent of Covid deaths).
Deaths in Sweden age 70 and older: 13,083 (89.24 percent of CV-19 deaths).
Deaths in Sweden age 80 and older: 9,793 (66.8 percent of all Covid deaths).
Total Covid deaths: 14,661
I hate to do it, but the stock go to covidian response…
What about long covid
Yep. That’s the narrative of the moment as well. “Long Covid.” But “long flu” also exists.
Children will survive “long COVID” fine. I’m sure some adults do have this, but most might be suffering from psychosomatic symptoms.
I still remember the epidemic of “Gulf War Syndrome” among military vets. All the symptoms were about as vague as “long Covid.”
Wasn’t that blamed on vaccines? Never happen today.
We all thought highly of Tegnell’s handling of the pandemic.Unfortunately when it comes to vaccination (I mean mass vaccination not selected risk group vaccination)he is as bad as the rest.Sweden has 71 % fully vaccinated 81 % at least 1 dose and Tegnell thinks and hopes they can reach 90%..Why? In a population probably many already immune for a vaccine witht about 300 deaths and 4000 serious side effects for a pandemic shown above, only for the elderly.Sweden’s data just shows the madness of mass vaccination and MSM in Sweden completely surpress anything negative about vaccines.
I just read one source that said that 59 percent of eligible adults in Sweden were fully vaccinated (compared to about 54 percent of Americans). But, yes, I’m sure the same groups pushing mandatory vaccines for everyone in other countries, are doing the same in Sweden.
I do think Sweden had higher levels of natural immunity than other countries. This might explain why the Delta Variant seems to have spared Sweden (at least relative to the spikes in other nations).
The current data seems much higher
https://omni.se/tegnell-tror-vi-kan-na-90-procents-vaccintackning/a/ALE2O5
In Swedish but in google translate you can see the current very high figures (still lower than 75% in Spain)
But…but …. also take into account the unshown analysis in that table : that death from Covid remains a rare event, even using dodgy government definitions.
I should think for most people anything can be proved by finagling with the figures (“Lies, d****d lies and statistics”). Certainly the raw data should be made available in the public domain, but it will take trustworthy expertise to interpret it.
This is just the effect of current twist in propaganda that infections among vaccinated are “rare breakthrough” and that there is a “pandemic of the unvaccinated”.
This of course causes vaccinated people to behave recklessly – or shall we say, normally – thinking that they are model citizens and well-protected.
I believe this is very much intended – because it’s apparent to decision makers that the vaccines don’t have such a great impact (although certainly bigger impact than any other of the fake and unenforceable measures), and also at the same time that there is no real crisis happening. So in the end, like with every other pandemic, it runs its natural course in which everyone needs to gets infected at some time by which (unlike from “vaccines”) real immunity develops in the population.
That’s also why vaccinated individuals are no longer tested. And that’s why recovered people are treated the same as vaccinated, but unvaccinated are discriminated against (which encourages the unvaccinated to become infected as a route to “freedom”, a striking example of what would be a total failure in public health policy for a dangerous disease).
Of course, they still need to “sell” to the public all the already produced (and future) vaccines, hence the official line still remains that vaccines are miracle drugs, vaccine passports are needed etc. etc.
As with previous articles on this, what’s not considered (at least whether persons hospitalised or who die are vulnerable with co-morbidities and who die with not of COVID) is still the ethnic and life background of the individuals:
Many of thes lifetime factors will also have an impact on how they live today – their housing, jobs/income, diet, fitness, whether they consume alcohol, smoke, take drugs etc and the quantity, how they lead their lives generally.
Unlike the idiot sections of the MSM who ascribe this all to ‘racism’, it’ amazing how immigrants say from the Sikh, Hindu and Far Eastern communities living in the UK, especially second gen people, fair far better than those of other equivalent ethnic/cultural backgrounds from abroad.
Hmmm.
Re. 1, there has been a bit of quiet adjustment to recommended values of supplements to use during the Autumn & Winter, due to the reduced exposure to ultra violet B light. All sorts of other lifestyle issues, but it’s still a problem for those of us with white skin at our latitude.
Is this case discrepancy perhaps in part due to those not vaccinated are probably not as concerned by the virus, so much less likely to get tested if they have flu-like symptoms or the sniffles? Also, shouldn’t the analysis breakdown single jab vs. double jab? E.g. hospitalisations with covid-like symptoms AND single jab could be due to side effects or just “normal” reaction to the vaccine?
can only speak for myself – but as a still currently unvaxxed I would like to know if any sniffles or flu-like symptoms were due to the Rona – for responsible public health reasons and because this would be potentially serious to my health
[Edit] – i just read Mimis post below – i personally think getting caught in the Covid contact tracing trap is more of consideration wrt random / extended testing of the asymptomatic. If you have symptoms you should perhaps get tested
I hadn’t had a cold in years – since I switched to a low carb diet, I don’t get sick. That came to an end two days after my first Covid vaccine, when I came down with a bad cough and all the other symptoms of the dread Covid. I was sick for a week or so. Tried to report it on the US VAERS system, but that website! My god! I gave up.
I got sick AGAIN in June, down in Florida when the Delta variant was just getting going. Again, my symptoms matched the Delta description.
I didn’t get tested. Don’t want to have my brain stabbed, and certainly I didn’t want my family members to get caught in the contact tracing trap. But it’s interesting (to me, if no one else) that I caught two respiratory illnesses within weeks of getting the shots, after years of perfect health.
I gave blood last week and tested positive for Covid antibodies. For whatever that’s worth.
Oh, and I do regret getting the stupid shot. I thought it would smooth the way for summer travel to Europe. More fool me.
Oh, and my daughter? Age 19 when she got her shots last winter. (Drives an ambulance.) She was so sick after the second one, we seriously considered taking her to the hospital. Vomiting, fever, red face, clammy skin – scary. She’s declined a booster on the grounds that “I don’t want to die.”
That’s just awful, stay strong and healthy.
Your anecdote makes one wonder what percentage of “adverse reactions” are actually being captured via VAERS.
I guess your 19-year-old daughter had to get vaccinated for her job. But healthy 19-year-olds would be the last people that need to get vaccinated. She probably would have chosen to not have all of those non-mild side effects.
Er, they won’t commit the error of making all the data publicly available like this again because people other than the chosen few can analyse it for themselves and get a fuller picture.
This is very much in line with my personal experience. Colleagues and friends all double jabbed have this summer gone down with covid. All fit and healthy and in their 50s. All had a really rotten Covid experience – not hospitalised but taken out for at least a week.
All rushed out to get their tests to confirm what they already knew, spreading their infection around like a bunch of idiots – because well, it’s allowed you know! One even posted on FB telling everyone that if they get sick they MUST get tested. Seriously, WTF?
It does occur to me that they would have suffered far less had they not had the jabs – if they had even got sick at all!
i think if you get sick and it could be Covid then getting tested is appropriate for a number of reasons
https://thewhiterose.uk/msm-lying-about-the-unvaccinated/
I would suggest that in the u50’s it is would appear that hospitalisation could very well be for other issues. It is likely it is in the over 50’s too but more difficult to draw that as a possible conclusion given the numbers and how they have been presented
I believe there is also an issue whereby, after the first jab, susceptibility to severe illness actually rises, due to immune suppression- and the single jabbed are counted as un-jabbed- thus further muddying the water and damning the un-jab statistics.
Any self-respecting statistician would separate out for each possible characteristic age, sex, co- morbidities, single jab, double jab, etc.
But, yet again, it’s the primary function of the numbers to enforce compliance and fear, not to inform.
Good job, well done, with your analysis.
Made me think, would you buy a second hand car from that lot? They are probably not used to appearing in court as witnesses (yet). Some of the truth, but not all of it, oh, and some lies as well, seems to be their attitude. Experienced barristers will take them to the cleaners.
Emergency jabs allowed for the suppression of safe medical treatments – the absurd obsession with proven ineffective and dangerous jabs misses the point – many of the people who actually died from Covid could have been saved with early intervention protocols- see https://www.bitchute.com/video/K431QaWyCdLW/
the deliberate mass murder of people by suppressing these cheap, safe and proven options should be the discussion point – these jabs have no use or role in any ethical landscape- they are not vaccinations in any past sense of the word and they literally shoot people dead either directly or by their suppression of all else – whereby a doctor could be administering an early intervention plan that would actually prevent bad illness and death. What is going on here?
this is a most excellent article. Thankyou. You have clarified some very important statistical issues. However, the overriding issue continues to be the egregious violation of multiple human rights laws, established over millennia by our English Common Law, and more recently by International Laws and Treaties.
So why is it still happening? Because the ‘vaccine’ is NOT a vaccine!
The only reason the ‘vaccinated’ are getting uppity is because they know they’ve been duped and their jab can never be undone.
They get angry with me because I chose not to get jabbed and will live to see the horrible consequences of this jab.
Anything of value is worth the due diligence. My body is VALUABLE
In all these studies they never disclose the proportions of those vaccinated versus unvaccinated in the original test sample BEFORE obtaining positive or negative results.
This is crucial data. Let’s say they sample 100,000 people. If 90,000 of those samples are unvaccinated and 10,000 vaccinated there is going to be a huge distortion in the statistics.
They never state that they tested x number of vaccinated people to get y number of positives in vaccinated people and x number of unvaccinated people to get y number of positives in unvaccinated people. y/x for vaccinated versus y/x unvaccinated is all important here but they only look at y vaccinated versus y unvaccinated.
There is good reason to suspect this is the case, vaccinated patients are not being routinely tested as are unvaccinated patients. Therefore, with a PCR test of 40 cycles and above yielding a 97% false positive rate, there will be far more unvaccinated in the original sample. We need the real denominators.
Schools, universities, and many businesses are adopting the same policies – frequent testing of the unvaccinated and NO testing of the vaccinated. It’s cooking the books and most people don’t realize that.
Most heinous of all, they are also counting vaccinated people who get ill within 14 days as unvaccinated. Those vaccinated admitted to hospital within that time frame will be tested and, if positive (very likely at 40+ cycles) will be counted as unvaccinated. That is unprecedented fraud. And it won’t get onto MHRA VAERS, etc. More than fraud.
Murder One.
This means there will be far greater numbers of vaccinated people in the intensive care wards who haven’t been tested or have been tested at lower PCR rates. Among these are the ones that die from the “short illness“. But they never show up because all eyes are on delta.
This also explains why the delta seems to be mysteriously more prevalent in the young. It’s fraud.
And if you go chasing rabbits, and you know you’re going to fall
https://bakerstreetrising.home.blog/2021/02/15/covax-through-the-looking-glass-part-4/
When a patient is in Triage are they more likely to be admitted to hospital, as a precaution, if they haven’t been vaccinated?
Good question, I’ve wondered that myself. I feel that the system is designed to find the unvaccinated at fault. However, perhaps in the future the unvaccinated will be denied hospital care… (I’m unvaccinated).
Hospital Care and a whole lot of other stuff. The Triage scenario is a good thought experiment. They cant triage on the basis of vaxxed / unvaxxed so will they simply choose to close the hospitals to the unvaxxed? Which presents its own problems – when theres no unvaxxed staff or patients in the hospital but staff and patients still getting ill with the Rona – some still acquiring it in hospital – maybe they will revisit the thesis?
The NHS has been denying care. My daughter, who has a severe autoimmune condition, has had 15 appointments cancelled in the last 18 months.
Brilliant article. Thank you.
Can someone explain this? In the latest PHE report it was clearly shown that the level of C 19 infection was higher in 40-80 year old and this has been discussed widely. Now we have James Ward(FT often use his graphs and is one of the favourite for vaccine fanatics like Haimes and Balloux.) Ward now says that the table below is correct and that PHE used wrong estimate of unvaccinated people and you should use ONS and not NIMS. I find it baffling that PHE should have used the wrong data and publish it.However can someone in the know clarify this ?
https://twitter.com/JamesWard73/status/1436704007251185670/photo/1
“The PHE data doesn’t tell the full story, in part because you get a very different idea of vaccine effectiveness if you use ONS (not NIMS) to estimate the number of unvaccinated people. See details in thread”
Just contrast this with page 18 in the latest PHE
https://assets.publishing.service.gov.uk/government/uploads/system/uploads/attachment_data/file/1016465/Vaccine_surveillance_report_-_week_36.pdf Who is telling the truth?
How many of the unvaccinated had access to any of the early treatment protocols?