Back in early July I noted that data from the ZOE Covid Symptom Study was showing that new infections in the unvaccinated were peaking and falling while those in the vaccinated were still surging.
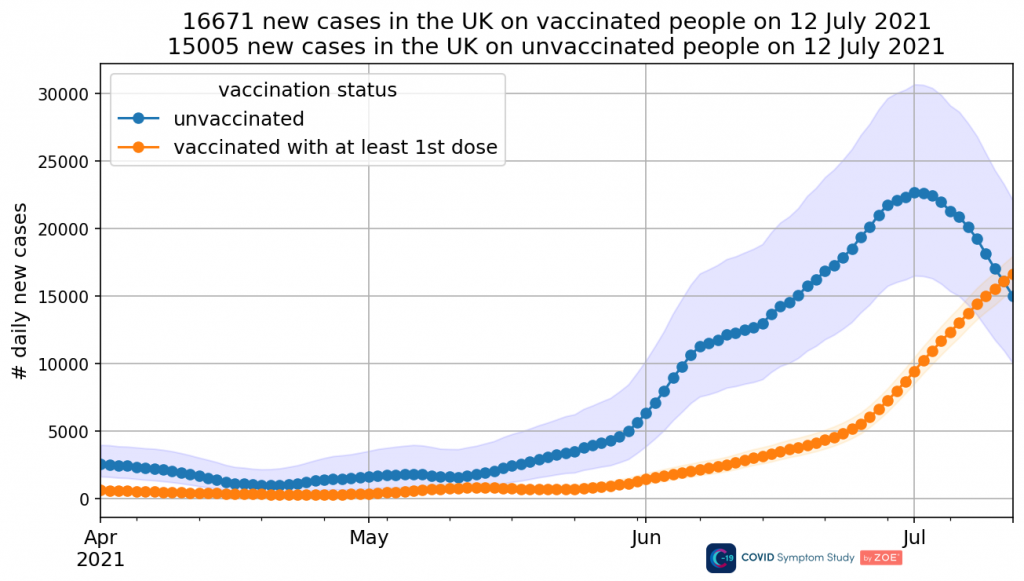
This was not a phenomenon noted elsewhere and prompted questions about whether it showed that the vaccines were delaying infection, or whether it was primarily an age-based phenomenon. Unfortunately, before anyone was able to investigate further, within a couple of weeks ZOE had ‘updated‘ their methodology and in their new data the phenomenon had oddly disappeared.
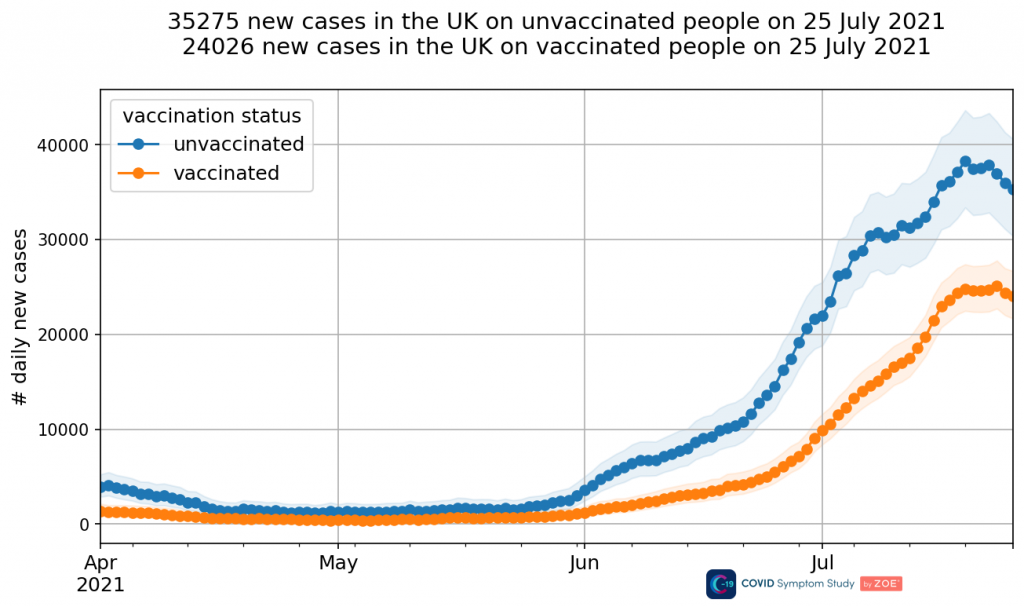
This left questions as to whether it had been entirely an artefact of problems with their previous methodology or whether it had been a real phenomenon.
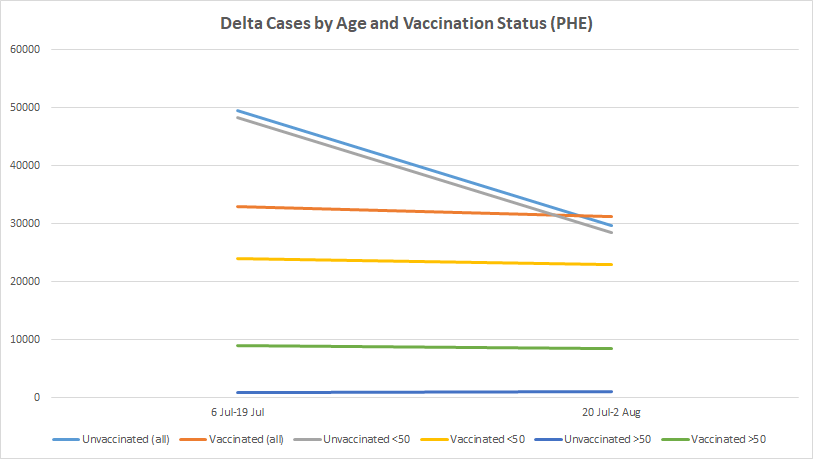
PHE data from the three most recent technical briefings (18, 19 and 20) allow us now to answer this question. Above (top of page) are the Delta case counts for the period July 6th to July 19th and then July 20th to August 2nd, broken down by vaccination status and age. (Actually, it’s not clear whether the initial date is July 6th or another date around then as briefing 18 appears to have a typo and says its data runs up to June 21st, even though briefing 17 also had data up to June 21st and the figures in briefing 18 are higher. However, for the purpose of this analysis it’s not important exactly what the start date is, and I have used July 6th as that is what it would be assuming briefing 18 has the equivalent date to the other briefings.)
The key lines to look at in the chart are the grey and yellow lines. They show that in the under-50s, Delta cases in the unvaccinated dramatically declined between early July and late July whereas those in the vaccinated (at least 21 days after the first dose) were stable. In the second half of the month there were actually more infections in the vaccinated of all ages than in the unvaccinated (the light blue and orange lines).
This was the period when new infections nationwide peaked (on July 17th, by report date) and dropped quickly. This new analysis allows us to see that this fast drop was entirely in the unvaccinated under-50s (presumably the result of reaching herd immunity for the Delta variant). Infections in the vaccinated of all ages (and the unvaccinated over-50s) did not fall at the same time but remained stable. This helps explain why the drop ended around July 28th (by report date) and new infections have currently plateaued. What we are experiencing now is the ‘wave’ of infections largely in the vaccinated (along with the unvaccinated over-50s).
We can’t be sure that the explanation of the phenomenon is that the vaccines delayed infection. Another possibility is that the early surge was in the younger, less vaccinated portion of the under-50s (i.e., people under-30). What we really need is a finer breakdown by age. Unfortunately, despite all the data published during this crisis, very little of it is properly broken down by both vaccination status and age to allow us to do this kind of analysis.
Nonetheless, this confirms that ‘old ZOE’ was right to show infections in the unvaccinated falling during July while those in the vaccinated did not. The fact that ‘new ZOE’ no longer shows this phenomenon once again leads to questions about what changes were made and why, and whether the new methodology is really more reliable, or just more politically acceptable.


Profanity and abuse will be removed and may lead to a permanent ban.