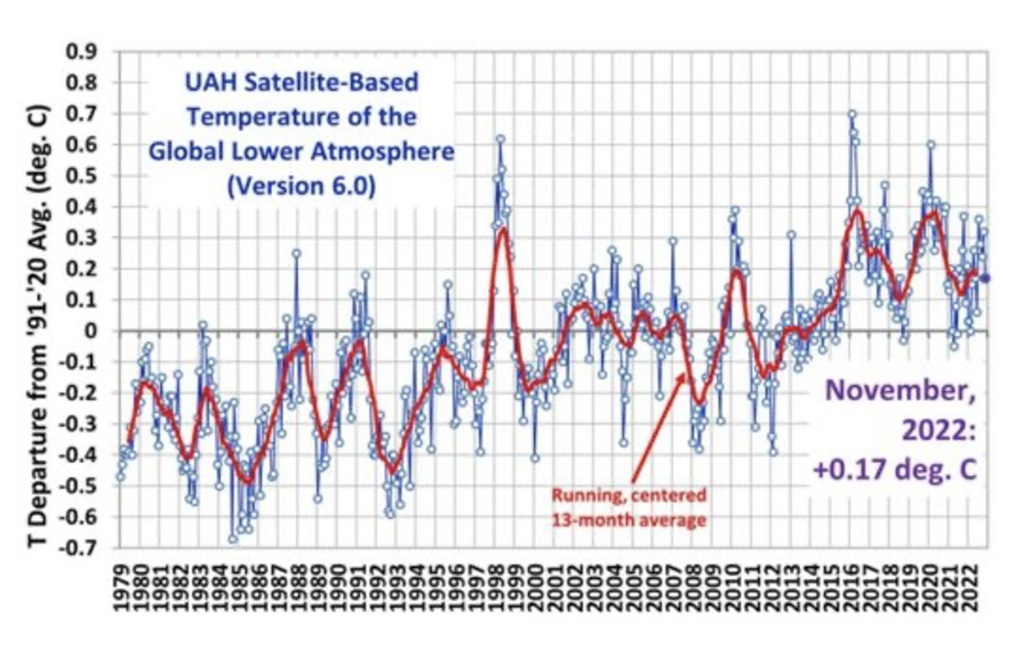
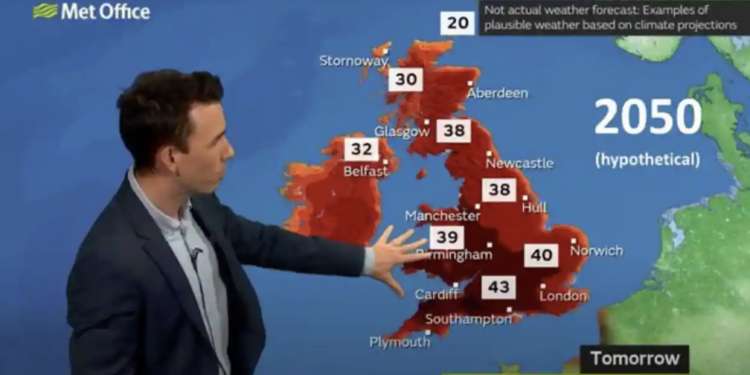
There is great excitement – jubilation even – at the Met Office and its mainstream media publishing partners with the news that the U.K. is on track to record its ‘hottest’ year ever (well at least since records began about 150 years ago). Helped by a mild winter and autumn and a glorious summer, the average temperature in 2022 looks to come in at 9.99°C, up from the previous 2014 record of 9.88°C. But the overall global temperature, according to accurate satellite measurements, has not moved for over eight years. As we shall see, the Met Office increases in surface measurements would appear to owe something to increasing urban heat corruption, as well as some curious sitings of measuring devises.
There is no more curious placing of a measuring devise than half way down the runway of a military airbase that houses two squadrons of Typhoon fighter jets. The Met Office tells us that one of the weather extremes of 2022 was a high of 40.3°C on July 19th. Regular readers will recall that we have questioned this ‘record’ at RAF Coningsby, since the temperature held for only 60 seconds at 3.12pm and was preceded by a 0.6°C jump in the previous two minutes. By 3.13pm the temperature had fallen back to 39.7°C. The Met Office first explained that the sudden rise could have been due to cloud cover, but a satellite photo shows clear skies across Lincolnshire at that moment. The Daily Sceptic has since established that at least two Typhoon jets were operating at the base at the time. The Met Office has ignored all our subsequent questions about the claim.
The Coningsby incident is indicative of possible urban heat corruption over much of the Met Office surface temperature database. Airport sitings are common with temperature highs often reported at Heathrow and nearby RAF Northolt. Temperature recordings at airports are an easy source of data, since accurate measurements alongside runways are required for safe aircraft movements. But similar temperature corruptions are also to be found in towns and cities.
In recent ground-breaking work, two American scientists – Dr. Roy Spencer and Professor John Christy – working out of the University of Alabama in Huntsville, have separated the effect of urbanisation on temperature measurements. They used a satellite database of urbanisation change called ‘Built Up’ and found large corruptions across the urban record. Over the last 50 years, it was discovered that warming had been exaggerated by up to 50% across the eastern United States.
Spencer and Christy also checked out a number of U.S. airports, comparing the raw data from the U.S. weather service NOAA with their ‘de-urbanised’ figures. At Orlando International Airport in Florida, the NOAA data showed massive warming of 0.3°C per decade, but this fell to just 0.07°C when adjusted for urban heat. The two scientists have supplied similar findings for Canada and promise further country work in the future including the U.K.
In the U.S., NOAA’s surface data has been criticised on a number of scientific fronts. The American meteorologist Anthony Watts recently published a 10-year study calling the database “fatally flawed”. He found that 96% of U.S. temperature stations failed to meet what NOAA itself considered to be acceptable and uncorrupted placement standards. The findings must be a major concern since the U.S. record is a large constituent of global databases, including one run by the Met Office called HadCRUT. These global databases have been adjusted to show more recent global warming, a trend that is not immediately obvious in satellite or meteorological balloon records.
In light of this recent urban heat evidence, the Daily Sceptic has asked the Met Office if it intends to continue using raw data from airport and urban sites without making substantial recalculations to remove all non-climatic corruptions? As we have noted, the Met Office has failed to respond. But urban heat corruption must be a major consideration when analysing this heavily-quoted data. In the year of the hot summer of 1976, the average annual temperature was 8.74°C, compared with this year’s 9.99°C. But only 56 million people lived in the U.K. around 50 years ago compared with almost 69 million today. Over the last 50 years there has been considerable urban development, and many towns and cities have increased significantly in size and density.
It is reasonable to ask if average Met Office temperatures rising well over 1°C during this period solely reflect natural increases, or is around 50% of the warming a temporary feature of urban development? One day, the Met Office might tell us. Since 1979, the satellite record has shown warming across the globe of around 0.6°C. Temperatures have still to pass the last high point in 1998.

In the meantime, it is full speed ahead with weather catastrophisation stories designed to promote the Net Zero political agenda. In the latest bout of climate Armageddon preaching, the BBC subbed up the Met Office press release and listed this year’s “extreme” events. Obviously, the Coningsby triumph was mentioned (see above), but so was the mild autumn. Also “extreme” was the brief winter cold snap in early December (nobody saw that coming, did they?) and three storms In February. Depressions often follow one another in the middle of winter off the Atlantic, so why this should be considered “extreme” is a mystery. Tinder-dry conditions are said to have “gripped” the U.K. during August. Again, dry periods in the middle of summer – it’s almost beyond understanding.
Chris Morrison is the Daily Sceptic’s Environment Editor.
Stop Press: Tom Slater has written a good piece for Spiked on the rise of the eco-cult.


To join in with the discussion please make a donation to The Daily Sceptic.
Profanity and abuse will be removed and may lead to a permanent ban.
They have meteorologist “Jim Dale” on Talk Radio who is making it his mission to convert “climate deniers” in 202. He was celebrating the “hottest” UK year ever.
How do these people still use infantile terms like “denier”? This is not the language of science, and actually in science (if that is what it is supposed to be about) you are meant to question everything. It is not a question of US and THEM, but that is how it has turned out with those in the climate gang all agreeing with each other no matter how absurd the claim might be. You can imagine that if we had a spoof article about pigs farting a tone higher because of global warming they would all be queuing up to verbally abuse all the “denialists” who “knew nothing about pigs”
I think they’re too stupid to think of a better line of attack. A well known gravity denier had something to say about stupidity.
Evil, not stupid. They know what they are at.
When you can’t rubbish the message, rubbish the messenger.
They know all the evidence from observation refutes their claims, they know all their predictions have been wrong, so they cannot debate the subject and instead divert attention by vilifying and discrediting the opposition and make it about them not the actual subject.
It is important to remember that NASA-GISS’s Jim Hansen, one of the so-called “scientists” who kicked off the Glowbull Warming scam in 1988, was the guy who popularised the “Denier” label. He subsequently resigned a few years later (possibly with boot-print on posterior) to become a “full-time activist”. Same job, but no longer paid by NASA.
He liked the term because perhaps his most important opponent in pointing out the “Anthropogenic” claim was (and still is) Richard S. Lindzen, Professor Emeritus of Atmospheric Sciences, MIT, who is Jewish.
Note that Hansen also coined and repeatedly used the terms “Death Factories” (coal power plants) and “Death Trains” (coal trains), in case anyone missed the allusion.
For anyone who is confused by claims allegedly based on Atmospheric Physics and Chemistry (more accurately, on incompetent computer modelling), I suggest that those who refuse to debate, ‘cancel’ those who disagree with their models ind inconvenient facts, promote “solutions” that blatantly don’t work (whirligigs, moonbeam catchers) and who are very handsomely paid by Governments and virtue signalling Billionaires, those are the ones to treat with scepticism.
Wasn’t Jim Dale in Carry on Lying?
Apologies, I replied to Bill with the same comment without reading down the page far enough to see your earlier answer.
Presumably not the Jim Dale from the Carry on Films? Although, much to my surprise he does appear to still be alive.
Surely the hottest the UK has ever been was back in the mists of time, when the world was young and the area which was set to become the UK was a sea of molten lava? We’ve still got a way to go before we reach that point again.
They have already decided what they want to find, so they go evidence hunting (you might even say evidence planting in the case of RAF Coningsby) in order to find it. This is not science, it’s a cult.
Policy-based evidence-making, just like covid.
Slight corrections – due to convid.
If I may… further correction, due to ‘virus making’.
Does the met office (they are not worthy of capital letters) calculate its temperatures from the highest temperatures recorded anywhere on a given day?
When I did physics at school and university we were taught to take a series of readings of a slowly changing variable over time, discard the extremes and average the rest, or to graph them and even out anomalous readings by curve smoothing.
I take it that “The Science” uses its instantaneous reading digital devices to avoid this requirement.
This does however mean that it is not scientifically legitimate to compare modern instantaneous readings of today with more conventionally collected data from the past.
But when has scientific legitimacy ever come into modern propaganda.
Science is no longer taught in schools and (so-called) university – they are now courses in white supremacy, colonialism and racism.
But temperature in one location has no relationship to temperature in another.
If I increase my daily living room temperature by 2C, it doesn’t change the temperature in one of Charlie 3’s spare bedrooms.
Climate is a derivation not a datum. It is an average of met data over a long time. Most sensible people say it can only properly be considered on time scales of thousands or tens of thousands of years.
So 50% of the data are above, 50% below the average. And as we know, averages – average man, average child, average street – don’t exist.
Picking one datum and presenting it as representative of all the data is the work of the charlatan and liar.
We have this clutter of sparse thermometer readings from across the globe, which in reality have been mostly in wealthy western countries, where the data is taken and adjusted (manipulated) and where there happen to be no thermometers, which is most of the world, and NONE in the oceans, the temperature is simply guessed at. From this total dog’s breakfast of manipulated data, we are led to believe that some bunch of government funded data adjusters know which year was warmer than some other year often by hundredths of a degree and they also know that it was humans that warmed it. But these thermometers dogged by accuracy problems that may have started in an empty field and 100 years later are surrounded by buildings and heat sources were never designed to measure to these kinds of accuracies and the error bars will mostly be larger than the temperature claimed. We can also see that since temperatures around the world are hardly rising at all despite more and more CO2 going into the atmosphere, that there was this shift to declare “hottest years”, as for most of the public this will lead them to assume that humans are indeed warming up the planet, when infact for 20 years warming has been negligible. Or as we saw in one of the Climategate emails that embarrassed the climate con artists “We cannot account for the lack of warming”. Or also as a more honest lead author at the IPCC admitted. “There must be something wrong with our models, as a 20 year pause in global warming does not occur in any of them” —–Well you won’t hear any of that on the BBC, will you? Plus, in all of these alarmist claims there is the ever-present bogey man of ECS (Equilibrium Climate Sensitivity)—–The number that tells us whether there will be mild warming or serious warming. —–The number is still UNKNOWN, and alarmists simply assume in their models that ECS is a large number, which kind of explains why their models are always WRONG.
And on Antarctica – the biggest & coldest continent – save for a few weather stations on the (warmer) West Coast, temperatures for the continent are confidently ‘calculated’ and… surprise, surprise… show warming at a faster rate than elsewhere.
The large and cold Siberian area where numerous weather stations provided data for the global temperature record, stopped repirting with the fall of the USSR. The drop out of this significant cooling data was ‘corrected for’ using an algorithm.
Another corker is the ‘hottest Surrey village, Charlwood’ which the BBC failed to mention is a mile downwind of the biggest area of tarmac, concrete, buildings and taxiing jets in the South East, GATWICK AIRPORT. How can ‘journalists’ be so thick as to not question this BS! Of course if you keep following the trail of disinformation and propaganda you finally get to China, which wants to see the stupid West bankrupt itself chasing rainbows.
What’s the point in repeat-spreading the official clima lies? At end of August, meteoroliars predicted that it would remain dry for months to come due to climate breakdown. A week later, it started raining in perpetuity until even the last holdouts at Thames Water were forced to admit that rainfall in autumn was above average. Two weeks ago, we were in the middle of an unusual spell of cold weather which saw temperatures in Germany fall to -20 degrees C in some places and also brought unusually cold temperatures to the UK. This glorious summer consisted of exactly five weeks without rain and a hot and a pretty warm day. That’s far short of 2018 were it was intolerably hot (I remember getting headaches because of this) for a prolonged period of time.
Averaging temperature readings from different locations is still meaningless nonsense. The mathematical method of averaging distributes hotspot temperatures evenly over the UK despite the fact that 40dg C on some airport in the south mean absolutely nothing for temperatures in the Scottish Highlands. Averages are also liable to serious distortion by outliers, eg, the 40 dg C temperature. Because of this, a procedure employed by people who seriousy work with data is to drop obvious outliers before averaging. Lastly, variations of some datum mean nothing if they’re not at least outside of the usual variance, ie, larger than the standard deviation. The Müll Office doesn’t publish that. How strange.
Arguing about this with meteoroliars is no more sensible than participating in discussions about the correct number of needles which can dance on the head of an angel.
I will be blunt – I lived and worked through the summer of ’76 and that was the hottest summer of my life. The North West was in drought. We were scouring old coal mines for water supplies – I worked for North West Water at the time and the drought lasted the best part of three months. So I don’t need any useless meteorologists to talk BS about how hot this summer was. We had a few hot days, that was it.
Re-writing history to go with the climate con doesn’t wash.
But was it hotter than during the Medieval warm period, a period – widely accepted by scientists – of higher temperatures than presently?
And if not what was causing the global warming/climate change then?
Haven’t you noticed? Those who push the climate lies always rejoice when they are “proved” right.
If anyone needs someone to talk to we meet every Sunday.
Stand in the Park Sundays 10.30am to 11.30am From 1st January 2023
Make friends & keep sane
Elms Field (near Everyman Cinema and play area)
Wokingham RG40 2FE
Like Covid-1984, it’s a hoax
If you want to know how we are being lied to about surface temperatures then read this article:
Urban night lighting observations challenge interpretation of land surface temperature observations | Climate Etc. (judithcurry.com)
I am soooo good at being sceptical, that I think questions remain about the claims of this site of being about keeping people informed.
I mean, of all the possible subjects to be sceptical about, what a coincidence that the favourite punching bag of the Republican Party in the US of A is always the thing that people love being sceptical about. Is it possible that large political donations have anything to do?
Is it possible that the mythical Big Table in Cyberspace is real? You know, the conspiracy theory that there is a Big Table in Cyberspace that contains all the words and all the sentiments associated with all the words and ideas, that regularly gets used by politicians and anybody famous that writes a speech, for the purposes of making whatever speech they have agreed to produce in order to whore themselves to their donors/backers of any sort as attractive as humanly possible to as many people as possible.
I mean, if you program a bot to find new questions to ask, surely it will always, always find new questions. It isn’t as if bots know anything about the real world, right?
In short, is it possible that the whole purpose of this site is to allow rich people to engage in the equivalent of rubbing body parts on people’s faces without having the slightest care whether they consent or not?