

There follows a guest post by the Daily Sceptics’s in-house doctor, formerly a senior medic in the NHS. He’s run his eye over yesterday’s data release from NHS England that has given rise to some panicky headlines (“Frightening new Covid data shows Boris Johnson’s omicron gamble may be about to implode” – The Telegraph). Covid hospital admissions are indeed rising, but a third only have Covid incidentally, i.e. it’s not the reason they were admitted to hospital.
Yesterday afternoon the Primary Diagnosis update was released by the NHS. Readers of this site will be aware the spreadsheet contains information about which patients are being treated for Covid as the primary diagnosis (in other words symptoms sufficiently severe to put them in hospital for a while) and patients testing positive for Covid but being treated for something else.
The NHS concealed this information until they were forced by parliamentary pressure to publish in July 2021.
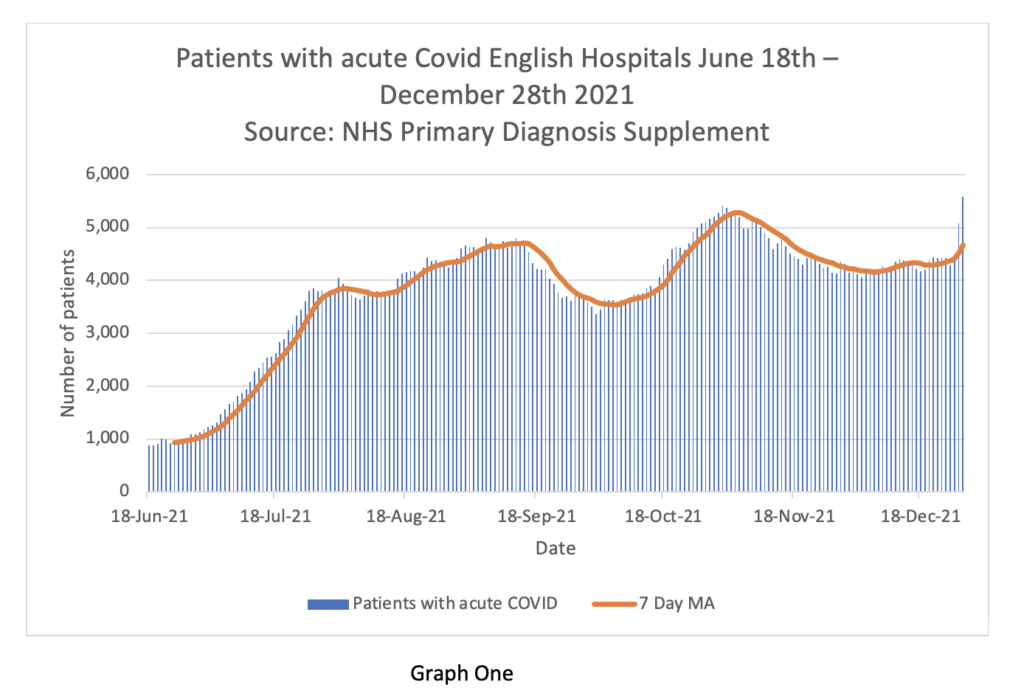
Graph One shows the overall situation in English Hospitals. Daily admissions in blue bars. 7 day moving average on the brown line. Readers will appreciate that the current seven day MA is the same as it was in mid-September and lower than mid-October. It can be seen on the right-hand side of the graph that on December 28th there was a sudden spike in cases. This may be recording artefact due to delay in logging cases over the bank holiday. There may also be some delay in discharging patients over the extended four-day weekend. Or it could be the beginning of a ‘nailed on tsunami of cases’. We will know more next week.
What we can’t tell from this graph is the turnover of patients in hospital. The NHS has this information but will not release it. It’s actually quite important because it gives a better impression of the severity of Omicron vs Delta. For clarity I should say that even if patients are less unwell, a large number of them can still stress the system, but as long as the inpatients can be managed through the hospital phase in an efficient manner and the numbers going out keep pace with the numbers coming in, the problem is manageable. The real difficulty with high turnover is the intensity of the workload on staff to keep up with the pace, and clearly there is also a problem with staff absence due to positive testing.
Graph Two is complicated but important. It shows the acute Covid cases on the blue bars, the incidental cases in the yellow bars and the ratio between the two on the gray line. Readers will see that the blue bars go up on the right-hand side, but the yellow bars go up a lot more. This means there are proportionately more ‘incidental’ cases than ‘real’ cases and the ratio (gray line) is dropping to 0.67. So, when the BBC report the number of Covid cases in hospital, only two thirds of that number are ill with Covid.
Again, for clarity, one should not assume that lots of patients with incidental Covid are not problematic. They do create a problem because of so called ‘cohorting’ – essentially positive patients need to be separated from negative patients and nursed separately. This creates difficulties in allocating specialist nurses and staffing rotas if the patients have to be located in different wards to where they otherwise would be. It also causes trouble for scheduling operations in respect of extra precautions being taken for positive patients and so on – so it generally increases organisation ‘friction’ and reduces efficiency.
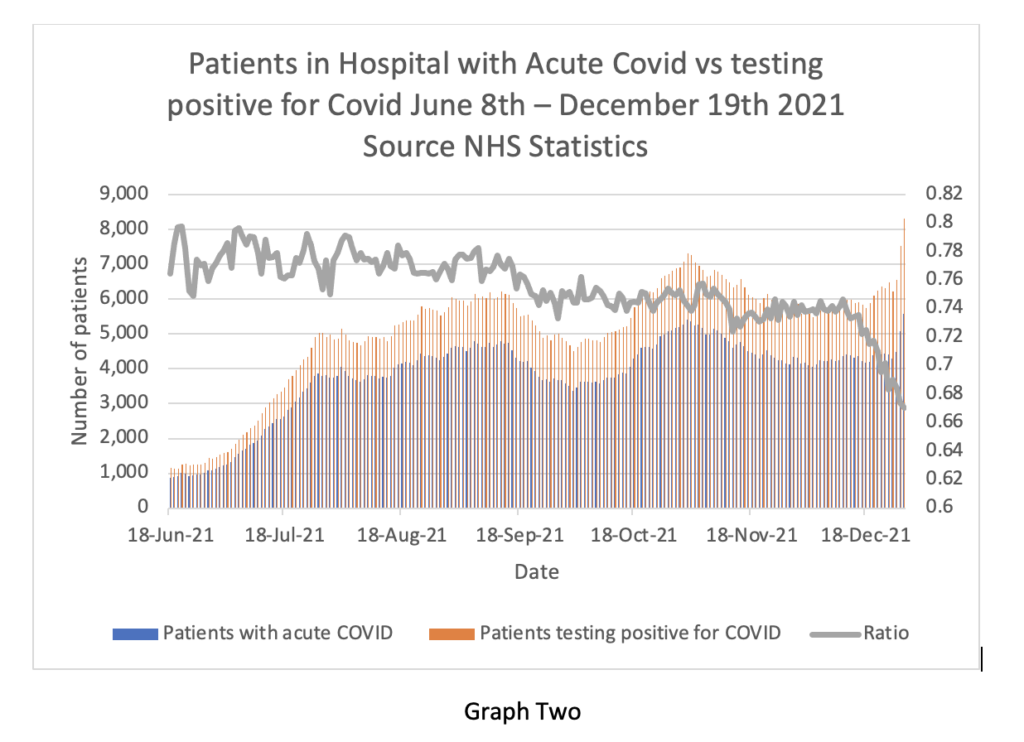
Overall, the falling ratio of incidental to real cases reflects the transmissibility of the new variant. It seems to me that eventually everyone is going to get this virus one way or another. On the other hand, the symptoms it causes do genuinely seem to be mild in comparison to previous variants.
Experts in the media are commenting that the NHS is concerned about the risk of being overwhelmed by a surge of older people being admitted next week. The ZOE app data does show a rise in cases in the 55-75 age group in the last few days. Whether that translates into more severe admissions is difficult to say – the NHS do release information about age group admissions, but the next packet is not due until mid-January.
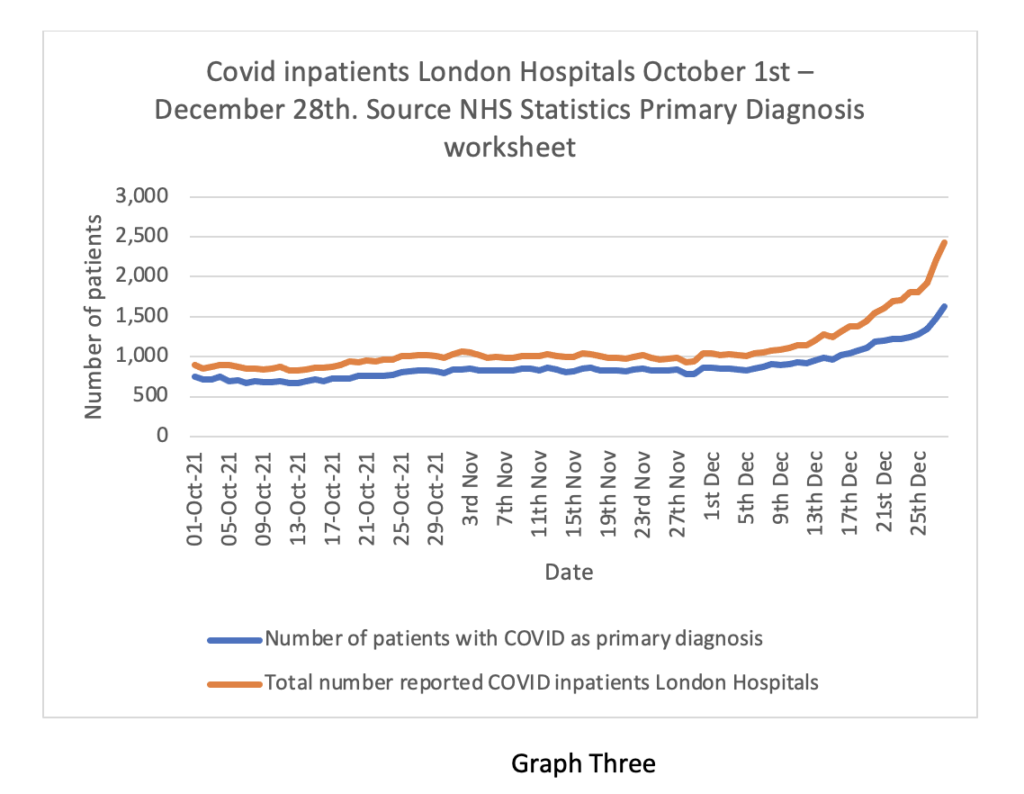
Finally Graph Three shows the data for London, the leading edge of the Omicron wave. Again, the blue line (acute admissions) is going up, but not as fast as the brown line. The doubling time of acute hospital cases is 28 days – this is quite clearly very much slower than the doubling time of positive community tests (about three days before Christmas).
The ratio between the lines is 0.67, the same as England as a whole. From the weekly hospital summary, also released yesterday, it is clear that not all London hospitals are equally affected. The East and South-East areas are proportionally worse off than the West and Central areas. This may reflect differences in community vaccination rates in parts of the capital
In summary, this information is very revealing. It suggests that the real problem is not vast numbers of very sick people who are likely to die and use up large amounts of NHS resource. Rather there are large numbers of moderately ill people who do require some supportive care in hospital, but an increasing number of incidentally positive patients who create organisational friction as they have to be cared for separately from non-positive patients at a time when a lot of staff have also been sent home with positive tests or contacts.
Whether further social restrictions make a material difference to this situation is a moot point. Some of my colleagues think reimposing a societal lockdown will reduce the peak of the wave and allow hospital management to keep on top of the problem. Others think further lockdowns will serve no purpose and the wave will transmit through the population anyway regardless of euphemistic ‘non pharmaceutical interventions’.
Readers will remember that when societal restrictions were imposed in January of 2021 they were not lifted until July, and even then, there was substantial opposition from the NHS. Finally, in the intensifying clamour for lockdown from the usual quarters, I have not seen any balance in their argument in respect of the collateral damage to health and the obvious quantifiable damage to the economy, businesses and jobs. I wonder why that could be?
Happy New Year everyone.


To join in with the discussion please make a donation to The Daily Sceptic.
Profanity and abuse will be removed and may lead to a permanent ban.