The Omicron variant is known to have a relatively high number of mutations, including in the spike protein, and is therefore better than previous variants at escaping vaccine immunity, especially, and also natural immunity. As a new pre-print study from South Africa explains:
The Omicron variant is characterised by between 26 and 32 mutations in the spike protein many of which are located within the receptor binding domain (RBD). In addition Omicron has three deletions and one insertion in the spike protein, and mutations outside of the spike protein. Many of the mutations are either known or predicted to contribute to escape from neutralising antibodies, and work on earlier variants of concern has demonstrated that such variants can be antigenically very distinct.
The study looks at the reinfection rate in successive waves in South Africa and finds that the recent Omicron surge was characterised by a reinfection risk over twice as high as in the original wave – though it should be noted that this is from a low base, as studies have found natural immunity to confer 85-90% protection from reinfection (pre-Omicron).
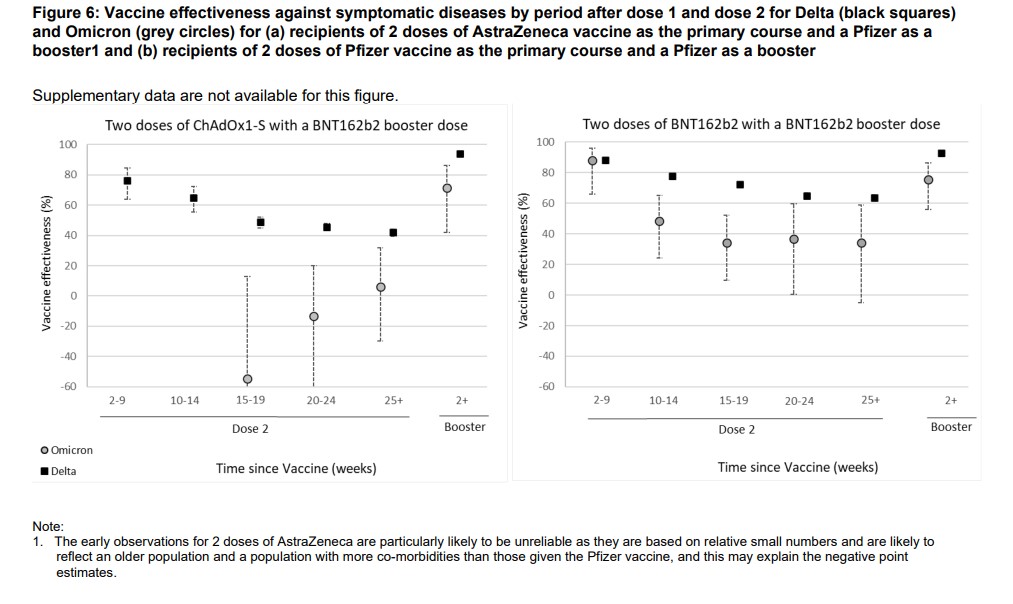
As far as vaccines are concerned, the UKHSA recently acknowledged the weak protection from two doses of the vaccines against Omicron, even publishing a graph showing negative effectiveness for the AstraZeneca vaccine, albeit with very wide confidence intervals.
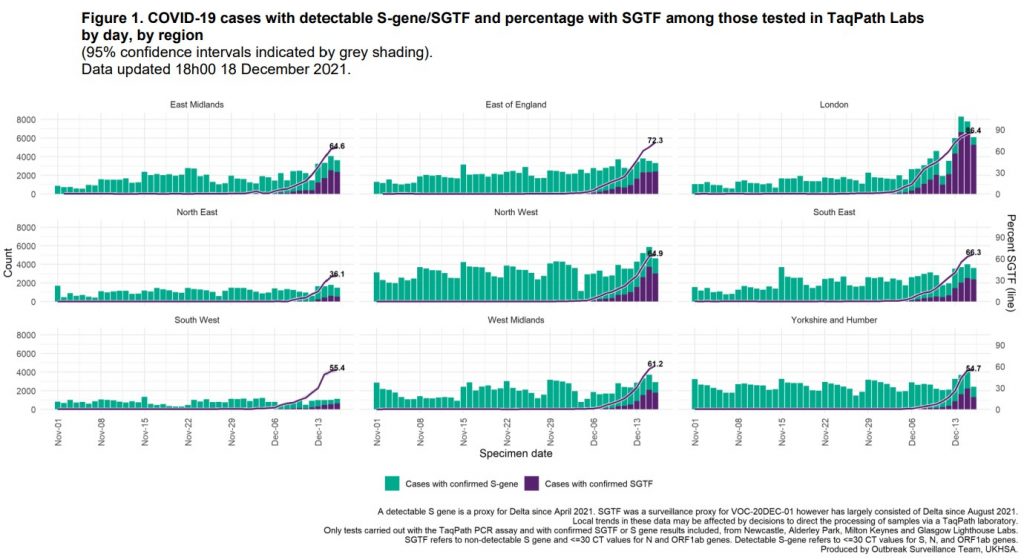
Nonetheless, there is good evidence that previous infection will continue to provide robust protection against the variant, albeit at a slightly reduced level. Further evidence of this enduring protection comes in the UKHSA’s latest daily Omicron report from December 19th. It shows that Omicron is partially replacing Delta to different degrees in different regions, suggesting the two variants are largely competing for the same pool of susceptible people.
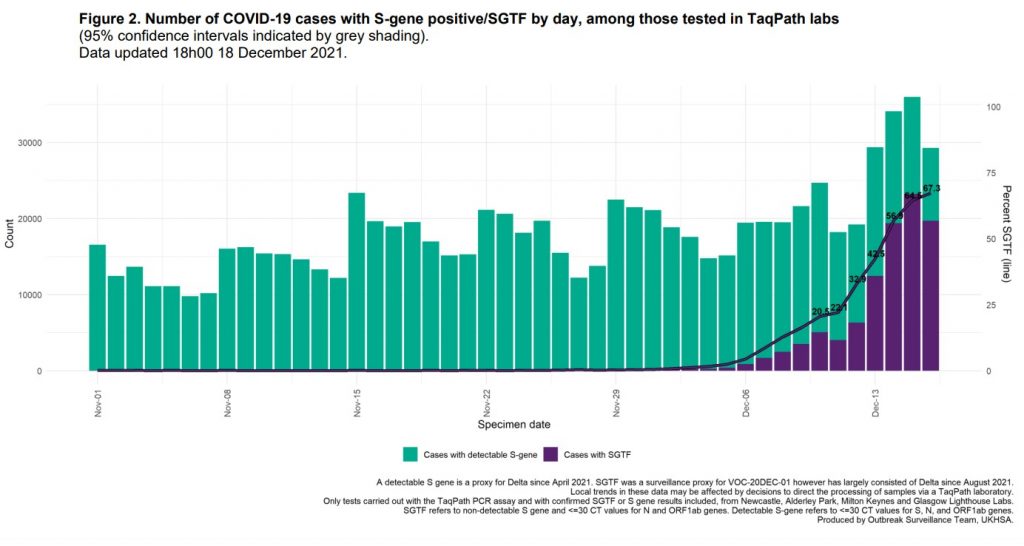
The purple lines in the charts above show the daily change in the proportion of PCR-positive samples with S-gene dropouts in low-Ct PCR positives, which are interpreted as Omicron. What’s interesting about these charts is that almost all of them show a flattening in the rate of increase of the Omicron proportion in each region in the last few days, but they are plateauing at different levels. London is flattening around 86% whereas the South West is flattening around 36%, and the rest are somewhere in between. Nationally, the Omicron proportion has begun to flatten around 67% (see below). Note while the overall number of positives (the height of the bars) for recent days may change as more test results come in, the proportions are unlikely to change much as there is no particular reason why delayed positives are more or less likely to be Omicron. Also, note that while overall reported infection numbers have spiked since December 13th, so far this appears to be mostly due to increased testing and there’s little sign yet of a similar spike in test positivity.
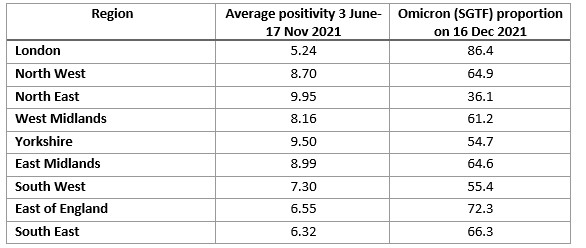
Why might the Omicron proportions be levelling off well below 100%, and at different levels in different regions? London has been the least affected by the Delta wave – it had average positivity of 5.2% between June 3rd and November 17th, compared to 9.5% in Yorkshire and the Humber – and so may be more susceptible to Omicron because of lower population immunity from over the summer and autumn. Here are those figures for each region.
Is there a relationship between how strongly a region was affected by Delta and how susceptible it is to Omicron? Here’s the data in the above table plotted on a chart.

That’s a strong negative correlation, meaning the more Delta a region had, the lower the level of the Omicron (SGTF) proportion plateau. Does this help to answer the question of why the regions are flattening out at different levels?
Regions harder hit by Delta are, by definition, more susceptible to Delta (for reasons such as being less hard hit in earlier waves). So it makes sense that, now that Omicron is on the scene, the regions where Delta has been making more of an impact are finding Delta is better able to compete with Omicron and hold onto more of its market share. In places where Delta has struggled more, such as London, Omicron faces less competition from it and so can grab a bigger market share and push it out faster.
It’s true that you might expect regions hard-hit by Delta to have built up a decent amount of herd immunity to the variant by now. But for whatever reason the Delta outbreak has continued at a relatively low for six months (at different levels in different regions) and hasn’t shown signs of fading out, so evidently some susceptibility remains. The suggestion here is that it is the differing susceptibility by region that is key in determining how well Delta can compete with Omicron and so how much Delta can stay in the race. A number of countries last winter had a winter wave that was a mixture of different variants, and it appears that the U.K.’s winter wave may be a Delta-Omicron mix this year.
The broader point is that the fact that Omicron is not able to push Delta out completely, at least not yet, combined with the as-yet muted spike in positivity, is further evidence that natural immunity is holding Omicron off to a similar degree to Delta. If it wasn’t we would expect to see Omicron taking over everywhere and causing a big surge in overall positivity to boot.
Last year, countries around the world including the U.K. saw reported infections peaking and falling almost in unison in early January. Later analysis from Imperial College London using antibody testing showed that U.K. infections peaked in Christmas week. Winter flu waves often follow a similar pattern. One possibility is that it is the run-up to and celebration of Christmas itself that accelerates the surge to herd immunity (and beyond), which then abruptly peaks and falls once the festivities are over. This means we may see a similar phenomenon this year; one to watch out for.






To join in with the discussion please make a donation to The Daily Sceptic.
Profanity and abuse will be removed and may lead to a permanent ban.