
Back in March, the ONS published a chart showing age-adjusted excess mortality since the start of 2020. This chart provides the best guide to the pandemic’s impact on deaths, for reasons I’ve explained before.
In short, it’s based on all-cause deaths, rather than ‘official’ Covid deaths, so it gets around the problem of deciding whether people who died of Covid would have died anyway. In addition, it’s based on age-standardised rates, meaning that it takes into account the changing age-structure of the population.
However, the ONS’s chart stops in February, so it’s a little out of date. Here I’ve produced a similar chart for England that goes all the way up to September of 2021:
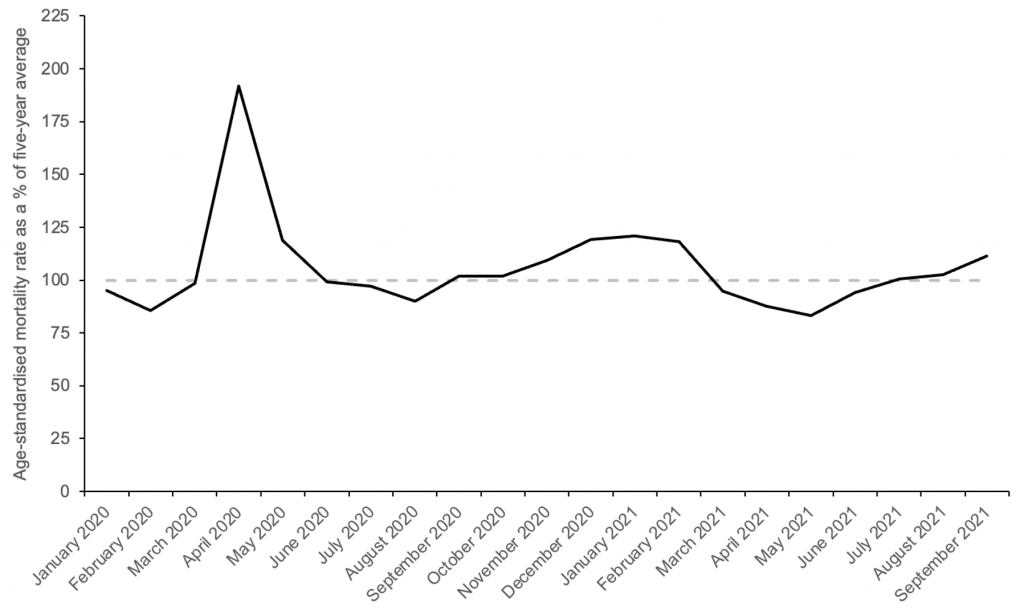
Note: my chart looks slightly different from the ONS’s version because theirs is based on weekly data, whereas mine is based on monthly data. But the overall pattern from January 2020 to February 2021 is basically the same.
Clearly, the pandemic was at its deadliest in April of 2020, when the age-standardised mortality rate reached almost 200% of the five-year average. Since then, it has gone above and below the expected value of 100%. Note that the winter peak in January was only 21% higher than the five-year average.
If we take the average value since the start of 2020, it comes out as 5.8%. This is consistent with a recent ONS analysis, which reported an almost identical figure for the relative cumulative age-standardised mortality rate up to July. (The corresponding figure for Wales was only 3.5%.)
Interestingly, the average since the end of the first wave is less than 2%, meaning the pandemic hasn’t caused very many deaths over the past 15 months. This probably owes to a combination of factors: better treatments; better shielding of vulnerable populations; the vaccination program, and the gradual build-up of natural immunity.
Excessive focus on ‘official’ death numbers has led to a distorted picture of the pandemic’s impact on mortality – both in terms of the total increase and the distribution over time. Tracking age-adjusted excess mortality provides a much-needed corrective.


To join in with the discussion please make a donation to The Daily Sceptic.
Profanity and abuse will be removed and may lead to a permanent ban.
As we say in the pickle trade
‘Lets go Branston’
Very good Cecil.
I have no idea what either of you are talking about, but…nice one, Cyril!
What a cool trio we are
You haven’t seen the YouTube video of a crowd being reported as shouting “let’s go Brandon”, whilst a sports person called Brandon was being interviewed live on TV? This was invented by the interviewer to cover up what was really being shouted, telling what Biden (POTUS) should do.
Just to recap..the crowd were shouting ‘fu** Joe Biden’ at a NASCAR race meeting..the poor reporter who was interviewing Brandon Brown said words to the effect of, oh they’re shouting ‘let’s go Brandon!’ LOL
watch this….you’ll be humming it for ages!!
https://rumble.com/vnxsm5-lets-go-brandon-rapper-loza-alexanders-meme-inspired-tiktok-song-goes-viral.html
To summarise:
Is the above fair?
Fair summary. Can anyone spot the real issue with the attached graph?
The blue line are patients coded with respiratory problems.
The red line are SARS-CoV-2 admissions,
the bottom line are ITU admissions with SARS-CoV-2.
The data from the red line was reported as the number of CoViD19 patients in hospital.
No problems with that you may say.
Coding of patients is completed post discharge by a specialist team where the codes are added to the notes for the day of discharge, these codes are as defined in the International Codes for Disease (ICD), in 2020 this was issue 10. Issue 11 was published very late last year or early this and includes codes for CoViD19, ICD 10 did not have these codes. This is significant.
SARS-CoV-2 stands for Serious Acute Respiratory Syndrome CoronaVirus 2
CoViD19 stands for Coronavirus Disease 19.
Looking at the blue line it drops below the red line a few weeks before the red line peaks.
If the red line represents CoViD19 patients as reported then the blue line cannot cross the red line under any circumstances, as all real CoViD19 patients at that time would have to have respiratory conditions.
Good catch. The only thing is, this cross over cuts through the period when hospital beds were emptied en masse and the care homes flooded with patients, who really should have been in hospital. The vast majority of deaths were in care homes.
Absolutely, if the excess deaths graph is superimposed then it too has a peak in phase with the red line.
To a point…
but…. We will never know what the death toll might have been if there had not been a suppression of treatment of the obviously sick.
I base this on a post by Dr Malcolm Kendrick who, very early in the outbreak, requested HCQ from the commissioning board to treat patients in his care but this was refused.
Couple this with the official advice to people with symptoms to self isolate at home and don’t bother the nice doctors unless your lips turn blue and the reality was that there was no attempt to treat people, and the pretence was that ‘first do no harm’ was achieved by doing precisely nothing. Some might say that we have continued ‘doing nothing’ of any value with the failed mRNA gene therapies while completely abandoning the concept of doing no harm.
No. The large number of deaths (the 1st wave) was without doubt due to the administration of Midazolam in the “care” homes. Wancock is on record agreeing with his colleague that their effective murder was “a good death”.
2 years worth of Midazolam prescribed in 2 months by care homes with staffing budgets inflated by millions of pounds. Wayne Smith paid with his life for this information.
Why not also mention the Elephant in the room, the “Dry Tinder Effect”?
The first wave took out many of the very frail and terminally ill. The initial mRNA shots took out the very frail. (At least we tried to help them) These effects can be seen in the undershoot on the graphs following a wave. Also the VE is subsequently improved as the frail population has been depleted.
PCR test is mostly used at too high a cycle level to have any accuracy and was only ever intended to be a tool to assist diagnosis and not for diagnosis by itself. CDC is moving to “a multiplexed method that can facilitate detection and differentiation of SARS-CoV-2 and influenza viruses” and will stop using PCR from 1st Jan 2022.
https://www.cdc.gov/csels/dls/locs/2021/07-21-2021-lab-alert-Changes_CDC_RT-PCR_SARS-CoV-2_Testing_1.html
And so likely that large number of people did have flu in last flu season but just the fixation with Covid meant most were incorrectly diagnosed as Covid.
In September 2020 it was said (by the NHS?) that from thenceforth ‘covid’ and flu figures would be conflated. It was said quite openly, yet people kept on parroting the ”flu’s disappeared” slogan.
That 3rd week June 2020 when all cause mortality was less than normal (London first then spreading nationwide) still stands out.
At that point bozo and chums could have declared victory over Covid, we could all go back to work and he would have become a National Treasure.
After that? A chart shows annual figures varying around an average. Having achieved a Pass at ‘0’ Level Economics this is not unusual.
One contributor here claimed that such-and-such a percentage variation from an average was obviously “non-trivial”. Goodness knows how he could tell that without knowing anything about the spread in the data from which the average was calculated. It seems that many people are “experts” nowadays in thinking up bullsh** reasons to support whatever rubbish they fervently believe because they’re too cowardly to question those who told them.
Also if I remember correctly, this is the same time period when team Sweden were starting to look like they’d taken the right path.
Or maybe like SARS-CoV-1 it wasn’t as contagious & deadly as prophesized. They tried hard to generate panic over the first SARS “pandemic” but failed. They learned from that experience by changing the definition of pandemic, like they did the definition of a covid death! With rather than of.
Obviously when a new virus first infects a population it is at its most deadly, it then quickly recedes to become less virulent. Nothing new here, I don’t think, shielding, vaccines or even new treatment had a big effect, not putting people on ventilators may have helped reduce fatality however.
“Obviously when a new virus first infects a population it is at its most deadly, it then quickly recedes to become less virulent.”
Not always so, I’m afraid. See the two waves of the influenza A pandemic in 1918.
I never said always, never say always in nature!
It’s like saying isolation (lockdowns) don’t work, evidently isolation does protect from infection. Its well documented that isolated populations (Amazon, Andaman islands races) that have never been exposed to an otherwise mild common infectious disease, can be wiped out from an infected visitor.
Not that I disagree with your basic point, but lockdowns are very different from isolation. There are many reasons why, in a complex modern society, attempts at simulating isolation will always fall massively short and will also have all kinds of contradictory effects.
And of course there’s the famous Antarctic colds case.
Actually there’s a hypothesis that there were two respiratory infections around in 1918 itself, with H1N1 being the main pandemic between 1918-1920. There are multiple variations that are expressed by the H and N antigens, hence H1N1 or H2N3 etc. What appears to happen is that one strain dominates, hence the need to change the vaccine annually, based on an educated guess from WHO.
The ‘second wave’ of Spanish flu which SAGE and the politicians were so convinced would be repeated by Covid19 has been widely reported as being something entirely different.
Ed. Oops, wot John just said.
The second wave of the 1918 pandemic is considered by some “experts” to have been something other than the original influenza.
Star, the growing belief is that the 1918 flu became combined with a coinfection, and that the most deadly aspect was due to how the coinfection triggered over-immune response.
After 103 years (and having the H1N1 in captivity thanks to shallow graves in tundra) we still can’t verify exactly why it was was serious.
Same virus? Sure? Most died of bacterial pneumonia, and there was a large amount of over-prescription of the new wonder drug – aspirin!
“Or maybe like SARS-CoV-1 it wasn’t as contagious & deadly as prophesized”
Perhaps because the human population had a fair bit of pre-existing resistance in various forms.
Regardless, the experience of populations that did not panic, and have not suffered mass deaths, such as the Amish, Belarus, etc, suggests your hypothesis is probably correct.
As was known following the Diamond Princess cruse liner event in Italy, February 2020. 3,700 mostly elderly passengers, but including crew, just 770 cases (50% asymptomatic) in a static enclosed environment.
Only 14 dead, all elderly with comorbidities.
They tried to use this as an argument to support lockdown as one was eventually imposed on passengers (not crew) but it’s a red herring as it was implemented late and poorly with passengers still milling about the decks and sharing buffets.
Attached BMJ April 2020.
It seems some people are still pushing the view that the government though a set of hopeless incompetents is nevertheless trying to do their best in difficult circumstances. It is difficult for these people to grasp that the government is working to implement WEF/UN/WHO agendas, that behind the window dressing are primarily focussed on global depopulation.
As you point out, the Diamond Princess event would have given the UK government reason to act sensibly and so not take us down the damaging lockdown route. Tellingly, Johnson and his gang of Big Pharma sell-outs chose to totally ignore it.
No mention here of the massive iatrogenesis in hospitals and nursing homes during the early part of the “pandemic”. I don’t think we would have seen anything like that sharp peak in mortality had it not been for the insane, indeed criminal, reaction.
1) “Covid-19“, the illness tied to the new variant of SARS called “SARSCoV2”, was originally called novel coronavirus-infected pneumonia (NCIP). Its name was changed by the World Health Organisation.
2) One of the main places that people catch pneumonia has long been, and still is, in hospital.
What can we tell from the widespread ignorance of these two basic facts?
Point 2) is something no one will admit to or want to know, after all no one wants to go into a place when they are ill and may finish off worse than when they went in! Norovirus, clostridium difficile, hospital acquired pneumonia etc.
The latter can develop in patients who are bed bound, e.g. orthopaedic patients, or have difficulty in breathing, that’s why there are respiratory physiotherapists.
Noah says ” . . . the Pandemic hasn’t caused very many deaths over the past 15 months . . . because better treatments, better shielding (?), the vaccination program”.
Nope, because Covid had got most of those it was going to get by then and, as you rightly say “the gradual buildup of natural immunity” which the government did everything it could to prevent or slow down.
As of today some school kids will be shot through with what is in fact a form of Bio-Russian-roulette?
Viral Myocarditis results in 2 out of 10 people dead in two years… and 5 out of 10 finished after five years. It’s never mild folks its dead heart muscle.
And for sure we all now know mRNA vaxx induce heart and vascular damage some obviously within weeks some less so…
This is no conspiracy myth at all.
https://twitter.com/LozzaFox/status/1454867509002309635?s=20
Which leads me to conclude TPTB will use the coming hate triggered by grieving parents to focus this anger against the unvaxxed, the continuing thorn in the Covidian cults side.
Winters coming and like CJH I fear it will be something BIG.
https://consentfactory.org/2021/10/31/new-normal-winter-is-coming/
Buckle up.
EXCLUSIVE – 100% of Covid-19 Vaccine Deaths were caused by just 5% of the batches produced according to official Government data
https://theexpose.uk/2021/10/31/100-percent-of-covid-19-vaccine-deaths-caused-by-just-5-percent-of-the-batches-produced/
From Dr Mike Yeadon referring to this article on Telegram:
https://t.me/robinmggroup/377545
This information about different safety profiles of different “lots” (batches of finished product of covid19 vaccines) is completely without precedent.
I’m thinking about it & I don’t yet have clear in my mind what the envelope of plausible / possible explanations are.
But the bottom line is that the majority of lots were associated with good short term safety, few hospitalisations & death (true both for Pfizer & Moderna).
But in both cases, a small number of vaccine lots are associated with incredibly high rates of adverse events including deaths.
How can this possibly happen? Drug manufacturing is performed to exacting standards of control. The ‘active’ agent is made in batches (it cannot be guessed how many doses each batch makes, because no one has ever made commercial scale mRNA products before.
But each batch of what’s called “drug substance” is then used to formulate, fill, pack & label various lots of finished drug product.
Testing methods are developed for all of the manufacturing steps, together with standards for the results to be considered acceptable.
Something happened between drug substance & drug product which resulted in a small number of finished lots for distribution which were destined to kill huge numbers of people.
Possible explanations (not exhaustive):
1. Errors made in the final steps of manufacturing which resulted in certain batches bring reasonably benign & others extraordinarily deadly. I just cannot imagine the kind of mistakes which could produce such radically different clinical profiles. For example, poor handling during shipping & storage prior to administration to people. Problem I have with this is that such handling errors (eg allowing temperate to rise way above limits defined in stability testing) usually result in drug product which doesn’t work properly, as it’s degraded, not in drug product that’s incredible dangerous.
2. At some point in manufacturing, someone or some entity actively modified what was being filled into vials, and it was this which resulted in extreme skew of clinical safety profile.
There has been so much truly awful behaviour of “elites” that I’m simply not willing (as I would have historically) to dismiss the possibility that this has been done on purpose.
What I do know, and this is a test of whether there’s the slightest sign of integrity from these companies as well as the regulatory agencies, is that all use of the affected produce must immediately cease, all batches of drug substance & lots of drug product should cease.
The materials should be recalled to a place of stable storage & an intense analytical investigation initiated.
Unless factors are found which adequately explain the huge differences in clinical adverse event profiles, administration to humans must not restart.
If the manufacturers do not exhibit sufficient control of drug product, the authorisation they hold from various regulatory authorities are utterly voided.
Just when you thought this debacle couldn’t possibly get any worse, it gets much worse.
Expect to hear more about this.
Meanwhile, who in their right mind would roll up their sleeve?
Note, I have no information on the other vaccines or other territories not covered by this analysis of VAERS.
Best wishes
Mike
Dr Mike Yeadon
I remember when one of the plans under consideration by the US and its satellite powers after they had criminally invaded Iraq was to detain all chemists working on any projects in that country that might possibly have been connected with chemical warfare, and their families, and keep them in a hotel in Cyprus while they were being interrogated.
When it’s biological warfare and it’s the west, no chance. Give the top ones huge pharma contracts at universities, bedeck some of them with monarchist medals, always call them “professor” and “doctor” on TV, and denounce anybody who doesn’t show the lot of them a high level of respect as a deranged anti-social wrecker.
I often think about Iraq and the subsequent invasion and destruction of the Middle Eastern countries by the same people who are now imposing the “pandemic” upon us.
Last week Tony Blair threatened all unvaccinated people.
I think that those adults who believe this cabal of mass murderers are acting for our benefit, and are getting vaxxed share some moral guilt. They have inadequately understood just how criminal the actions of our governments have been and the terrible suffering they imposed on innocent people. Now it will be our turn.
And then there’s Gulf War Syndrome caused by ‘vaccinating’ troops with goodness knows what.
BTW, Mike, you’ll get your points across better if you work on your language a bit. A string of words such as “recalled to a place of stable storage & an intense analytical investigation initiated” is just awful.
Could this new employee in the control room have anything to do with it?
https://youtu.be/2n23oapBEao
It’s officially known as a government fudge, they had to find some excuse for the adverse reactions without undermining vaccine efficacy, no worries, just more evidence of a CONSPIRACY.
this is a test of whether there’s the slightest sign of integrity from these companies as well as the regulatory agencies, is that all use of the affected produce must immediately cease,
If the manufacturers do not exhibit sufficient control of drug product, the authorisation they hold from various regulatory authorities are utterly voided.
When there was an initial delay in rolling out the vaccine (to the vulnerable only) the Department of Health said it was because they examined each and every batch to ensure it was safe before permitting its use.
Did the US not do likewise?
Oh and let’s not forget the batches of vaccine vials that were found to contain distilled water (or similar).
And the saline batches which turned up in France in identical branded vials. I have relatives in France all double vaxxed who seem to have suffered no ill effects at all from being jabbed. Am wondering if they got a saline jab. Don’t fancy my own chances of being so lucky if I rocked up to a jabbing centre where I live.
This can’t possibly explain why there are large numbers of vaccine deaths and injuries in every country though. They can’t all have “dodgy batches” to the same %.
I am also struggling with this –
1 – we were warned that there would be some very bad side effects and the mechanism (mainly to do with the spike protein, especially when its distribution around the body was discovered from Pfizer’s Japanese study) was already at least partially understood. If we believe that majority are safe and harmless, this rather goes against what Mike Y and others, especially Sucharit Bhakdi who has explained it in detail, have been warning about.
2 – Dr Wodarg and John O’Looney (the undertaker) believe that the majority of doses are in fact placebos, so that those unaffected by side effects act as advocates for the injections. Would this explanation fit in with the study?
2 – Remember that Dr Richard Fleming did what he thought would be an explosive video last week based on his lab investigations into the Pfizer vaccine (I believe he tested 5 batches) and found them to be contaminated. Does this have any bearing? But why are we seeing the particular thrombotic events which are explained, I thought, by the action of the spike protein? Which as we know is what the injection was designed to do – prompt the body to produce spike proteins.
I hope someone more knowledgeable might comment on this.
100% of Covid-19 Vaccine Deaths were caused by just 5% of the batches produced according to official Government data
If this finding can be shown to hold up independent of age of recipient, it absolutely blows the “coincidence theory” (“they would have died anyway”) out of the water.
It is worth reiterating that there is no proof the vaccines, whatever batch they were, caused the deaths (except for a very small number related to blood clots and myocarditis). The word “caused” is slipped into the headline as an implicit assumption. All we know is that a small proportion of the people who died in the two or three weeks after being vaccinated were reported to VAERS as vaccine related incidents. It is curious that certain batches were related to more reports. I am sceptical of the source. But if it is true, it might be related to timing (they were used a time when vaccine safety was in the news) or, more likely, location (they were used in a place where for one reason or another people were particularly prone to reporting deaths as incidents). It would be quite interesting to know to where and when these batches were used.
For a number of weeks now we have seen total registered deaths running above the 5 year average. At face value these look to be of concern but I am not a statistician and would be interested if anyone who understands these things better than me could comment as to whether the current levels of ‘excess’ deaths is of statistical significance and should be a cause of concern?
Continued mortality as side effects from Lockdown, as predicted at the time, stress caused by economic hardship, suicide similarly; perceived or real bankruptcy and job loss.
Increased alcohol and other substance abuse.
Domestic violence from being cooped up for months on end.
Deaths of those cleared out of mental health facilities at the beginning of lockdown with no regard to their clinical need.
Never ending mortality of those denied regular access to the NHS for months on end.
Sedentary lifestyle for those on Furlough or WFH coupled with a complete halt to competitive sports, closures of gyms, sports centres, swimming pools (even though chlorine kills Covid instantly) and more stress caused by fear of arrest for conducting these activities in the wild.
If one could take out the deaths caused by lockdown and NHS/Care home neglect and abuse I suspect we would be below the line
“focus on ‘official’ death numbers”
Always interested in the use of language, as it’s such a big part of how we are manipulated. The use of scare/scorn quotes can be a useful way to indicate that the word is used ironically, that one disagrees with its usage in the particular case, as with my own practice of referring to the (thoroughly unconservative) “Conservative” Party.
In this case, clearly “official” is used literally and accurately. Presumably the use of quotes here by Carl indicates a reluctance to attribute real authority to these official numbers and sources.
However, where I think an error has been made generally by the resistance to the covid panic is in using the misleading term “vaccine” without scorn quotes to indicate that it is generally used in a false and intentionally manipulative sense. These are not traditional vaccines, which worked by simply exposing the body to the pathogen or something similar to it. These novel treatments work in a fundamentally different way, by acting on the recipient’s cells at the genetic level to make them produce a (toxic) substance, which itself then stimulates an immune response.
If we accept the manipulative language of the enemy (such as by referring to the current PM by his chosen cuddly stage name “Boris”, rather than by his surname) then we have chosen to accept battle on their choice of ground – rarely a good idea.
It might be that these style choices are conscious on Young’s part. He’s an experienced journalist and knows the impact words have. Perhaps using the language of the enemy is part of a choice to make the text seem less unfamiliar to the casual reader. But I would be interested to read a style guide by Young for DS, so I can understand what often appear self-defeating choices..
I would be interested to know if there’s a style guide and whether TY softens his views for tactical reasons or if he really thinks as he appears to do.
I was thinking about this the other day, that DS has not really come out with strong backing with what I see as the fundamentalist position about covid – that it was not a deadly pandemic of unprecedented nature that required unprecedented measures, and that in any case lockdowns and the associated coercion and propaganda are wrong under any circumstances. Those positions might at first seem extreme and hard to convince people of, but I remain of the view that unless those positions gain the upper hand we will never get out of the mess we’re in. Ultimately if you accept that covid was exceptional and/or that lockdowns can sometimes be justified then you disappear down rabbit holes, which I fear is what DS does far too often.
“I would be interested to know if there’s a style guide”
I would guess not, as it has been such a small operation. Although Young might have given his atl contributors some informal guidance.
“whether TY softens his views for tactical reasons or if he really thinks as he appears to do”
My suspicion would be not, as he appears quite honest. Then again, tact is a near universal human trait and that is the basis of natural political dishonesty. Doubtless he has his own doubts and concerns that he might choose not to share, as most likely we all do.
To answer one point that I made, I think there are two likely reasons why Young consistently uses “Boris”. First, his background is in tabloid journalism and this kind of “matey” style is natural there. He may believe that it helps to connect with “normie” readers (and perhaps he’s correct). Second, Johnson is not really the enemy as far as Young is concerned. For certain he disagrees strongly with him now on many issues, but the present alternatives are no better, and he probably still has many underlying agreements with Johnson’s positions on other matters, as well as a shared social background.
I can understand this position because it would be my own, if I had the same social background and if I didn’t view the panic responses to covid as completely unacceptable, and as beyond the Pale for any political leader, as utterly beyond political redemption.
“My suspicion would be not, as he appears quite honest“
To clarify, I meant “not” in reference to him “softening his views for tactical reasons” atl here. I mean that I don’t think he’s a secret “antivaxxer” who pretends to be a mainstream resistancer for tactical reasons.
Yes, I would agree with all your points
I’m curious to understand whether the DS position, which seems to be something like that it was understandable for the govt to react in the way it did to covid and that they mean well, is truly believed in or just seized on because the alternative means their mates are rotten the core. Maybe it amounts to the same thing.
I voted for Johnson, because of Brexit, but have never felt I owed him or the Tories any loyalty whatsoever.
This is where certain people have lead us over the pandemic responses they believe in.
Sadly a once great newspaper has bent to ‘influence’ and sacked the cartoonist.
For me this is a ‘there but for the Grace of God’ moment, from before the pandemic, where a very similar medical ‘accident’ was only averted because the medical equipment necessary to save my grandson from a similar fate had not yet been removed from the downgraded maternity unit he was delivered in, oxygen starved due to missed strangulation with his umbilical cord.
Medical accidents are increasingly commonplace in maternity units because of inadequate training, inadequate staffing levels, and inadequate equipment, and the responses to the pandemic have made everything worse, especially as this distraught cartoonist father of a severely disabled child has highlighted in his condemnation of the failure of the NHS to make up for the situation they caused, preferring instead to pursue nonsensical policies that have no empirical support.
I’ve been arguing with people – without much success – that the vaccines will not save lives. They may save people from death from Covid19, but those people will just die from something else. This is true independent of whether you think that the vaccines are effective against Covid19 (my opinion: a bit, maybe, but with massively under-reported downsides), and independent of the with/of Covid19 argument.
Just like statins, pcsk9 inhibitors, and HPV vaccines,then. [Feel free to add any number of other money making drugs.]
I believe all cause mortality is higher this year than last, during late summer/early autumn. Last year’s vaccines were better than this years at stopping death….
The argument that Covid would not make much difference since most of its victims were about to peg it anyway and that therefore lockdowns were pointless was made very early last year in a respected journal.
There was some discussion on the point before it was condemned by all as ‘cruel and heartless’, its author condemned to the wilderness.
Cue ‘my sad Covid story’ on the Jeremy Vine show.
Anecdote: In a conversation with an retired scientist who had been involved in the Nuclear power industry he commented on the plot of a crime novel where the victim had been stabbed to death using a dagger made of ice, the ice melted leaving no evidence. He said there was a much better way the victim’s tea, for example, could be brewed using Titrated Water, that is water with the hydrogen replaced with radioactive hydrogen Tritium, H3. The “Water” would pervade the body causing devastating radiation damage and then be rapidly excreted in the normal way thus disposing of the evidence. Also Tritium has a short half life.
OK, a bit difficult if not in a secure lab etc. But an even better way to get rid of an awkward ***** , get them institutionalised, then remove all contact with their past plus strict social distancing and hey presto RIP. Add a bit of
medazolam to to provide “A Good Death” if you feel some compassion?
It’s a blunt instrument, for a blunt mind. Counting the dead still doesn’t justify dictatorship.
Anyway, why do people have so much faith in ONS impartiality?
In just 18 months, Western leaders have broken the social contract, destroyed civil society and shattered all public trust in governments and health institutions. This damage will take generations to repair but must start with criminal trials.
What you write is the literal truth,but (sadly) I would bet my house that there will be no criminal trials, just as there weren’t after the war of aggression against Iraq.
Where does that leave us?
In April 2020 the NHS shut its doors to anything but Covid resulting in many excess deaths in care homes due to lack of emergency access for heart attacks, strokes and other conditions.
The elderly had DNR notices put on them, made comfortable with strong sedatives and painkillers and left to their fate.
How does the graph account for that?
To really see the trends you need to look at age standardised mortality (which adjusts for population size and ageing) over a longer period.
Here is my earlier chart (for England) based on this all cause age standardised mortality all cause ONS data, showing things right back to 2001.
The dotted lines all represent years from 2001 to 2010 and the solid lines represent years from 2011 to 2021. And the solid red line is of course 2021 and the solid purple line is 2020. I’ve used solid and dotted lines so you can see how mortality has been on an improving trend up to 2019.
If you like to think of things in waves, then yes there was a wave in all cause deaths in Spring 2020 (see the solid purple line in April showing the 2021 figure) and a much smaller wave in January and February 2021 (see the solid red line for Jan/Feb showing the 2021 figure). Note how even January and February 2021 aren’t complete outliers on that chart when you bring in years from 2001. And some of that high January and February 2021 level might be to do with a certain medical intervention that happened around then.
What we now see (September 2021) is all cause mortality has reverted back to where we were in 2010. But before 2010 all cause mortality was generally higher than for 2021.
You can just see this on the chart as the red line for September 2021 which shows all cause mortality is running on the outside of all the solid lines, showing all cause mortality mortality is currently running higher than all the years from 2011-2020. But the red line at September 2021 is pretty much on the inside of all the dotted lines, showing that mortality is running at at a lower rate than most of the years before 2011.
By looking at covid labelled deaths (not on this chart), you imagine an apparent second peak of the same sort of size as Spring 2020 occurring in January and February 2021. But really that is apparent but not real in terms of all cause mortality since it is mainly a mis-attribution of deaths from other causes to covid (plus some genuine covid deaths). Given that there are so few covid labelled deaths currently and this mis-attribution will be continuing, we can pretty much assume covid deaths don’t affect the September 2021 all cause ASM figure.
So what does that leave that may be causing this significant shift backwards to around 2010 levels? The lack of access to healthcare and health issues due to the campaign of fear targeted at the population by our own Government and the opposition parties etal perhaps, and deaths through vaccine adverse affects perhaps, or a mixture of both, must be the main possibilities.
Very good. I recommend finding some old (2010 or earlier) UN reports on predictions of death rates. They all show a continuation in the falling rates per capita until 2019 when the trend starts to reverse. Totally predicted based on aged demographics.
If you were planning to fake a pandemic 2020 was always the year to fake it.
That sudden jump from December 2020 to January 2021 is so suspicious.
Its when the ‘Kent’ variant made its brief appearance.
Yes, excellent point that the jump from December to January (and there is usually a jump) during Winter 2020/2021 looks much greater than the jump in earlier Winters from that chart.
Interesting to see the big dip below normal mortality in 2021, presumably reflecting a “dry tinder” effect, with so many of the about to die having popped it in early 2020 instead of clinging on to 2021. That this didn’t take effect in the pretty normal winter 2020/21 season might reflect the impact of the vaccination campaign killing off a few extras again, with the reduced immune effectiveness during the immediate post-vaccination period combined with some direct vaccine harms topping up the numbers and making the dry tinder effect even stronger this summer, perhaps.
Yes good point. There was a dry tinder affect in Summer 2020, but there is a dry tinder affect in Summer 2021 also.
If you look at England and Wales all cause mortality by age band in the latest weeks (adjusted for population in that age band), it is quite high (relative to say 2011-2019) in all adult age bands but it’s particularly high in the 45-64 age group. But importantly it’s slightly less high in the 65-74 age group and even slightly less high in the age 75-84 age group.
That might be indicative of a reducing but still ongoing dry tinder affect in the very oldest age groups but not in the middle to older age groups, which is outbalanced by the lack of access to healthcare, and deaths where vaccines have brought forward death including where the vaccine effect is sub-clinical, which may affect all age groups.
Interestingly, this group watching the scottish numbers point out that all cause deaths are at an all time high this summer, and show this is a massive outlier with numbers going back to 1980. Not population or age adjusted though as far as I can tell.
https://twitter.com/scojw/status/1453364239347982338
“9a/ Summer excess
Looking at the same periods of 2021 and 2020 versus the five year average, we see the huge difference.
2020 was quite normal, +1.4% from the 5 year average. Meanwhile in summer 2021 we are 3,000 deaths higher than the 5 year, 15% above normal.”
1980-2021
Thanks.
I’ve not really been following Scotland. But there have been various reports that mortality is running even higher than England and Wales currently.
If that is the case, I wonder what the reason for that is?
“If that is the case, I wonder what the reason for that is?“
Me too. Will be interesting to follow these developments.
Scotland has always had low vitamin D?
Though that’s excess deaths rather than all cause.
Birth, life and death are one and same continuum. Not a digital pick-and-mix.
More or fewer deaths than births – not possible. Death is a fact of life.
Excess death = excess life – mind-set of murderers and scared ‘perfect’ ones.
Governments’ terrorism, plus extreme repression, plus jabs muddy the water making identifying precise cause impossible. They’re fore-shortening our lives.
When results become visible, they’ll blame their ‘long virus’.
It’s a ‘pandemic’ of tests.
Governments’ actions – far more dangerous than world’s most popular ever virus.
Enforced repression destroys life, replacing it with mere existence – hell-on-earth.
I’m a person – fallible, fleeting and trivial in vast order of amazing things.
World won’t stop just because I do. Time is short and, unlike target-dates at work, we never know when ‘close of play’ will be. Every moment wasted is wasted life.
Rudyard Kipling – If:
“…. If you can fill the unforgiving minute
With sixty seconds worth of distance run ….”
Wonderful comment!
When I decided to get out and about as a key worker during Lockdown 1 it was on the basis that if Scary Covid was going to get me then so be it. Hiding idle indoors was not going to save me.
As the possessor of some comorbidities (though less than they thought) I had also decided that, should I be hospitalised, I would instruct them to fill me with morphine and let me go having no wish to turn into a crippled survivor.
So the pandemic was over last June, in the UK at least, just as many of us said at the time.
The excess deaths in January/February were basically deaths brought forward by a few months by a combination of vaccine injury in the already frail, over-use of Midazolam, and the effects of lockdown on the healthcare system
Ridiculous to assume all these deaths are caused by covid.
An important question here is how much of the excess mortality recorded in the latest data is due to missed diagnoses and delayed treatment for conditions such as cancer? We may never find out, because some of those dying from chronic conditions may test positive for covid (including those who picked up the virus in hospital) and will be recorded as covid deaths, though in reality they were anything but. The official statistics may be very misleading.
delete
Noah banging the drum of the bleedin’ obvious again. (In this timescale, the use of age adjustment is irrelevant, BTW – KISS).
“Clearly, the pandemic was at its deadliest in April of 2020, when the age-standardised mortality rate reached almost 200% of the five-year average.”
‘Deadliest’? Yes – well – in relative terms. But it was never ‘deadly’ in terms of the overall impact in 2020, as has been explained many times.
“This probably owes to a combination of factors: better treatments; better shielding of vulnerable populations; the vaccination program, and the gradual build-up of natural immunity.”
But no mention of the ‘dry tinder’ effect and mis-treatment (ventilators being the most egregious) that enhanced the short April surge. But the unsubstantiated Jab gets a mention.
Viruses do what viruses will do, and interventions, beyond the sensible, usually make things worse. Similarly, there is the noddy assumption that all cause mortality – against all analysis – should and would – meekly stay at its all-time low of the last decade.
I’m assuming that the 5 year average that Noah and the ONS are comparing the 2020 and 2021 mortality to is also age standardised and covers the period 2015-2019.
If you don’t adjust then you are comparing around 2017 (middle point of 2015-2019) with 2021 without any adjustment for changes in population or ageing.
So there is a danger that by not age standardising the excess all cause mortality in say January 2021 looks high. Let’s remember we are looking at the difference in two but similar numbers (deaths in 2021 vs the 5 year average) so a small error such as not adjusting for population size or ageing can magnify up. And so we come to spurious conclusions such as there was significant excess mortality in January 2021 of the same order as Spring 2020 when there wasn’t.
We however do need to be careful in not assuming the age standardisation used by the ONS accurately adjusts for population change and ageing. I believe that ONS are still working off the 2011 census and we know from the NIMS vs ONS population debate that some of these estimates may be very imprecise.
Personally I prefer to look at a number of individual years rather an average because the average hides normal variation and hides general trends too. But adjusting for population size and ageing (where there are a number of years between data points) is making sure that you keep it as simple as you can but no simpler than that.
https://www.bitchute.com/video/40Ho2GR6t86Z/
BitChute – MAG BITTER TRUTH – BAM!
BAM!
The main narrative is that the entire excess death rate was due to deaths CAUSED by Covid. How do you explain that this is nonsense to a brainwashed population? More work is needed to explode this myth and bring the facts to the surface otherwise the Zero Covid propagandists and ” the science” will succeed in having us all locked up again for Christmas.
“This chart provides the best guide to the pandemic’s impact on deaths”, is this the virus? CoViD19? or the pandemic itself or rather the response to the pandemic? I would suggest that the excess deaths are not due to the virus or CoViD19 but to the response to the pandemic, i.e. untreated conditions such as cancer, stroke, heart attack, suicides, road traffic accidents etc.
I would have thought it very possible that the excess deaths were not at all due to Covid because as we know, and Govt has admitted, lockdown has been causing increased cancer, stroke, heart attack deaths etc. so maybe all those excess are due to that and not due to Covid at all which is probably just slightly accelerating death of those already near their end.
No doubt they all had something shoved up their noses while they were in extremis, in the hope it would boost the ‘covid’ figures.
Surely more note should be taken of ”excess deaths” in 2020 and 2021. We’re told that about 600,000 people die each year in the UK (natural wastage) and that 2020 at least was no different. And that the 130,000 (or so) people who died WITH ‘covid’ were simply a part of that figure.
FOIs to local councils showed that in 2020 there wasn’t a great deal of difference in the numbers of burials and cremations compared with the previous 5 years. Surely that is a far simpler and unarguable way of looking at death figures.