On Lockdown Sceptics we have highlighted before the reasons that restrictions don’t have the expected effect of suppressing COVID-19. Partly it’s because lockdowns don’t prevent spread in hospitals, care homes and private homes, where much of the transmission happens, especially that which leads to serious disease. And partly it’s because people who are infectious and symptomatic fail to self-isolate, perhaps because they cannot, or cannot afford to, or because they think it’s just a cold.
It’s not because asymptomatic infection is a major driver of transmission. Despite this claim being much repeated, including by public health authorities, the evidence is that (as with other similar viruses) asymptomatic infection is barely infectious and contributes very little to the spread of the coronavirus.
We now have some clear data on how many people who develop COVID-19 symptoms actually follow through with self-isolation. A large nationally representative survey of 53,880 people published this week in the BMJ finds that less than a fifth (18%) of people who have COVID-19 symptoms take a test and less than half (43%) of those with symptoms (and who don’t test negative) fully self-isolate for 10 days without leaving home. Even at the height of the January surge, when hospitals were being stretched, only 52% of people with symptoms (and no negative test) fully self-isolated.
The survey asked the reasons for breaking the quarantine.
The most frequently reported reasons for not fully self-isolating were to go to the shops for groceries or to a pharmacy (21.5%), to go to work (15.8%), to go to the shops for things other than groceries or pharmacy goods (15.6%), because symptoms did not persist or were temporary (15.2%), to go out for a medical need other than COVID-19 (15.0%), to go for a walk or for some other exercise (14.8%), believing symptoms were only mild (14.5%), because symptoms got better (13.9%), thinking it was not necessary to stay at home (13.2%), being too bored (12.2%), to help or provide care for a vulnerable person (11.9%), to meet up with friends or family, or both (11.3%), and being too depressed or anxious (11.2%).
It also asked about reasons for not requesting a test.
The most common reasons for not requesting a test were thinking the symptoms were not due to COVID-19 (20.9%), symptoms had improved (16.9%), symptoms were only mild (16.3%), having no contact with anyone who had COVID-19 recently (13.0%), thinking that only self-isolation was needed (11.5%), not wanting to use a test that someone needed more (11.1%), not thinking you were eligible to get a test (11.0%), and being worried about how colleagues or employers would react if a test result was positive (10.0%).
This confirms there is no reason to believe in the evidence-free concept of widespread asymptomatic transmission to explain why lockdowns don’t work. With more than half of people who have symptoms not fully self-isolating, that’s plenty of opportunity for symptomatic transmission.
In terms of evidence that lockdowns don’t work, we now have a new study to add to our ever-growing list.
Christian Bjørnskov, a Professor of Economics at Aarhus University in Denmark, has this week published a study, “Did Lockdown Work? An Economist’s Cross-Country Comparison“, in the Oxford academic journal CESifo Economic Studies. The study explores “the association between the severity of lockdown policies in the first half of 2020 and mortality rates”. In a sophisticated analysis that draws on the Blavatnik Centre’s COVID-19 stringency index, Professor Bjørnskov addresses “policy endogeneity in two different ways” and takes “timing into account”, and concludes he can find “no clear association between lockdown policies and mortality development”.
This conclusion is confirmed by looking at how U.S. states have fared which eschewed lockdown orders or have recently lifted them.
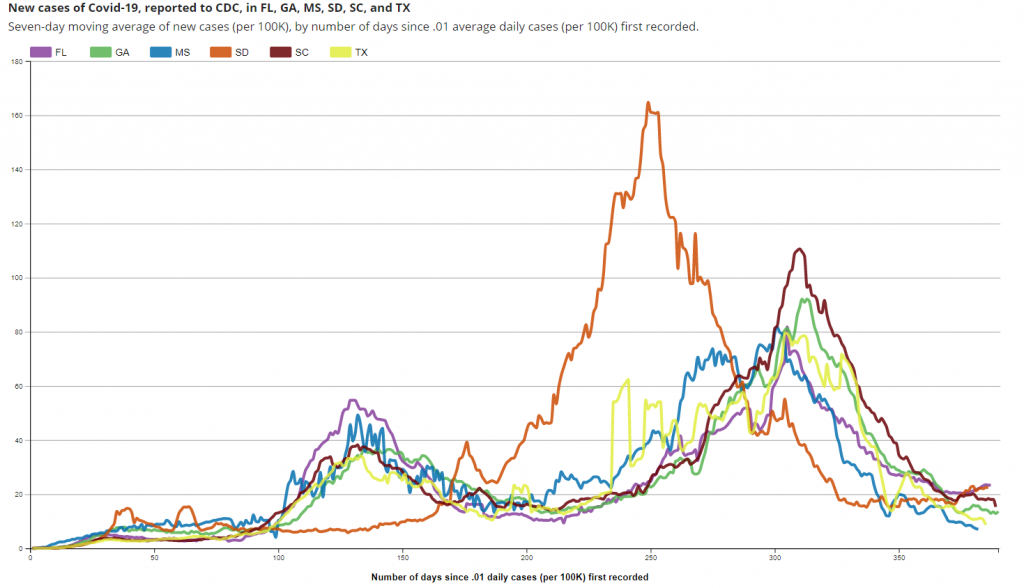
The graph below depicts the positive case curves for six states which currently have no restrictions at all, whether because they never had them (South Dakota), because they removed them after the first wave in the spring (Georgia and South Carolina) or the autumn (Florida), or because they removed them in the last few weeks (Mississippi and Texas). All have seen positive cases and deaths tumble with no sign (yet) of a spring resurgence. Contrary to all the epidemiological models, the absence of restrictions and masks has not resulted in mass hospitalisation and death amongst the population, regardless of when the restrictions were removed. All have followed similar trajectories to one another as well as to states which imposed far more restrictions.

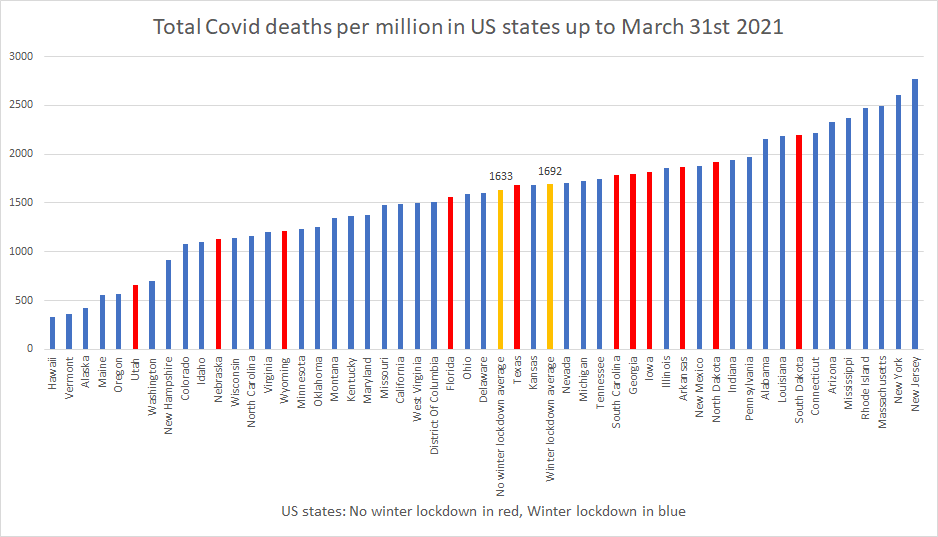
Below is a chart with the up-to-date Covid death tolls per million people for U.S. states. It shows that mortality remains lower on average in states which did not lock down (i.e., impose stay-at-home orders) during winter compared to those which did.

The evidence is clear: lockdowns don’t work, they aren’t necessary and they cause great harm.
To join in with the discussion please make a donation to The Daily Sceptic.
Profanity and abuse will be removed and may lead to a permanent ban.
First class report.
“Better to have questions without answers, than answers without questions,” as Professor Feynman used to say.
In more sceptical moments, I sometimes think old-school empirical science took a mortal hit around the time of the Feynman Lectures…
https://www.youtube.com/watch?v=EYPapE-3FRw
…Just as mainframe computers started to proliferate. Sixty years later it’s been a digital hop, skip and jump to the “well-correlated neighbouring stations” cited in Chris Morrison’s latest excellent article showing up Met Office settled science for the feebleminded yarn it actually is.
Thanks also for the educational diligence of Paul Homewood and other citizen scientists probing away behind the scenes.
“well-correlated neighbouring stations”
It is a fundamental principle in scientific investigation that if multiple measuring instruments are to be used and their data combined, they must all be calibrated against the same, standard reference instrument whose accuracy is known. Then the error of each is the same and known and allowance made, and not compounded.
There is no common reference instrument against which the temperature instruments around the World used for “the global temperature record” are calibrated. Combining – correlating (!) – their data has an unknown, incalculable compounded margin of error.
Averaging data introduces a margin of error. Average global temperature (there isn’t one) or temperatures is meaningless particularly when claims of warming in small fractions of tenths or hundredths of a degree are made.
The truth is nobody knows with any accuracy how much global warming there has been “since records began” (1860 as the Little Ice Age ended) or in fact how much the climate system is currently warming in the context of the last 10 000 years, other than in general terms, slowly and small, irregular increments.
The only true “climate scientists” are geologists, because climate is part of the Earth’s history which can only sensibly be analysed retrospectively over long periods, and geologists are the Earth’s historians who carry out this analysis.
Understood (and far better explicitly stated than my hand-waving).
I wonder if “well correlated” means the same time? If so the wind speed across the distance must be accurately know, because this causes a correlation time delay. See my other comment, the whole process has huge error bands (uncertainty). More useless alleged data!
Thanks for the Feynman link. I winced when he mentioned ‘computers that can churn out new guesses’ – exactly the ‘science’ of models used as ‘proof’ which we’re being subjected to.
There’s a huge difference between someone who thinks scientifically and someone who can learn a bunch of scientific detail. The first has humility and conducts an ongoing quest for truth. The second arrogantly believes they’ve learned all there is to know.
Cue another quote from 60 years ago (same goes for Profs):
“It is important that students bring a certain ragamuffin, barefoot irreverence to their studies; they are not here to worship what is known, but to question it.”
Jacob Bronowski (1908-1974)
An excellent quote, demolishing that whole bogus concept of “settled science”. Real science can never be “settled”. New discoveries challenge old assumptions, and at some point everything we now believe to be true has to be re-evaluated. Do we still believe the Earth is flat? Do we still believe that all matter is a combination of fire, air, water, earth and aether? But it takes a great deal of determination to push against the inertia of accepted ideas.
The MET office is as usual mathematically inept, probably deliberately. The only scenario where intermediate data can be derived between two points is where the exact function (this may be a curve or straight line but must be both a continuous function and have a continuous second derivative) is known. As temperature with wind movements is not a function like this, the intermediate temperature profile cannot be estimated and any data is worthless. Not even class 5, worthless! I can suppose that a straight line is used, so as to not tax the brains in the MET office too much! Worthless!
More excellent work by Chris. Thank you.
The whole argument of generating ‘assumed data’ for between datapoints does strike me as a bit mad
If my house was worth £500k, but ten miles away there is a house worth £1m, does that make houses five miles away worth £750k.? Data is only as reliable as the assumptions that you make about it.
A datum is a fact assumed from direct observation. Triangulation and extrapolating/averaging from data points is not direct observation and does not produce data, it produces numbers, as does computer modelling.
When the numbers produced from this jiggery-pokery are presented with a degree of accuracy greater than the actual input data, which is the case in climate “science”, we are in the realm of the absurd and make-believe.
Consider that in some countries ‘gridding’ can be done over the distance from London to Edinburgh.
Yes JXB, but it is much worse than that, see my other comments. The gridding process is mathematically so flawed that it can only produce nonsense. I suppose if you are willing to average everything over a long time period the errors might be smaller, but as maximum temperature probably only lasts for a very short period, this is useless too!
So the MO own the science do they? Presumably this proprietory climate science is different from the science that is accessible to the rest of the world.
Well yes, we know it is different because it is not based on old-fashioned measurements but on the new, improved, presumably AI enhanced, climate modeling.
It’s based on smugness, delusion, self importance and make believe
Brilliant reporting Chris and from your sources too.
Can we please get the torpedoes in the water and sink these rusting hulks of climate measuring organisations?
Perhaps we could hack into their weather stations and recalibrate them.
I think ‘smoke’ and ‘mirrors’ is being kind the criminal ecoactivists and the Met Office – ‘bull’ and ‘shit’ might be more accurate.
Those with long memories may recall that prior to the Typhoon Record the MetO were overjoyed when a non-MetO weather station as Cambridge Botanic Gardens claimed a new record. They tried to restrain the eagerness and said they needed to check the equipment first. Note equipment and not site. And of course the equipment was fine so pop the champagne corks. Then the ordinary honest folk got to work and came up with a site rating of WMO 3 to 5.
It is interesting that they transitioned from an idea of an impending ice age to one of the planet being burned up. I remember at school it was all about the impending ice age. It is interesting how you can flip the narrative 180 degrees as if no one notices.
Another thing that seems to go unmentioned and which is yet self-evidently extremely important is the decline in insect numbers over the last few years. Virtually no one notices. That doesn’t mean that it isn’t happening. It is very dramatic and doesn’t presage well for larger creatures. Open your eyes this stuff isn’t brain surgery. Painful to look at but you have to look.
I’ve noticed it too.
True but there are enormous uncertainty as to why. With Bees it is probably disease, with butterflies it might be very wet weather. However, saying that this is due to anthropogenic climate change is ridiculous! With more greening of the Earth there ought to be more flowers and thus more flying insects, a degree of temperature change has not done this before, so why now? It might well be our mild winters have failed to kill of preditors, or allowed disease to flourish in less hardy stock. Farmers love hard winters, they kill lots of pests.
You have to tune into nature properly and listen to its woes and you can do that anywhere. You can choose not to listen but then you will bring about a constipation of the world spirit. Forget all the worldly human nonsense and have some respect for attentiveness. This makes a big difference.
All these estimates and fakery also extends to the Energy Performance Certificates or EPCs demanded when a house is sold. According to this research the consumption is overestimated and most properties are about C rating. https://www.sciencedirect.com/science/article/pii/S0378778823002542
The EPC software is far from fit for purpose, It is designed not to work properly, for example a heat pump gives extra good points!
Well done Mr Morrison.
The Met Office: Making Estimated Twaddle.