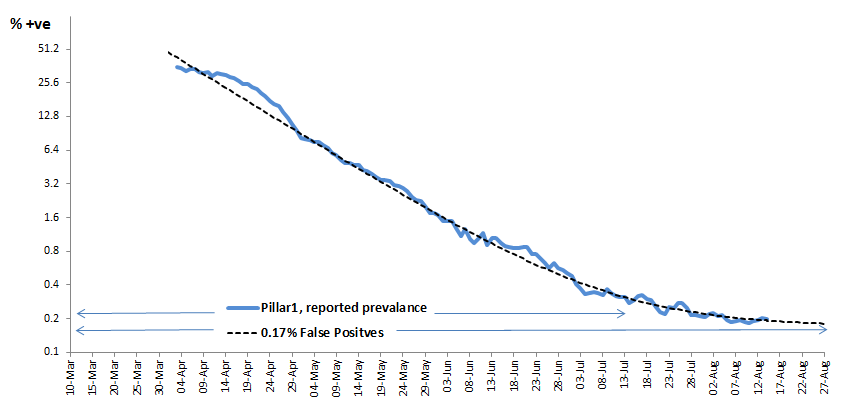
The data continues to unfold exactly in line with a 0.17% false positive rate for the PCR test. Here’s the chart.

To recap:
The definition of “false positive” is important to clarify. One type of false positive would involve detection of not only SARS-CoV-2 but other coronaviruses as well. Perhaps someone who has carefully studied the PCR primers and range of extant human coronavirus sequences could judge how likely this is to occur. A second type of false positive would be the detection of non-infectious viral fragments that can remain in one’s respiratory passages for two-three months after the infection has been eliminated by the immune system.
However, the class of false positives most people talk about entails contamination of PCR reactions with trace amounts of viral material – which in PCR labs almost always comes from previous reaction products. The PCR assay works by amplifying a few copies of virus molecules by millions or billions of fold, so it is pretty much impossible to completely avoid having some reaction products escape and contaminate the laboratory or some of the utilised reagents. These then get into, and become amplified in, subsequent test samples, causing false positive results. So let us call these “contamination positives”. Since the PCR assays are performed in different laboratories in many places, contamination positives would cause clusters of false positives to pop up in different locations at different times. Sound familiar?
The rate at which contamination positives occur nationally could easily be determined by re-running a series of positive samples. This would ideally be done on a reserved aliquot of the initial swab sample, not on the processed version of it that goes into the PCR reaction (as that processing could have contaminated it). If the original sample has been completely used up by the standard assay process, then one would have to go back and get a second sample from each individual that scored positive. I have heard that the authorities do conduct such re-testing controls, to determine false positive rates. But I have not seen this officially reported anywhere.
But in advance of the authorities coming clean about their rate of contamination positives, there is a very simple way to estimate this for ourselves. We simply look at how the drop in the fraction of positives is changing over time, and note where it plateaus. Over months, the prevalence in Pillar 1 subjects was declining along a perfectly exponential decay curve (as evidenced by its decline as a straight line on the above exponential graph), just as one would expect from natural eradication of the virus. In fact, it was reducing by about 5.5% each day from its previous day’s value. But recently the curve has started to level off towards a plateau. This could be due to a slowing in the rate of the virus elimination (for one or more of many reasons), but nothing major has suddenly changed recently to trigger this after so many weeks of decline. The other explanation is, of course, that this change is a testing artefact, i.e., the prevalence has now fallen so low that false positives are starting to dominate the positive results.
To illustrate this, the blue line on the chart shows percentage of positive tests in Pillar 1 data (smoothed over 7 days), plotted alongside a black dotted line which indicates the path the curve would follow for an exponential decline of 5.5% per day given a contamination positive rate of 0.17%. If the false positive rate is indeed 0.17%, then this means that for Pillar 1 subjects the true prevalence is now 0.03%, rather than 0.20%. It also means that more than four out of five positive results are false positives due to PCR contamination – and the fraction will only get larger from here (assuming the real prevalence continues to decline). Watching this curve over the next few weeks will be most informative!
Finally, a hidden/ignored contamination positive rate of 0.17% would lead to authorities declaring (on average) a minimum of 170 ‘cases’ per 100,000 tests.


Donate
We depend on your donations to keep this site going. Please give what you can.
Donate TodayComment on this Article
You’ll need to set up an account to comment if you don’t already have one. We ask for a minimum donation of £5 if you'd like to make a comment or post in our Forums.
Sign UpLatest News
Next PostLatest News