
Regular readers will remember Philippe Lemoine from my interview with him back in August. For those who missed it: Lemoine is a PhD candidate in philosophy at Cornell with a background in computer science. During the pandemic, he’s written several interesting articles, including a particularly good one titled ‘The Case Against Lockdowns’.
Lemoine’s latest article is a zinger. It begins with the puzzle of why the effective reproduction number often fluctuates wildly in the absence of changes in aggregate behaviour. Or put another way: why do infections sometimes start falling, or start rising, for no apparent reason?
I actually noted this puzzle myself in article back in March (which Lemoine kindly cites). Specifically, I noted that case numbers in South Dakota began falling rapidly in mid November, despite almost no government restrictions and little change in people’s overall mobility.
There are at least two existing explanations for this phenomenon. The first is seasonality: the effective reproduction number may partly depend on variables like temperature, humidity and UV light. Yet as Lemoine points out, there are many examples where case numbers changed suddenly that seasonality can’t explain (like South Dakota).
The second is viral evolution: the effective reproduction number may suddenly rise when a new, more-transmissible variant emerges (such as Delta or Omicron). Once again, however, case numbers have undergone dramatic changes in the absence of new variants. And while viral evolution can explain the rises, it has harder time explaining the falls.
Lemoine’s explanation is different: population structure. Traditional epidemiological models, he notes, assume the population is ‘quasi-homogenous’. This means that your chance of infecting someone of the same age who lives next door is the same as your chance of infecting someone of the same age who lives on the other side of the country.
Not very realistic, of course, but models have to make simplifying assumptions. How much does this one matter? It matters a lot, Lemoine argues.
Rather than assuming there’s one big quasi-homogenous population, imagine the population is divided into a large number of ‘subnetworks’. These could be based on location, age-group, behaviour or a combination of factors. For example, one subnetwork might be ‘school children and their parents in central London’.
Suppose that transmission occurs frequently within subnetworks but infrequently between them. So when a child within the school subnetwork catches the virus, it quickly spreads to other children and their parents. But what it doesn’t do is quickly spread to those outside the subnetwork.
Lemoine shows using simulations that, if you assume the population is structured in this way, the reproduction number can rise and fall without any changes in seasonality, viral evolution or aggregate behaviour. One of his simulations is show in the chart below.
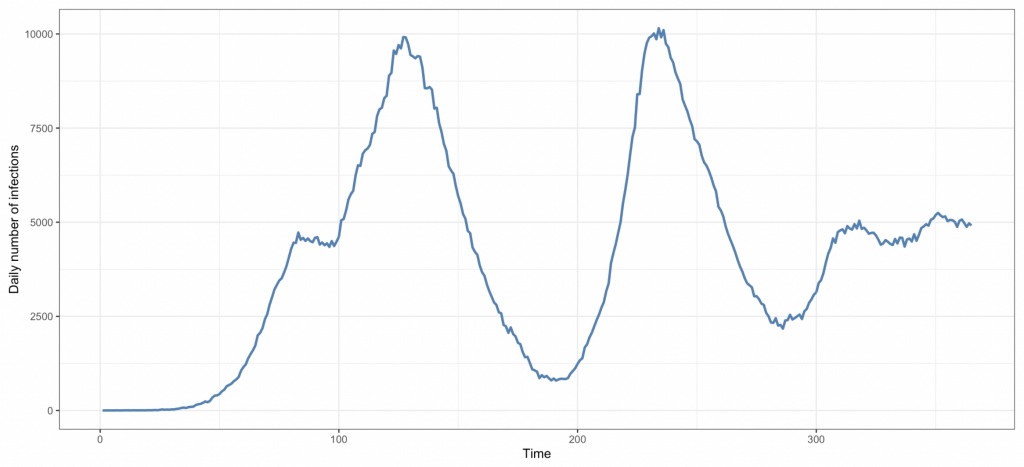
Compared to the giant single-peaked graphs produced by Imperial College researchers last year, it’s a much closer fit to empirical data. The idea is that once the virus exhausts all the susceptible people in one subnetwork, it takes time for other subnetworks to be seeded, and for new epidemics to emerge.
One interesting implication is that the overall epidemic ‘wave’ is actually the sum of waves in all the subnetworks where the virus is currently spreading. This means that several quantities we’ve been obsessing over, such as the effective reproduction number, might be “largely meaningless” at the aggregate level.
When infections start falling in a particular country, the Government often takes credit for having ‘gotten the R number below zero’. But if Lemoine is right, the R number may have fallen simply because the virus exhausted susceptible people in the subnetworks were it was recently spreading.
So governments may have been taking credit for fluctuations in the R number that were entirely independent of their policies.
Population structure is by no means inconsistent with other two explanations I mentioned earlier: seasonality and viral evolution. And although it’s hard to test empirically, the theory seems eminently plausible and worthy of consideration. Lemoine’s article is over 17,000 words, but it’s worth reading in full.


To join in with the discussion please make a donation to The Daily Sceptic.
Profanity and abuse will be removed and may lead to a permanent ban.
Seems like a very basic assumption to make. It surprises me how crude the models we’ve been relying on are allowed to be.
The cruder the better if they get a regime approved result, just look at the climate “models”
As mentioned in today’s Roundup I am no expert at all but 1970s ‘O’ Level Biology says something about a novel virus starting of as quite damaging but not very infectious and over time morphing into something more contagious but with much less severe side effects, exactly as with Omicron and within the usual timescale scale 18 months to two years before simply fading into the background.
If this was really about health you might expect SAGE & The Politicos to be pleased.
Dr Mike Yeadon explains this very clearly and referred to this over twelve months ago.
And was called a dangerous nutter for his pains no doubt.
” and if my kid dies it’ll be all your fault for downplaying this horrendous worldwide Pandemic call yourself an expert you should be locked up . . .” Jeremy Vine show caller sort of response?
Have you seen what he’s posted in the last few days? – he’s really, really, down the rabbit hole now. And I continue to agree with him.
unless unnatural evolutionary pressure is applied…
http://epidemics.psu.edu/articles/view/leaky-vaccines-promote-the-transmission-of-more-virulent-virus
You’re quite right. I used to teach first year university biology including viruses and vaccinations and none of this surprises me. I’ve been trying to tell people this type of information from the beginning but getting nowhere. I’m appalled at the stuff we’re having to put up with and equally appalled that voices of knowledge have been shut down.
Yup – just as is the case with ‘global warming’!
This is all wonderful stuff. The search for knowledge and understanding of the physical world should never stop. It would be great if we could finally get to grips with the microbial world and understand what is really going on.
It would just be nice if the search could be conducted without doing mass experiments on the world population, destroying lives, torturing children, ruining businesses etc..
Seems like a good suggestion.
Things like this, of course, merely emphasise just how little we actually know for certain about how these things work, and hence the utter absurdity of claiming to “model” their future progress, and therefore the irresponsible lunacy of basing radical interventions on the inevitably completely wrong model outputs.
Applicable to climate change as well as covid, obviously, and anywhere where panic is pushed based on “modelling” of complex real world phenomena.
It’s simply called hubris.
It’s a mild cold, who cares
Those who care will include all those whose businesses that have just about survived but will now have another opportunity to go bust thanks to bozos likely mad overeaction to the scary new mutant which seems to be relatively benign.
The ‘R’ Number is a key component of the nascent technocracy. It is abstract, and exists because a simple number is needed to fool the general public, who do not understand or wish to get involved with statistics. R number goes up; Freedom goes down. R number goes down; Freedom goes up. They need a simple visual metric that can be used as a tool of constant propaganda and fear. I expect a Climate Emergency metric will be introduced that is equally meaningless. Daily Climate Emergency Rating: Red etc. That’s how fucking stupid they think we are.
I do hate how “the science” has simply reduced nature & natural process to a statistic. And corporate interests have subverted any truth in those numbers to leverage an advantage to advance their interests, in short, statistics are untrustworthy BS.
Don’t forget that it’s also the key component for calculating the required vaxx rate to achieve HI.
Totally misunderstood and utter boll*cks, of course, but they are following this ‘model’ slavishly, it is also behind the drive to give the gunk to children.
The new variants have made it not just practically but also mathematically impossible, and that is before the practical and mathematical impact if the negative VE, which makes these models and that approach completely absurd, not that they would notice.
https://bartram.substack.com/p/the-never-ending-quest-for-herd-immunity
Yes. They want a vastly reduced population of eyes peering over the top of a surgical-looking mask at a biosecurity display board in New Normal Picadilly Circus waiting to be told the day’s R number in order to determine whether they will be allowed to mix with other humans or work from home programming algorithms used to determine the days R number.
That was clear as soon as they introduced the R number. They could claim it to be whatever they liked to suit their current purposes and who is able to refute them?
The success of their scare tactics over the last 2 years suggest that they’re right to think that the public are stupid and easily led (over a cliff).
https://www.youtube.com/watch?v=tF8UNcB22VQ
‘But now just before Christmas everyone’s dragged up another excuse to create anxiety to limit people’s freedoms’
Dr Laurence Gerlis from Same Day Doctor discusses public concern for the Omicron variant.
Now I know where to go to route around the Notional HS
Of course he is right but Covid is only doing what virus usually do.
We live in a world where everything is interlinked with our actions forcing reactions in natural cycles, we humans have evolved to attempt to change the environment we live in to best suit us by interfering with natural process. The lesson we never seem to learn however is that the benefits to us have consequences, often negatively far into the future!
The mitigation measures to control SARS-Cov-2 may have had minor short term benefits, & prolonged the life (suffering) of some inevitably susceptible to infection & severe disease, but in the long-term that interruption in a natural process has simply prolonged the longevity of the harms from the virus & it’s evolution. It’s probably true, with such intense scrutiny we may be learning much more about pathogenic ecology than we knew before.
But in summary, they’ve made things worse, what ever we do, viruses will be viruses! My conclusion is life is for living, now, not for saving for later, because there is no guarantee of a future.
ie a Gompertz curve, as was understood in virology for many decades.
Even if a partial explanation – much better than the pointless pursuit of observably broken models such as we have been subjected to.
I read an article somewhere, likely on this site, in Autumn last year that said much the same. Local herd immunity reached until the herd is disrupted by external factors eg kids going back to school. University term starting.
As others have said. It is the b****ing obvious really.
Herd immunity in the proper sense of that word, not the vaccine only mangled version as now used by the WHO, SAGE and the rest.
Which natural herd immunity bozo & Co did absolutely everything they could to prevent use achieving especially among the largely unaffected young with their futile attempts to prevent students from ‘mingling’, classroom bubbles and all the other nonsense.
I haven’t read it yet but the previous article appears to be more of the same with fatuous advice not to socialise except where ‘necessary’.
What a shower of tossers.
I certainly posted exactly that over 12 months ago.
Nothing here is new.
Not sure if he has referenced her work, but this looks a lot like what Gabriela Gomes, a biomathmatician fron Edinburgh Uni and her colleagues have been saying since the summer of 2020.
You may remember a bit of a kefuffle last year when papers started to be rejected on narrative grounds rather than content – one of the first to be rejected like that was her’s.
She’s on twitter at: @mgmgomes1
https://twitter.com/mgmgomes1/status/1291162358962937857?s=20
Interesting, and makes logical sense. There is one fly in the ointment here though I think – the same subnetworks appear to suffer reinfection of the same variant. Delta has been the dominant strain for the 2nd half of the year, but the number of reinfections for many subnetworks is significant. This could, of course, be explained by the simple truth that the vaccines don’t work very well and only have temporary resistance to the virus. That would then fit in nicely with the hypothesis.
Of course, these explanations are based on the assumption that the data used is mostly accurate. I contend it isn’t. Different cycle thresholds have been used at different times, at different geographic locations, on different categories of people. That alone damages the case rate, and in turn the mythical R number. Perhaps beyond study for ‘waves of infections’. I’ll even go further and argue that Covid waves can be manufactured.
I’ll throw another suggestion in though. Just for a bit of fun, and taken from Quantum Physics:
The observation effect disrupts wave function.
“This means that several quantities we’ve been obsessing over, such as the effective reproduction number, might be “largely meaningless at the aggregate level”.”
Just like inflation then.
https://economicsfromthetopdown.com/2021/11/24/the-truth-about-inflation/
Not at all.
No sane economist expects changes in prices to change demand evenly.
There are few if any sane economists. They are largely Neil Ferguson wannabes.
The article explains that what they call ‘inflation’ is actually ‘redistribution’.
https://www.youtube.com/watch?v=hdw_srvPEyg
Andrew Lawrence explains why we need to wear a mask!
Governments will take credit for anything that reinforces their narrative, while anything that goes against the narrative is a right wing conspiracy theorists wet dream that must be silenced cancelled and if left up to some people, lined up against a wall and shot.
Many of us have heard that there is no evidence to support asymptomitic spread of respiratory disease.
The really interesting thing is that there is precious little in the way of evidence to support the claims for the spread of symptomatic respiratory disease.
Indeed the whole notion that viral particles can spread from person to person and thereby spread disease doesn’t sem to have much in the way of credible scientific evidence to support it.
Take this look at the claims made regarding the measels virus, it isn’t very convincing is it?
https://odysee.com/@drsambailey:c/themeaslesmyth:0
There is plenty of evidence.
Dr Sam Bailey is another one who has a book about “viruses not existing” to sell to the gullible.
It appears to be more profitable to be a quack than a real doctor these days.
https://www.acsh.org/news/2021/02/10/how-quacks-become-millionaires-5g-covid-doctor-will-sell-supplements-15336
Many of her claims are not supported by evidence and have been totally debunked by real scientists who have shown real evidence to debunk her claims.
She is a TV doctor from New Zealand who appears to have little understanding of modern virology.
Her wild claims have been debunked on this science website.
https://blog.waikato.ac.nz/bioblog/2021/04/sam-bailey-on-isolating-viruses-and-why-she-is-wrong/
Maybe the problem is that’ll all of these models do a terrible job of actually modeling how a disease is transmitted. I’m sure all of these models use a constant probability for how often an infected person interacts with an uninflected person, the percentage of contacts that will be exposed to the virus, and the percentage who are susceptible to becoming infected after being exposed. It is obvious that none of these probabilities are constant based on the obvious seasonality, and the easy observation that not everybody in a close knit group becomes infected when the disease is introduced. In fact, the entire model is based on a person’s immune system being challenged by a virus rather than the immune system being in equilibrium with the virus and the environment. Like with the weather, I don’t think we have the understanding needed to model disease on a population level.
One of the most interesting features of the initial lockdown came from supermarket workers.
These workers were working indoors with air conditioning running, poor ventilation, no masks in use, and the great unwashed were coming in and out spreading the dread covids as they came.
Many predictions were made that the supermarket workers would be badly hit by all this exposure.
Yet supermarket workers experienced no more infection, hospitalisation or death than for those that worked at home.
Once people realized the primary transmissions were aerosols, most of the basic modeling assumptions don’t make sense. A person may not even need to be in contact with another person to transmit. Just as a thought experiment, suppose the half life of an aerosol droplet is 2hr at a relative humidity of 65% but it is 2min at 55%. The entire system would be chaotic.
From a modelling perspective I’ve seen Joel Smalley produce graphs which show waves within waves in order to get his drivers to match the empirical data across various geographical data sets at the aggregate level. Certainly feels like the same underlying fundamentals at play.
This is an important consideration, yes.
Much of the rest is explained by Hope-Simpson’s theory of viral epidemics.
Can we implement our own Tyranny (T) Number?
At the start of this week, for instance, the T number went above 1, meaning generally increasing tyranny. Prior to that it was 0.8. When the T number is less than one, we are still required to post cynical comments on the internet. If the T number ever surpasses 1.185429875786, then we’re fucked and must smash everything up straight away.
If this is a ‘zinger’ its a sad indictement of our education system and general knowledge base.
This sort of thing has been known for decades.
The concept of homogeneous and national ‘R’ numbers are just silly.
Virus ‘herd immunity’ is localised and continually changes as people move between groups. Certain times of year create a lot of movement; ie schools/colleges opening/closing. That changes the ‘herd immunity’ of the groups and people get colds/flu.
Also weather effects are real. Not seasonality as such but real weather, like winds, humidity etc. We exist in a sea of trillions of virus in the lower atmosphere. When the winds blow and/or humidity changes, the virus move across the globe and up and down in the atmosphere. The very idea that it requires a person getting off a plane from SA to ‘carry’ a virus infection is just bonkers.
One problem amongst many we have is that the education standards in the west have declined so much that people faced with very simplified ‘scientific’ messages , massaged to tell a bastardised story don’t know how to distinguish the truth from the lie. So now we have millions thinking they are clever by ‘understanding and repeating’ simplified B.S. that makes them ‘feel’ knowledgeable. And we know how important it is that ‘feeling’ these days.
Sad that so much energy is going into analysing a cold. How many people in SA have died of the latest version of this cold virus?
Because there is very little humanity can do to stop a virus spread longterm. Even vaccines (against flus and corona viruses) you don’t halt transmission, just limit populations with serious illness.
The hubris of the modern era is that we can control nature. We can’t, sorry. I back vaccination or at risk populations and low pore masks for the truly at risk, but aside from that, all our NDIs and such are just flailing at the sun. The good news remains that viruses prefer reproduction to killing us. Let’s hope medicines continue to be developed to help us survive the best.
One of my first thoughts about the modelling was that it appeared to assume we are all spread out uniformly like pieces on a chess board.
Now the software they use may well be slightly more sophisticated than this but I’ve not seen anything to counter my initial thoughts.
In other words, nobody’s got a fucking clue.
I do though love the proliferation of maybes, possibilities, could haves, would haves etc.in all of this clown show.
Nature will do what nature does.
But maybe in unexpected ways thanks to vaxxing everyone with a non sterilising mrna “vaccine” – lol. – GVB.
The death of humanity as we know it awaits.
Meanwhile, on a lighter note, there isn’t one.
I have been in several shops today and a few trains and compliance wasn’t much different to last week although there were fewer people on the trains. Even the old people who were wearing masks were largely wearing them around their chins, just in case they were approached or reprimanded. The proportion that looked truly frightened was very small as far as I could see.My impression was that sheer fatigue had set in.
They test more, the numbers rise, they test less, the numbers sink. Thats at least how it works here in Germany. No complicated statistics needed, is that different on the British Islands ?
I made this suggestion after a previous article-probably Noah’s March one. The sharp peaks and collapses suggest that the virus gets into a relatively connected group of people, then the epidemic collapses in that group once it has reached herd immunity.
“When infections start falling in a particular country, the Government often takes credit for having ‘gotten the R number below zero’. But if Lemoine is right, the R number may have fallen simply because the virus exhausted susceptible people in the subnetworks were it was recently spreading.
So governments may have been taking credit for fluctuations in the R number that were entirely independent of their policies”
This quote near the end of the piece seems to be right if one looks at the way the Covid figures have panned out. Unfortunately, very few of the public will read his piece or much else for that matter. The complete inability of much of the public to understand graphs and statistics is staggering and permits the Unbalanced and Witless of the world to change axis on graphs to totally change the outcome with their own bias.
“So governments may have been taking credit for fluctuations in the R number that were entirely independent of their policies.” Hasn’t that always been what sceptics have said, that based on data, no govt response has actually had any effect on the natural virus (aggregate) profile (the ‘Gompertz curve’). It’s good to know there’s now a good hypothesis for this.
We can see a clear example of this with the original mask mandate, that (i) was introduced when the (aggregate) ‘wave’ was already well into decline, and (ii) didn’t change the profile of the decline.
What this also does, as hinted at, is set fire to the Imperial and other models that have already been thrown into the rubbish bin.
Can we get a version of the graph with the empirical data, considering that comparison was made?
Regardless of a lot of waffle about simulation and modelling, the fact is, that the “facts” don’t matter one jot.
The scum running all this will use any and every type of “data”, however obtained, that they want to “justify” what they are doing.
It has been made abundantly clear that argument about the facts has no bearing on what happens in the real world, as should be totally bloody obvious from the last 21+ months and where we find ourselves now.
With every respect to the arguments made in the article, they, and any others, will have no bearing on what ultimately happens to us plebs.
I’m done.
The same sad result arrives when one person in a wide social group has to be hospitalised for a few days ( despite the fact that many others have caught Covid and survived) and his having had to have oxygen has soured the entire group against people like us, who are Covid-survived.
We are now ‘unclean’ despite having natural immunity, which is far more robust and variable than anything offered by multiple ‘jabs’.
Many of our younger acquaintances have caught Covid and have gone to bed for a few days. I know no-one of any age including our age (eighties) who has suffered anything other than minor inconvenience. I am aware of the relatives of the elderly who have been in Care Homes, and sympathetic towards their loss. But we were living a ‘normal life’, capable of looking after ourselves, doing the garden, shopping and cooking good meals. But, by Government diktat, we are now to be outliers!
One old man in hospital for oxygen for a few days – against the shut-down of a whole social group against one couple who remain steadfastly un-jabbed!
This is persecution. We have left the group!
This is not about health it’s about the impostion of a global tyranny on the back of a manufactured medical emergency .. it’s about global Chinafication
https://www.youtube.com/channel/UCLTuS6tke4344WQD-vbvUTg
Please share far and wide this video needs to go viral
NO to digital medical passes .. Do NOT Consent .. Do NOT comply