

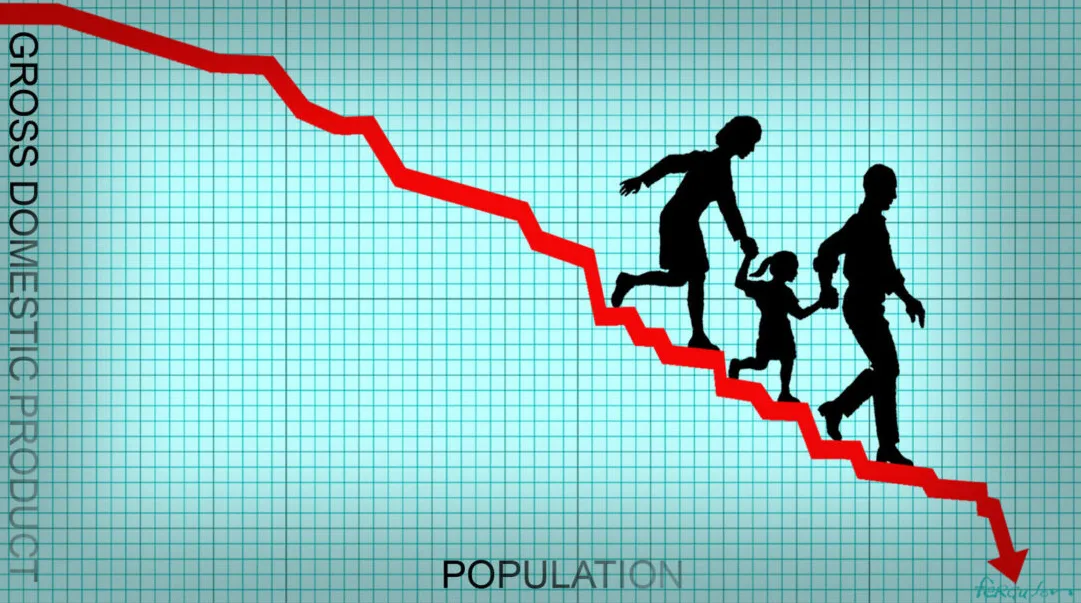
Britain has a fertility problem, a migration problem, an inactivity problem, a pensions-and-welfare problem and a public health problem. Each of these phenomena is clearly shown in the official statistics, but no attempt has been made to add them up. Still less has there been any attempt to lay out to the public the implications for future generations if these are not addressed.
In April 2026, the Office for National Statistics published its latest national population projections, based on 2024 statistics. These have a number of assumptions: that the country’s total fertility rate (TFR) flattens out at 1.42; that net immigration reaches 230,000 a year in 2027 (710,000 arrivals and 480,000 departures) and stays at that level; and that life expectancy continues to increase from 79.38 and 83.27 for men and women respectively to 82.4 and 85.95 by 2049. This results in a population of 72.4 million in 2049, which then peaks at 72.5 million in 2054, before declining slowly. The population in 2024 was officially 69.3 million, and growth by 2034 is expected to come from immigration, since deaths exceeded births as of the middle of 2026, and this is expected to continue.
This leaves us with a projected pension age population of 14.2 million by mid-2034, up from 12.4 million in 2024, even after the state pension age rises to 67. Under-16s will have declined as a proportion of the population from 18.2% to 15.5%. While this means fewer dependents, it also means a thinner pipeline of future workforce.
A growing pension age population would matter less if it weren’t for the fact that its growth outstrips that of the working age cohort, and pensioners need to be paid for. In 2024, there were 280 old-age dependents for every 1,000 people of working age; according to the ONS numbers, this is set to climb to 310 in 2034 and to 329 in 2049.
That ratio is worrying, but probably manageable – or at least, it might be if it reflected a reality in which 329 pensioners were supported by 1,000 economically active people. That is not our reality, because a growing proportion of the working-age cohort is economically inactive.
A more honest measure is the Active Dependency Ratio (ADR). ‘Working age’ is not the same as ‘working ’, and the ADR measures how many economically inactive people there are for every 100 that are economically active. On the official population path, this is set to increase from 59 in 2021 to about 71 by 2061. In simple terms, every 10 people in work will be carrying seven people not in work.
This is a much heavier lift than the pension ratio suggests. There are several traditional answers to this structural problem: higher taxes; later retirement; reduced provision; more borrowing. None of these can really address the issue. Taxes can shift the burden onto those in work, but beyond a certain point, they reduce the number of people who are prepared to work. Later retirement can only be effective if people remain well enough to stay in work. Cutting pensions and benefits might be fiscally responsible, but it is politically lethal, and it’s hard to see how it could be taken far enough to solve the problem while also providing basic minimum living standards. Borrowing is already around 95% of GDP and only defers the bill, while eating revenue with interest payments.
For the last 30 years, immigration has been part of the government solution, but if it were going to solve the underlying problem, it would have done so by now. Leaving aside the question of whether continued net migration of 230,000 (the ONS assumption) can be sustained from a societal point of view, importing today’s workers is also importing tomorrow’s pensioners. Large-scale immigration over three decades has not stabilised the dependency ratio, and nor has it brought the total fertility rate above 2.1.
The official numbers already look demanding, but they also assume that some things now going wrong will stop going wrong. In 2024 the UK total fertility rate was 1.40 (1.41 in England and Wales). The ONS central case lets it fall a little further, to 1.38 by 2029, then recover to 1.42 by 2049 and stay there. It does not say what would produce that uptick. Fertility has been falling again since the early 2010s. The 2025 rate for England and Wales, published a month after the projections, was 1.39.
It’s also no longer safe to assume that life expectancy will continue to increase incrementally. This escalator was reliable until the 2010s, and then began to slow. There was a sharp dip in 2020-21, and men have not yet returned to their 2019 peak. Years in good health is, in any case, a more useful measure than life expectancy when it comes to the dependency ratio.
Those official assumptions can be tested. In ‘Vision 2061: The Arithmetic We Cannot Ignore‘, the Truth Contract keeps the ONS migration figure of 230,000 so the comparison is clean, and asks what happens if the other trends do not recover.
It starts from the 2025 fertility rate of 1.39 and lets it keep falling, by 0.01 a year, to 1.03 in 2061. It starts from 2024 life expectancy and lets that fall by a month a year. It lets age-specific participation rates end 10 percentage points below the official path. All of these are well within the bounds of possibility. The result is a smaller population, but crucially, a worse support ratio: 102.76 inactive people for every 100 active. That is: more dependents than workers. This is a downside case, rather than a forecast, but it suggests a situation that will be nearly impossible to manage while maintaining any meaningful level of social support for those dependents, together with a decent quality of life for those working.
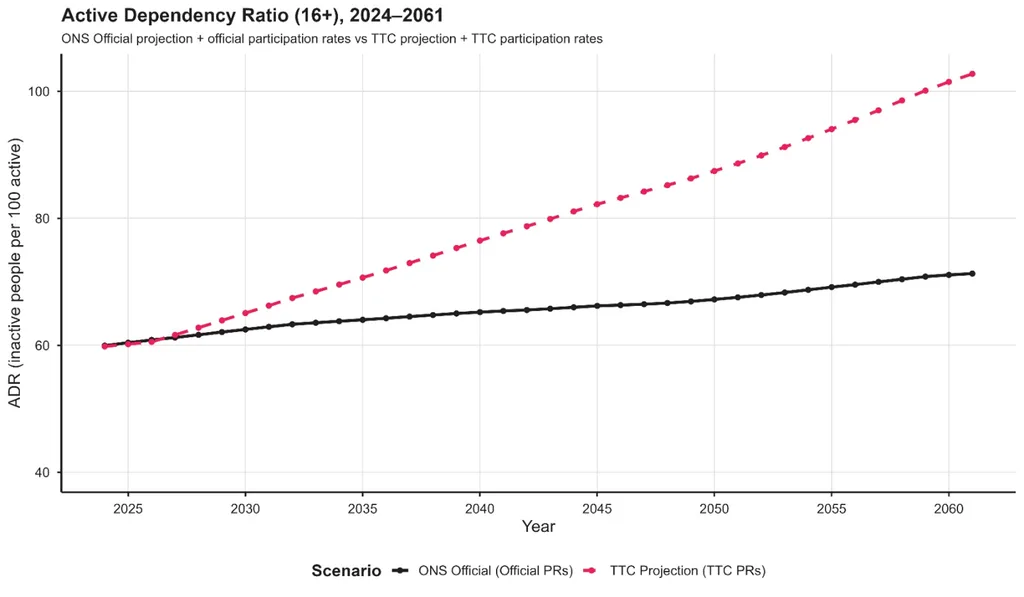
If this is the direction of travel, the choices implied by the official ONS path would arrive sooner and much harder. These would be higher taxes on a smaller tax base, later retirement, thinner pensions, lower levels of healthcare or more borrowing on a debt stock already at 95% of GDP. This would leave even less money available to be spent on those things that might improve the dependency ratio – health, skills, infrastructure and innovation.
This looks very much like a future that we should want to avoid. If we do, then what might be done? The near-term levers are health, participation and productivity: more years spent well enough to work; more people able and expected to work as the labour market changes; far more value from each hour worked. Higher fertility would help the age structure, but not for 20 years. Migration at the official scale does not close the gap, and tax and debt do not create capacity.
Those levers only work if they are treated as a single whole problem. Today, each of them is viewed as a separate issue, to be dealt with by separate departments. Moreover, election-cycle politics means that this remains someone else’s problem to deal with, with very little incentive to start addressing the issues now. A 35-year outlook is outside the perspective of Westminster.
This is not a prediction. Leaving the arithmetic unexamined is still a choice.
David C.M. Carter is the founder of the Truth Contract and Vision 2061. The full method for the statistics presented in this article and the official-versus-alternative projections are in ‘Vision 2061: The Arithmetic We Cannot Ignore‘.



Discussion
Comments
This week across the site:
To join in with the discussion please make a donation to the Daily Sceptic.
Profanity and abuse will be removed and may lead to a permanent ban.