

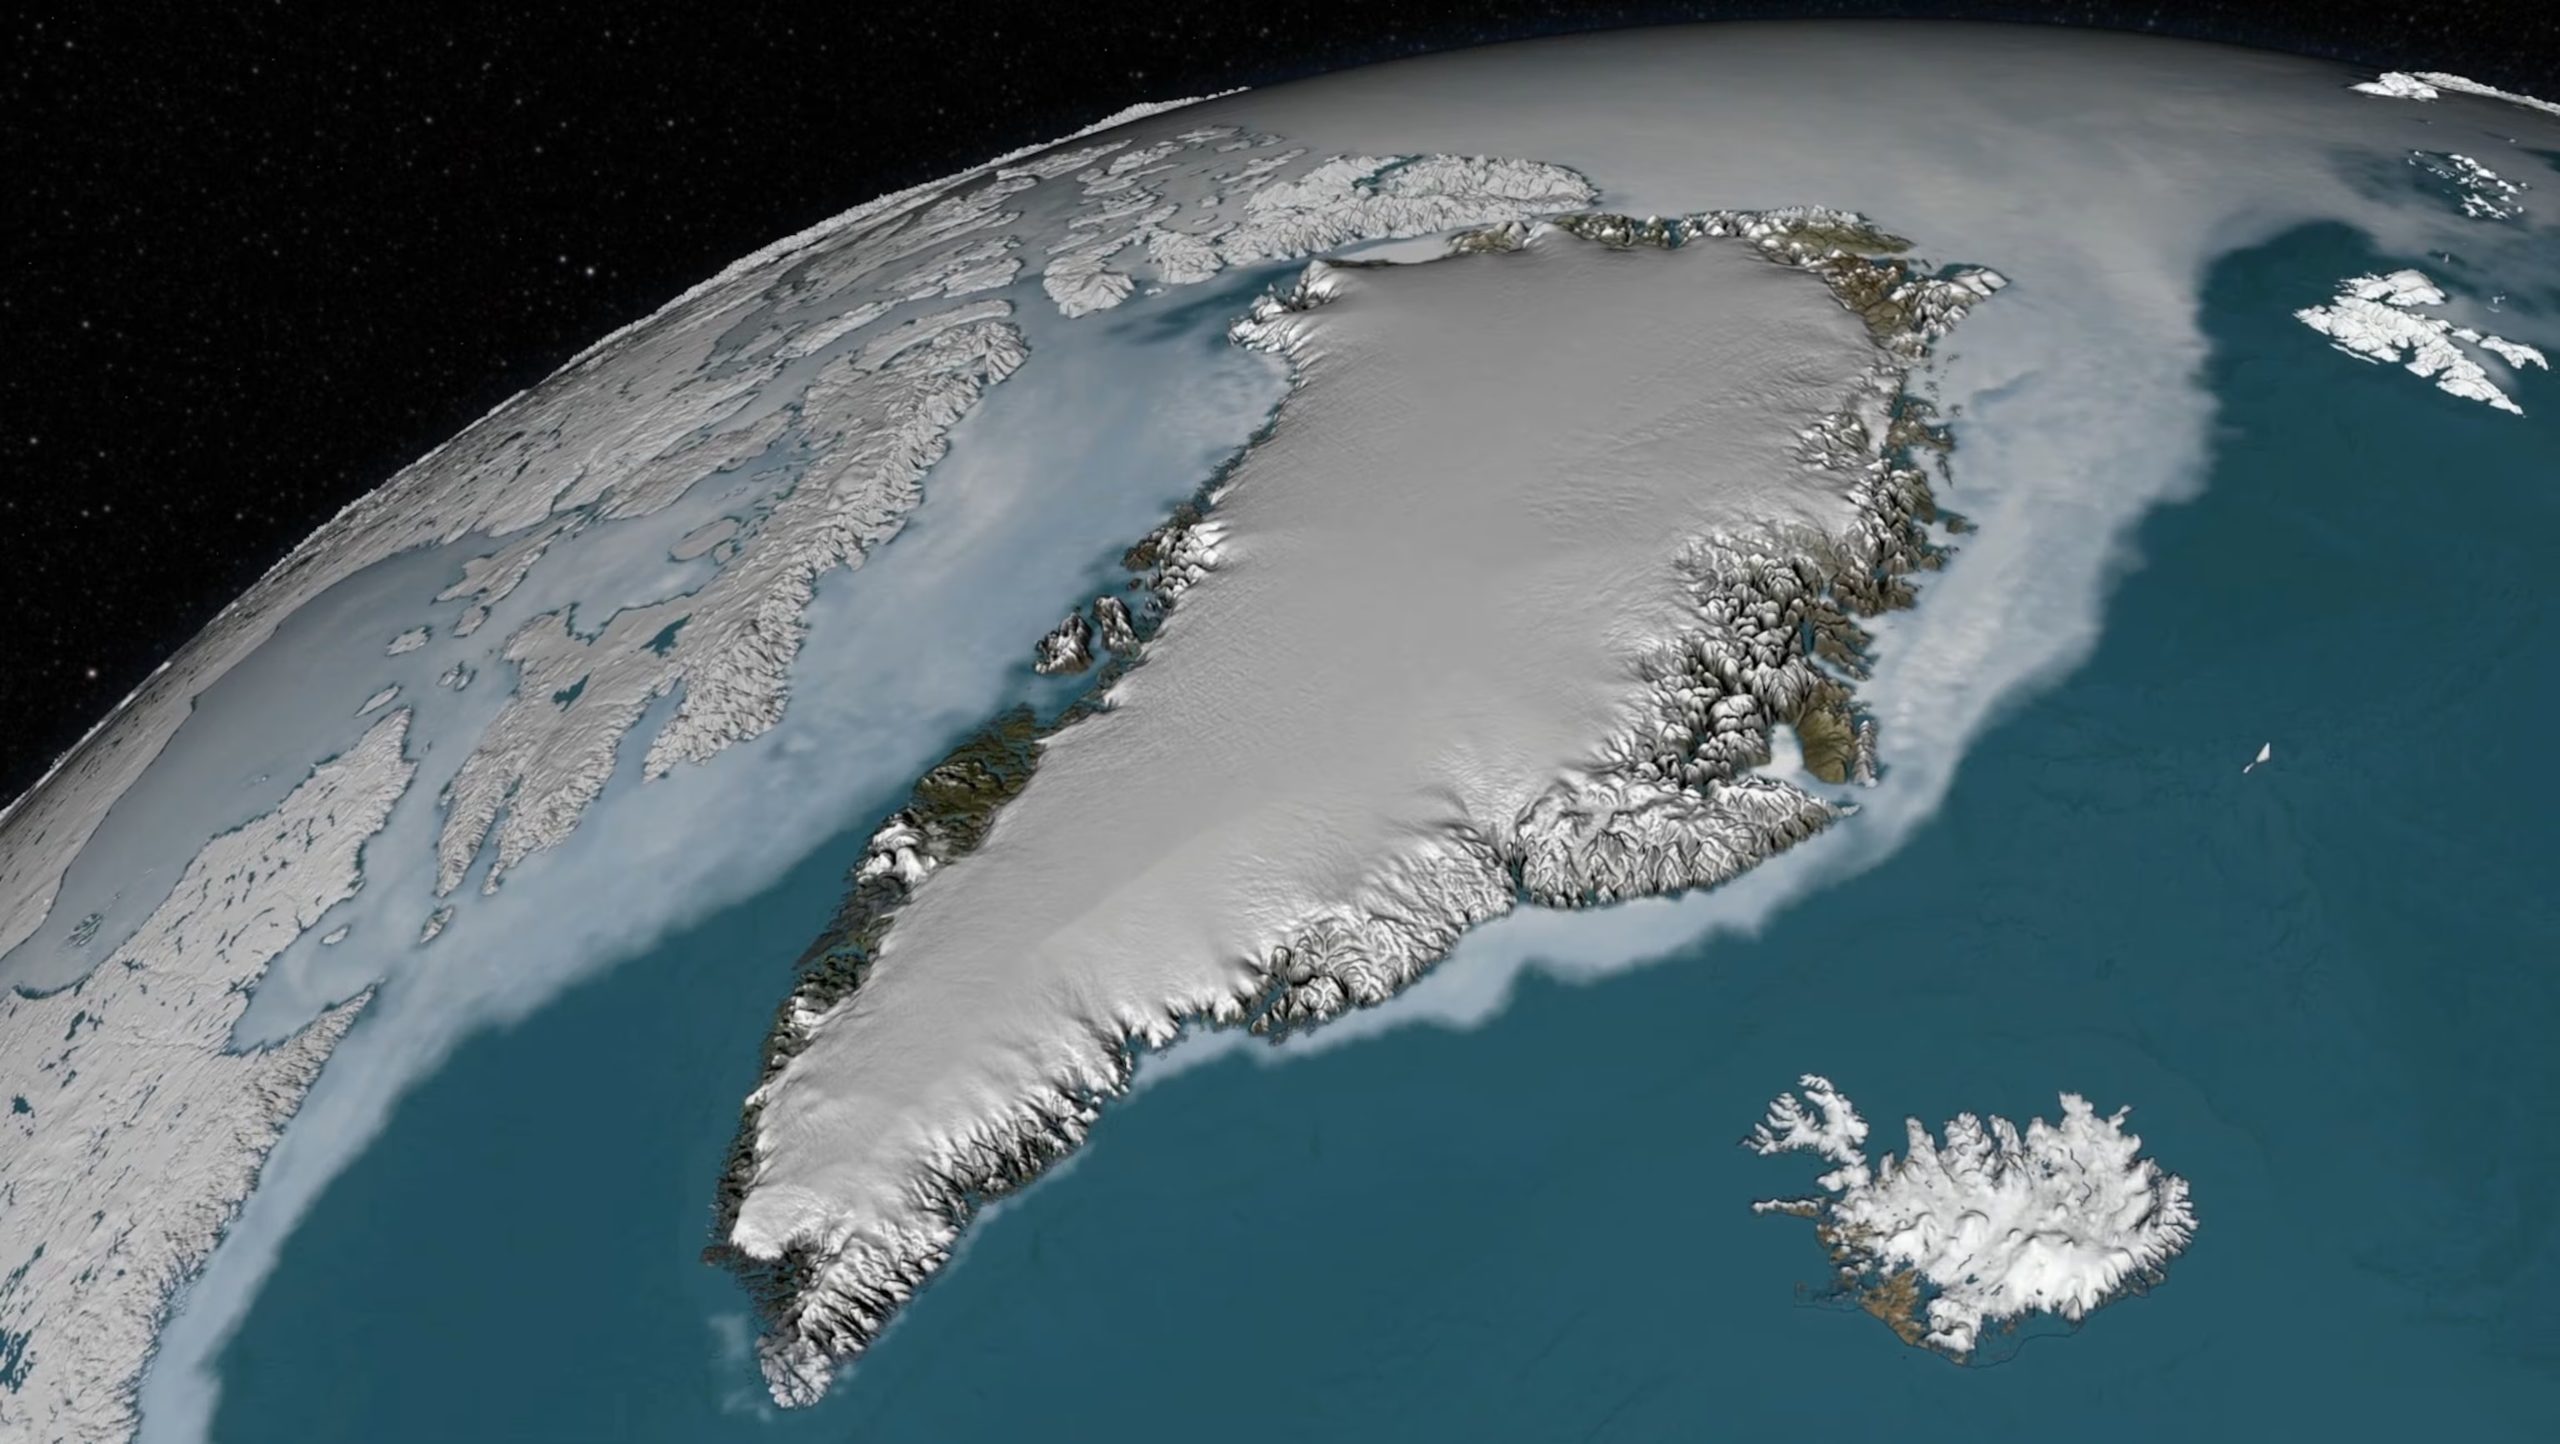
Greenland’s icecap is melting away thanks to global warming, at least that is what we are told. According to the EU’s European State of the Climate 2025 Report, the ice sheet lost 139 Gt last year. They say that is equivalent to about 1.5 times the amount of ice stored in all the glaciers in the European Alps, and raised global mean sea level by 0.4 mm. (A gigatonne is one billion tonnes.) Since 1972, losses have amounted to 5,747 Gt. The rate of ice loss has increased by around five times since the 1980s and is expected to continue increasing beyond the end of the century.
These amounts sound terrifying, which is of course the object of the exercise – at least until you realise that at present rates it would take Greenland 27,000 years to melt away.
I am always suspicious when ‘scientists’ present trends since the 1970s, a time when the Earth had gone through three decades of cooling and there were genuine fears among both scientists and world leaders about the return of the Little Ice Age. I am even more suspicious when I discover that official data about the Greenland ice sheet is publicly available back to 1840.
In 2021, a peer-reviewed study calculated the annual changes in the ice sheet mass balance since 1840. (The heavy black line represents the net changes, which is of relevance to this discussion):

The graph confirms that the ice sheet has been losing mass since the 1980s. But crucially, we can see that the melting began around 1900. During the period 1920 to 1970, ice loss was running at similar levels to the last three decades – this is hardly surprising, as temperature records across Greenland show that it was just as ‘warm’ then as now. In between times, there was a sharp decline in temperatures in the 1970s and 80s.
In other words, this is not a new phenomenon, as we are expected to believe. It is part of a much longer process, which began long before so-called man-made global warming began.
Scientists have long established, with the help of ice cores and other evidence, that the 19th Century was probably the coldest era in Greenland since the Ice Age. During warm eras, such as the Middle Ages, Roman times and earlier millennia, the ice cap was smaller than it is now. Any reduction in the ice cap in the last century must be viewed as part of these longer-term cycles.
Ice mass data is still regularly published and provisional data is now available for the year ending August 2026 – Greenland ice data is normally presented by “hydro-year”, September to August.

Since the 2021 study, ice loss has continued to slow down and is back to 1920s levels. The 2025/26 season actually saw a small increase of 6 Gt in ice mass. Greenland never really had a summer this year. Whereas the summer melt usually begins in early June, cold, snowy weather persisted well into July. As a result, summer melt was around 200 Gt less than normal.
It is worth noting that the poor summer in Greenland was part of the wider jet stream setup, which brought our hot summer. While we had a summer dominated by high-pressure systems, the rainy weather stayed out in the Atlantic, battering Greenland.
6 Gt is of course a tiny amount, given the massive uncertainty in how these things are calculated. There is no way to directly measure ice cap changes; instead, the numbers are calculated from computer models fed with data such as precipitation and temperature. The experts accept that they can often be wrong by as much as 100 Gt.
Nevertheless, it is abundantly clear that Greenland’s icecap is doing just fine. It is still much larger than it has been for most of the last 10,000 years and, if it is shrinking at all, it is doing so no faster than a century ago.



Discussion
Comments
This week across the site:
To join in with the discussion please make a donation to the Daily Sceptic.
Profanity and abuse will be removed and may lead to a permanent ban.
I thought the Atlantic jet stream was supposed to collapse this year – how come it’s still influencing our weather?
I think they are hedging their bets to make sure they win both ways. There is no indication in the long scale temperature records that the large glacial cycles have ended and we may have between 100 to 1,000 years before we get a clear indication that temperatures are on their way down into the next glacial expansion. There was a strong hint with the Little Ice Age. The claim that global warming will bring on the next ice age by collapsing the Gulf Stream sounds like a way of making sure that any cooling can be blamed on warming.
I liked this bit:
“…and raised global mean sea level by 0.4 mm”.
Another preposterous metric. I can’t even hold my finger and thumb together to estimate that distance, or even see it without my glasses on.
According to the graphical data provided by https://polarportal.dk/ this year Greenland ended the year with roughly 520 gt of ice. Every year Greenland gains about 600 gt of ice and every year it loses about 200 gt of ice, so that net gain is about 400 gt. [https://polarportal.dk/en/greenland/surface-conditions/]
I have noticed that the climate catastrophists only mention the ice loss which happens in only 3 months. Of course glaciers are calving all the time but why wouldn’t they considering the weight of ice pushing down and out from the centre of Greenland?
An inconvenient truth?…
“much larger than it has been…”. looks good, but don’t let Trump know!
But the UN has shrunk it by changing the map projection, and made Africa larger just in time to demand reparations for slavery that was mostly visited on Africans by other Africans.
The Ice Caps are Melting