

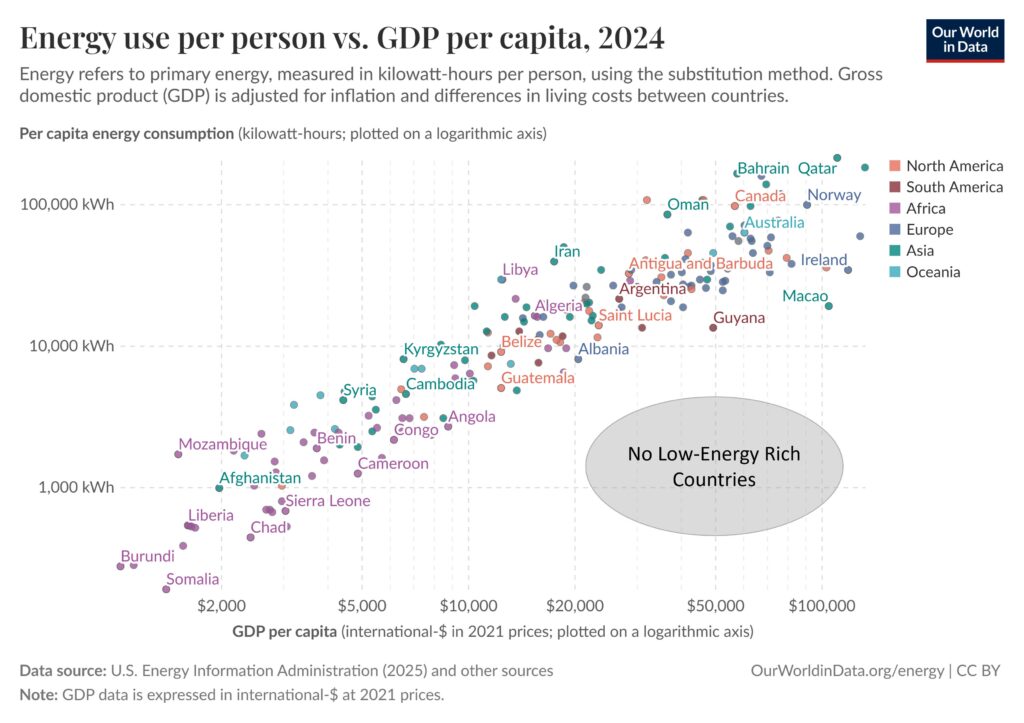
One of the big reasons why Britain has stopped growing is energy. As Figure 1 (taken from Our World in Data) shows, there are no rich countries with low energy use.
Energy is fundamental to the functioning of a modern economy. Primary industries such as steel-making, aluminium smelting, chemicals, ceramics and petrochemicals are highly energy intensive and require cheap and abundant energy to be competitive. More modern service industries such as AI are also energy intensive and have led the big tech companies to scramble for energy to power their giant data centres. For instance, Microsoft has entered into an agreement with US utility Constellation to re-open the Three Mile Island nuclear power plant. Even relatively humble service industries like food delivery rely on energy to be effective. The UK cannot hope to be a thriving, growing economy without cheap, reliable and abundant energy.
Legislating for energy suicide
Unfortunately, a vast array of legislation and regulations to enforce Net Zero has led to constrained energy supply, high energy prices and a vast regulatory burden that impacts industry, as summarised below.
The legislative labyrinth began with the Gas Act 1986, which gave powers to the Secretary of State to impose mandatory carbon emissions reduction targets on gas transporters and suppliers. This legislation has since been strengthened through various measures including two Acts in 2000. The Utilities Act introduced the Renewables Obligation (RO) to force electricity suppliers to procure a certain percentage of their electricity from renewable sources. The Finance Act introduced the Climate Change Levy (CCL), which is a tax on energy use by businesses. Effectively, the CCL increases the cost of fossil fuels and hence operating costs for businesses, although some relief is available to businesses through Climate Change Agreements. The Finance Act 2011 amended the CCL legislation and introduced the Carbon Price Support mechanism, which is designed to top up the carbon price paid by electricity generators alongside the EU or UK Emissions Trading Scheme – yet another tax on energy.
The Energy Act in 2008 introduced Feed-in Tariffs (FiTs) and in 2013 effectively replaced the RO scheme with Contracts for Difference (CfDs) to drive extra spending on renewables. However, the most significant piece of legislation in 2008 was the Climate Change Act (CCA), which imposes the legal duty of the Secretary of State to set the carbon target for 2050. Originally this was an 80% reduction compared to the 1990 baseline, but was amended in the last days of the May Government by the 2050 Target Amendment Order 2019 to a 100% reduction. The CCA also created the Committee on Climate Change (CCC), which effectively sets carbon budgets every five years to achieve the target.
Environmental legislation forces government to set long-term targets in four priority areas: air quality, biodiversity, water and waste reduction. These targets are designed to align with and support the UK’s broader Net Zero strategy by driving systemic transformation across the economy. This environmental legislation, together with extra legislation on the NHS, means the public sector is tasked with imposing Net Zero on the rest of us. Pension legislation forces trustees to identify, assess and manage climate-related risks and opportunities to drive capital towards Net Zero-aligned investments. Environmental Impact rules force assessment of climate factors including greenhouse gas emissions as well as indirect, secondary, cumulative and long-term effects. This means including so-called Scope 3 emissions, such as the emissions from burning the hydrocarbons produced from an oil or gas field.
Additional legislation forces companies and limited liability partnerships to ensure that climate risk is not just an ESG footnote but a central component of their financial reporting within their strategic report.
Tangled web of subsidies
The legislative labyrinth has led to a tangled web of subsidies designed to force expensive and intermittent renewables on to the grid. The Government periodically updates the Subsidy Control Transparency database, which estimates the cost of all subsidies.
Analysts have calculated the total cost of Net Zero and energy-related subsidies at £585 billion over many years. This includes £260 billion of renewable energy subsidies across Renewables Obligation Certificates (ROCs), Contracts for Difference (CfDs) and Feed-in Tariffs (FITs). There is a further £44 billion to fund the Renewable Heat Incentive (RHI), which is essentially a scheme to incentivise farmers to burn wood to heat empty sheds.
As well as being expensive, wind and solar renewables are of course intermittent, so there is a need to pay for backup when the sun is not shining and the wind is not blowing. The Government has created the Capacity Market to provide this backup and encourage investment in new reliable power stations, with a subsidy estimated at £72 billion.
Subsidised renewable electricity is too expensive for industry, so there is another set of subsidies to compensate for high energy prices. The British Industry Supercharger Package for energy intensive industries (EIIs) has been calculated to cost £51.4 billion. This is designed to provide “electricity price support” to around 370 energy intensive businesses in sectors such as steel, paper and batteries.
There is an additional set of subsidies for carbon capture and storage (CCUS) that make reliable power generation from gas less efficient and thus more expensive. £30 billion has been allocated to the Dispatchable Power Agreement Business Model and another £16.7 billion for the two carbon capture business models, split equally between the Industrial Carbon Capture Business Model and the Waste Industrial Carbon Capture Business Model. In addition, £13 billion has been allocated to the CCUS Transport and Storage Regulatory Investment model.
Another £3 billion has been set aside for another thermodynamic war crime – green hydrogen. £2.3 billion is forecast to be spent on the Hydrogen Production Business Model (also called HAR1), with another £589 million on Hydrogen Transport hubs. The balance of the £3 billion comprises various funds, accelerators and innovation schemes.
This tangle of subsidies adds costs to the whole economy, and further costs are added through additional subsidies designed to mitigate the impact of the first set of subsidies.
Hydrocarbon taxes
To meet the carbon budgets set by the Climate Change Committee, the UK must reduce consumption of hydrocarbons – coal, oil and gas. To that end, punitive taxes have been imposed on both their production and consumption.
Production taxes include the Ring Fence Corporation Tax, the Supplementary Charge, Petroleum Revenue Tax and the Energy Profits Levy. These taxes, combined with the moratorium on fracking and Ed Miliband’s ban on new exploration licences in the North Sea, have accelerated the decline in domestic production and made the UK more reliant on imports (see Figure 2, using data from UK Energy Trends).
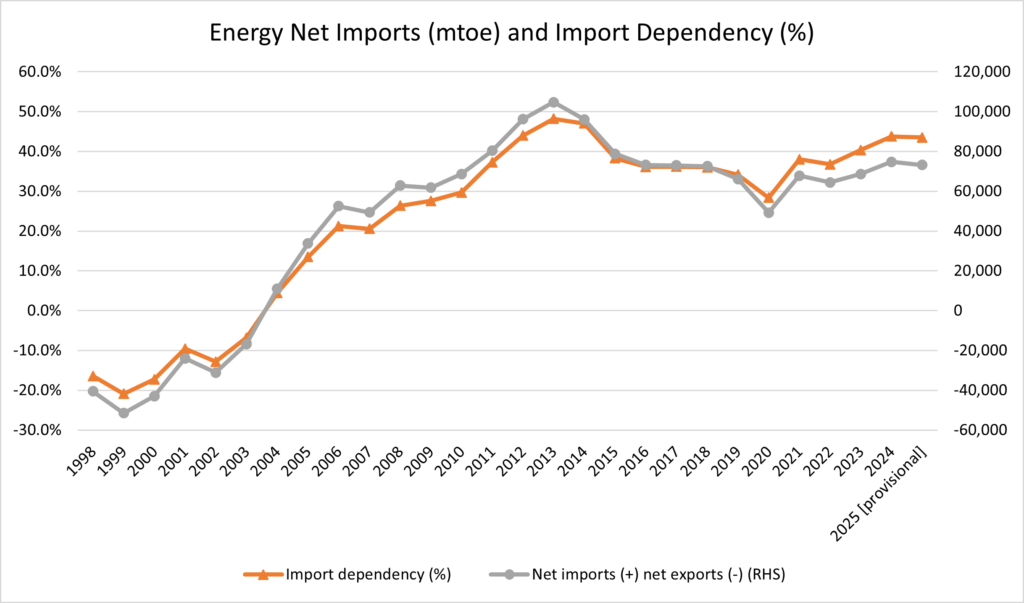
The production decline has led the OBR to forecast that oil and gas tax revenues will fall from £9.9 billion in 2022/23 to just £0.3 billion in 2030/31. The impact of declining oil and gas production on the rest of the economy is discussed in more detail below.
Hydrocarbon consumption taxes are classified as environmental taxes by the ONS, many of which can be characterised as consumer taxes on energy. These include direct taxes on fossil fuels that raised a total of £42.7 billion in 2024, including the following:
- Fuel duty, a tax on petrol and diesel: £24.6 billion.
- Emissions Trading Scheme, essentially a tax on burning hydrocarbons: £4.1 billion.
- Climate Change Levy (CCL): £1.8 billion.
In addition, there are indirect taxes on fossil fuels that raised even more money in 2024:
- Transport taxes such as Motor Vehicle Duty paid by businesses and households: £8.1 billion – until recently this tax did not apply to electric vehicles.
- Air Passenger Duty, a tax on flying: £4.2 billion.
As can be seen below, the combination of subsidies for renewables and taxes on hydrocarbons conspires to make UK energy prices some of the most expensive in the developed world.
High Electricity Prices
Government statistics produced by the International Energy Agency (the other IEA) show the UK has the highest industrial electricity prices in the developed world (see Figure 3).
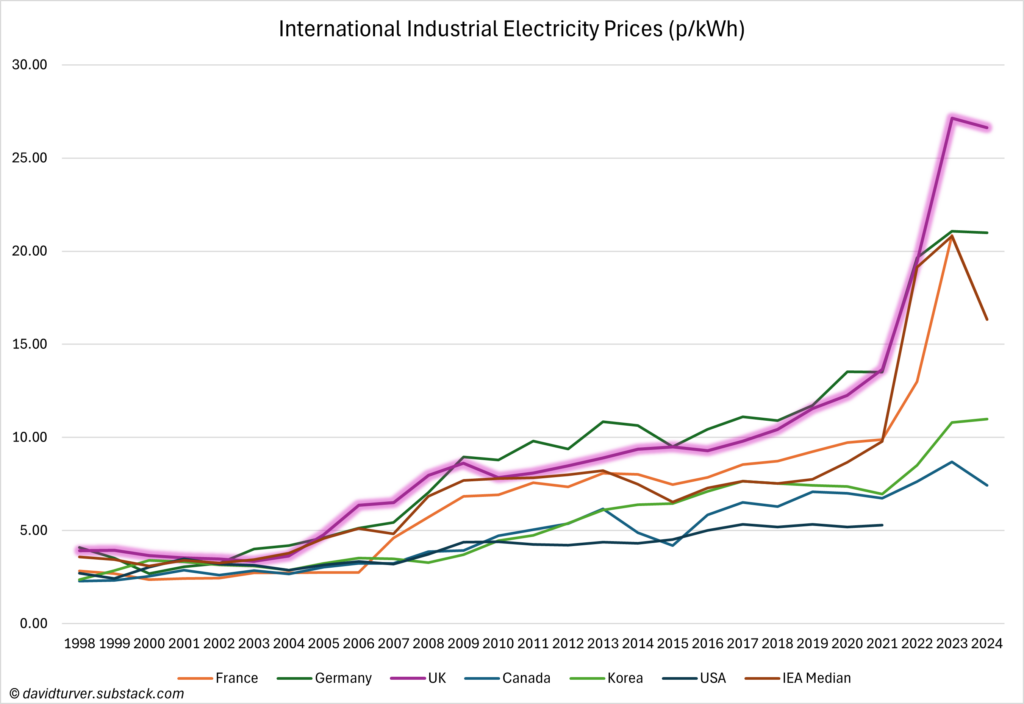
Note that UK industrial electricity prices were around the IEA median from 1998 to 2005, but since 2014 the gap has widened so UK companies paid 63% more than the IEA median in 2024.
It is fashionable to blame the UK’s high electricity costs on the price of gas, but Figure 4 shows that although UK gas prices are well above those in Canada and the US, they are marginally below the IEA median.
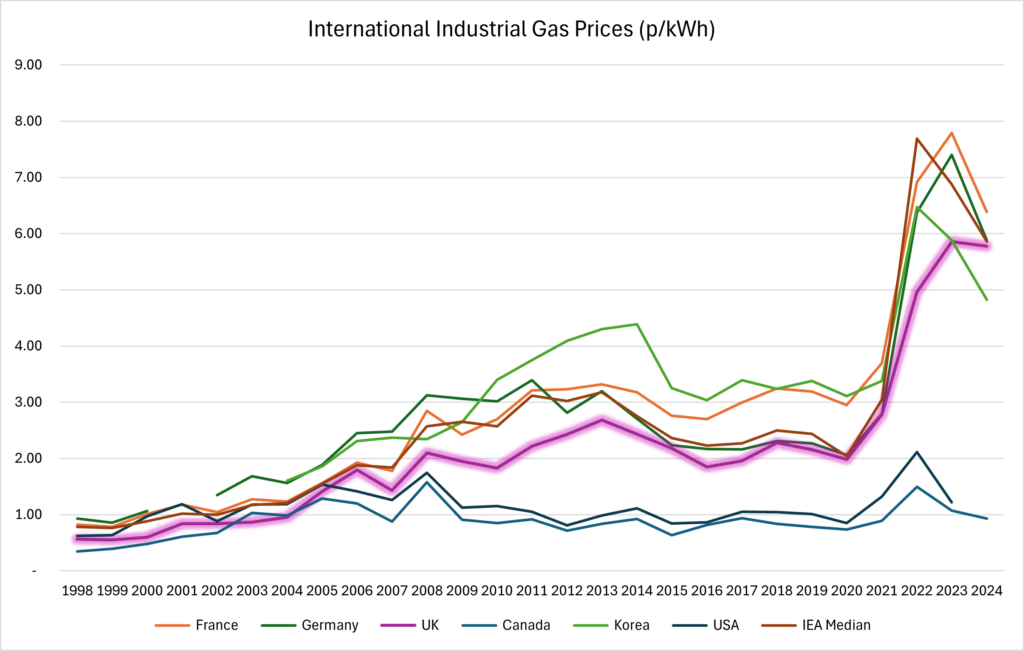
It is clear that it is not just gas that is driving UK electricity prices. Figure 5 plots the share of electricity supplied by source against gas and electricity prices.
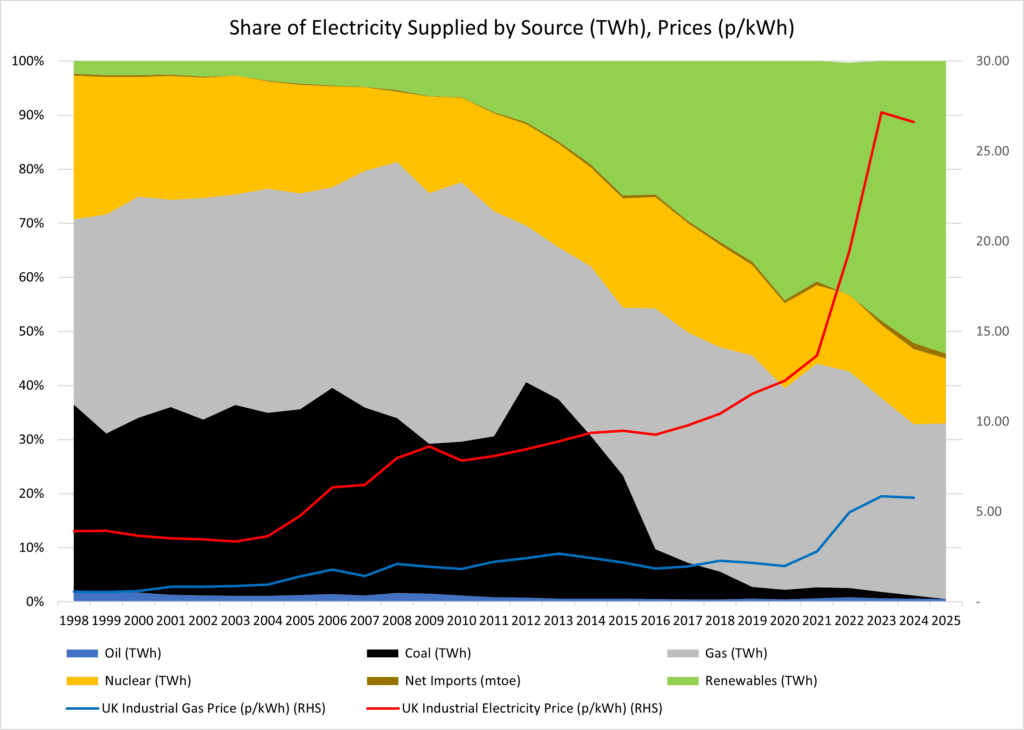
We can see that gas prices remained relatively stable around 2p/kWh from 2008, the year of the Climate Change Act, to 2021 but electricity prices rose more than 50% from under 8p/kWh to over 12p/kWh. During that period, the share of renewables (defined as hydro, bioenergy, wind and solar) went up from just over 5% to over 37% of electricity supplied. From 2022 onwards, the energy crisis that began before the war in Ukraine caused gas prices to more than double and electricity prices followed suit.
The impact on electricity prices from renewables subsidies, taxes on hydrocarbons and the hidden backup, grid balancing and expansion costs can now be examined in more detail.
The price of gas-fired electricity generated is also inflated by carbon costs. Figure 6 shows the fuel and carbon costs and the carbon costs as a share of the total, using data from Ember.
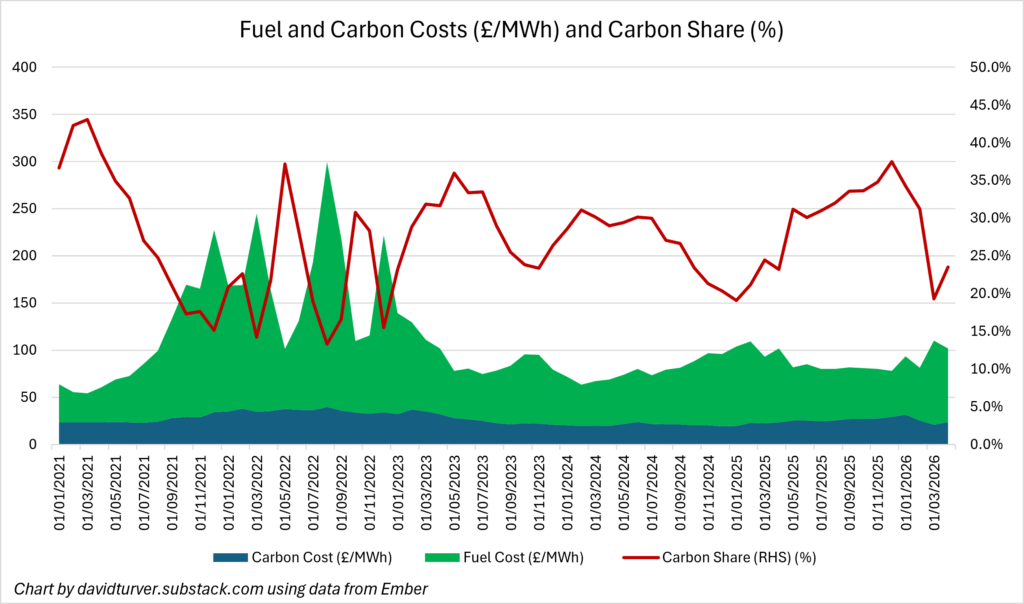
Carbon costs comprise two elements. The first is the Carbon Price Support (CPS) mechanism, where prices have been held at £18/t since 2018. The CPS is due to be abolished in April 2028. The second is the carbon cost arising from the UK Emissions Trading Scheme (ETS), and these costs fluctuate considerably.
The total carbon costs fluctuated in a £35–40/MWh range from the beginning of 2022 to March 2023 before falling steadily to under £20/MWh in February 2024. Carbon costs then fluctuated in the £20–25/MWh range until April 2025 and then began to rise to £31.99/MWh in January 2026 following Prime Minister Starmer’s announcement to align the UK and EU ETS schemes. Carbon costs as a proportion of total costs reached a record 37.5% in December 2025. More recently, ETS costs have fallen because Chancellor Merz called for the scheme to be reviewed. These carbon costs artificially increase the cost of gas-fired electricity. Ironically, they also increase the cost of renewable electricity subsidised by Renewable Obligation Certificates (ROCs), because these generators receive their subsidies in addition to the market price of electricity – mostly set by gas.
Impact of renewables subsidies
As described above, there is a range of subsidies for renewables that further increase electricity prices. ROC-funded generators are awarded certificates for each unit of electricity generated in addition to the market price they receive for their output. Accordingly, electricity from these generators will always be more expensive than market rates, often set by gas. Even though this scheme is closed to new participants, the OBR shows the RO scheme cost £7.8 billion in 2024–25 and the cost is forecast to rise to £8.3 billion in 2026–27. About three-quarters of the cost of the RO scheme has been temporarily moved from domestic electricity bills to general taxation from April 1st 2026. The cost of the RO scheme has not been removed from industrial electricity bills, but has been mitigated by various relief schemes.
Feed-in Tariffs (FiT) are paid mostly to small solar installations. FiT generators are paid a fixed amount to generate electricity plus a smaller amount for the power they export (or are deemed to export) to the grid. Again, this scheme is closed to new entrants; however, analysis of Ofgem’s latest report into the FiT scheme shows it cost £1.8 billion in 2024–25, or around £229/MWh – three times more than the market rate for CfDs in the same period of about £76/MWh.
Finally, there is the Contract for Difference (CfD) scheme used for the now-annual renewables auctions. Here, generators receive a fixed amount for the power they generate. They receive the market value – called the reference price – for their power and are then paid a top-up to the strike price of their contract. If market prices are above the strike price, they must pay back the difference. Analysis of data published by the Low Carbon Contract Company shows the CfD scheme cost a record £2.96 billion in 2025/26. The generation-weighted average strike price of electricity funded by CfDs was about £152/MWh in 2025/26 – more than double the £71/MWh average reference price for intermittent renewables. The cost of this scheme is likely to rise given the high prices offered on 20-year index-linked contracts in the recent Allocation Round 7 (AR7) auction of new capacity.
The cost of all renewables under these schemes is higher than gas-fired electricity and much higher than gas-fired electricity unencumbered by carbon costs. The total cost of these subsidy schemes amounts to £12.5 billion per year, as shown in Figure 7.

According to the latest Energy Trends data, we used 16.24 million tonnes of oil equivalent gas for electricity in 2025. This equates to about 188.9TWh of gas used to generate 91.6TWh of electricity, or 31.5% of total generation. At an average cost of 83p/therm or £28.33/MWh, this equates to a total fuel cost of £5.4 billion or £58.43/MWh. Renewables subsidies alone of £12.5 billion cost more than twice as much as the fuel for gas-fired generation. On a per-MWh basis, renewables subsidies alone cost about £82/MWh – more than the fuel for gas-fired generation. The full cost of gas-fired generation will include an allowance for recovery of capital expenditure, but renewables remain far more expensive than electricity from gas unencumbered by carbon taxes.
Extra costs of renewables
However, subsidies do not represent the full cost of renewables. Because wind and solar are intermittent, their output can fluctuate significantly, meaning that sometimes they produce less than expected. At other times, wind and solar can produce more than demand – or more than the grid can handle – and wind farms are paid to curtail their output. The grid must always be balanced, so gas generators are paid to fire up to compensate. NESO produces Monthly Balancing Services Summary reports, and the data for 2024/25 shows the cost of this service was £2.7 billion. In addition, according to the OBR, backup through the capacity market cost £1.3 billion in 2024/25.
If we attribute the balancing and backup costs to intermittent renewables (allowing an inflation-adjusted £750 million for the cost of balancing before renewables), the full cost of renewables can be seen in Figure 8.
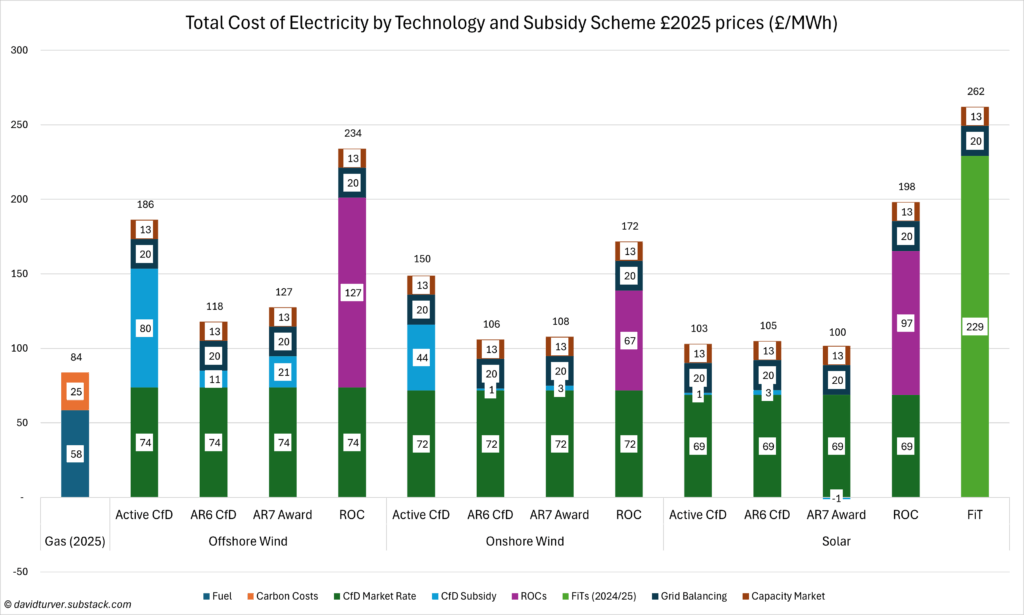
The cost of grid balancing adds about £20 to the cost of intermittent renewables and backup from the capacity market about £13, together adding £33/MWh. The full cost of active CfDs for offshore wind – including the strike price plus grid balancing and backup in 2025 – was £186/MWh, onshore wind £150/MWh and solar £103/MWh. All these technologies were considerably more expensive than gas, even with a carbon tax added. The full cost of new capacity in the recent allocation rounds, AR6 and AR7, is also much higher than gas-fired power. It should be noted that the index-linked contracts in AR7 have been extended to 20 years, so bill-payers will be paying more for longer. Renewables subsidised by ROCs and FiTs are even more expensive.
These extra costs are going to worsen considerably. NESO forecasts balancing costs to rise to £6.4–£8.3 billion by 2030 and the OBR forecasts Capacity Market costs to rise to £4.4 billion per year in 2030/31. We can therefore expect these extra costs of renewables to triple to over £12 billion by 2030 – again more than twice the current cost of gas used to generate electricity.
In addition, because renewables are geographically dispersed, they require extra spending on transmission lines to connect them to the grid. Ofgem has recently approved an initial £8.9 billion of spending on the high-voltage electricity network, describing it as the first step of an £80 billion programme to boost network capacity. It estimates this will add a further £74 to domestic electricity bills. NESO’s Clean Power 2030 plan explained this money will be spent on 1,000 km of new onshore and over 4,500 km of offshore cables. Most of this spending is clearly required to connect remote renewables and should therefore be classified as a cost of renewables.
When giving evidence to a recent ESNZ Select Committee, Rachel Fletcher of Octopus Energy explained that electricity bills would be 20% higher in four or five years’ time even if wholesale prices – largely set by gas – halve. Chris Norbury, Chief Executive of E.On UK, delivered a similar message when he said that even if wholesale prices go to zero, bills would remain where they are today because of the increase in non-commodity costs.
The evidence that renewables subsidies, carbon taxes and the additional backup, grid balancing and expansion costs are driving electricity prices higher is overwhelming.
Declining energy and electricity consumption
The combination of high energy prices and the legislative burden has led to a steady reduction in both overall energy use and electricity generation as shown in Figure 9, using data from Our World in Data.
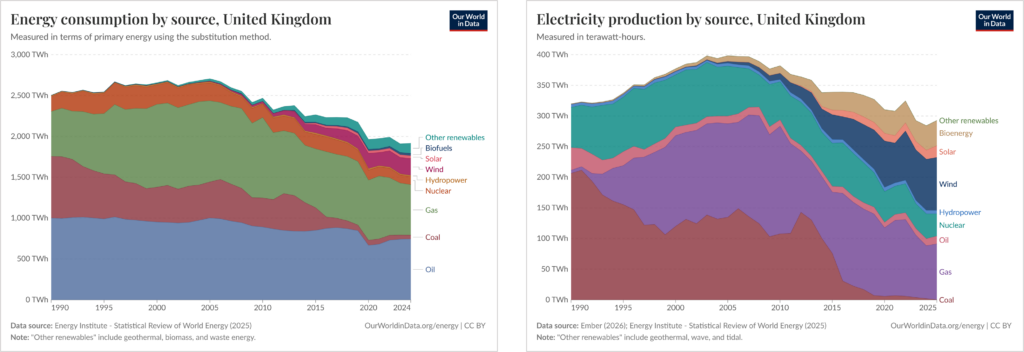
Overall UK energy consumption is down 29.2% from its peak in 2005 and domestic electricity generation is down 26.5% from its peak, also in 2005.
Slightly different data from UK Energy Trends, illustrated in Figure 10, shows final energy consumption down 20.3% overall since peaking in 2004.
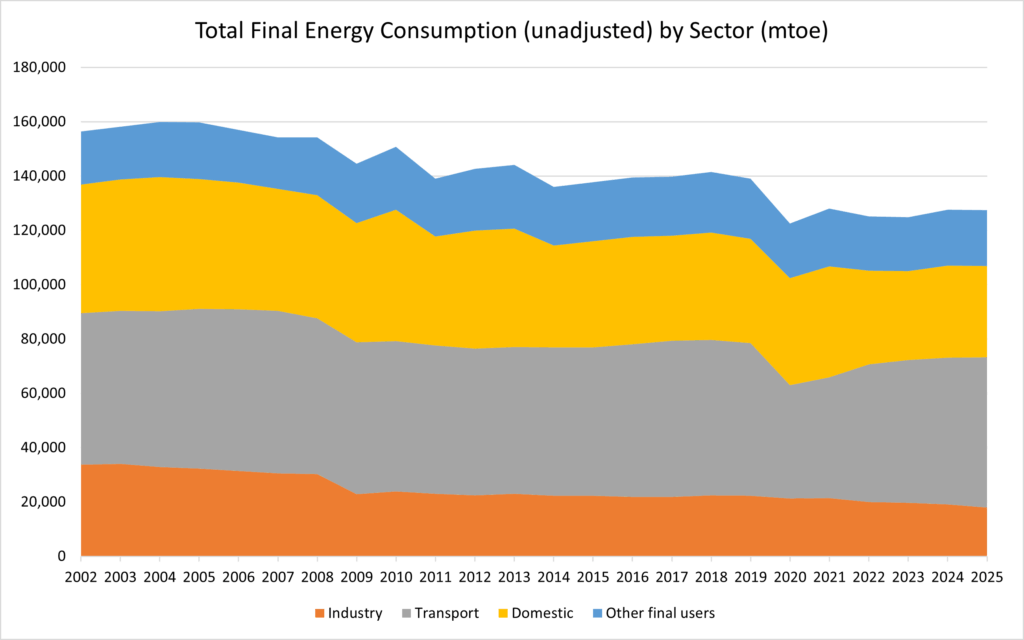
The detailed sector data show industrial consumption is down 45.3% since the peak total consumption in 2004. Domestic consumption is down 32%. Transport energy consumption is down a more modest 3.6% and other users (mostly service industries) are up a modest 1.3%. It is hardly surprising the economy is struggling to grow when industrial energy consumption is collapsing.
Impact on growth and productivity
The impact of expensive, scarce energy in causing a drag on growth is demonstrated in Figure 11, using data from OWID. The chart compares the change in per capita energy consumption to the change in GDP per capita over the period 2008 to 2024.
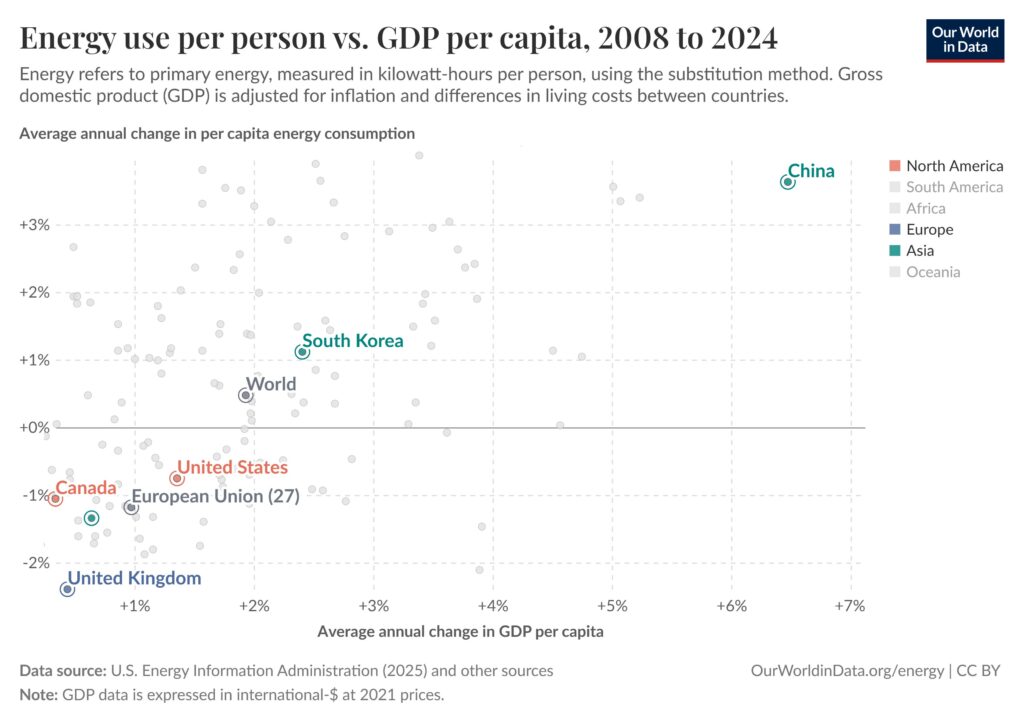
The UK has reduced energy consumption by 2.4% per annum – more than Canada, the EU27, Japan and the United States. As a result, GDP per capita has virtually stagnated, growing at just 0.4% per annum, lower than the EU27 and all other G7 countries except Canada. By contrast, world GDP per capita has been growing at close to 2% per year and energy use per person has increased by about 0.5% per annum. Asian countries such as South Korea and China have increased energy use even faster and have accordingly grown much faster. The UK’s energy consumption per person is now lower than many poorer countries, including Belarus, Bulgaria, Kazakhstan, Malaysia, Poland and Turkmenistan. The UK economy will at best stagnate if the current energy austerity policies are maintained.
The reduction in energy consumption – particularly in industry – has also taken its toll on productivity. Using ONS data, Figure 12 analyses the period from the beginning of the Climate Change Act in 2008 to 2024.
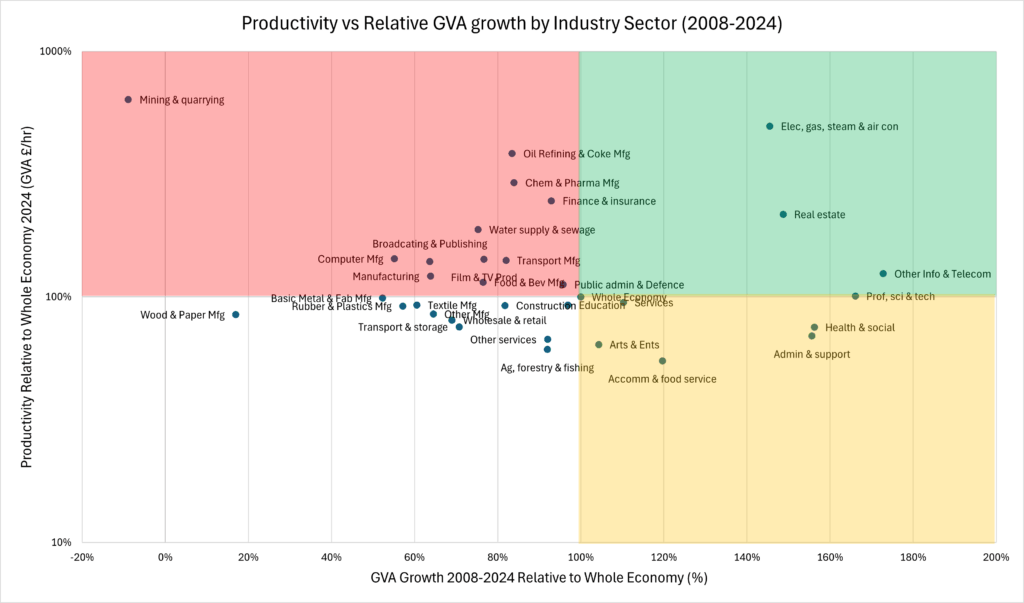
The x-axis shows the relative growth rate of different industry sectors over the period. The mid-point of 100% represents the whole-economy growth rate over the period. The y-axis shows the relative productivity of each sector in 2024 on a log-scale, with the mid-point of 100% representing the whole economy.
The chart is divided into four quadrants. In the white quadrant, sectors such as wholesale and retail, agriculture, forestry and fishing, and transport and storage are all growing more slowly than the whole economy and have below-average productivity measured by gross value-added per hour worked.
The yellow quadrant shows sectors such as accommodation and food service, health and social care and arts and entertainment growing faster than the whole economy yet with lower than average productivity.
The green quadrant shows sectors such as real estate and information and telecommunications growing faster than the whole economy with above-average productivity.
Finally, the red quadrant shows sectors with above-average productivity growing more slowly or shrinking in absolute terms compared to the whole economy. The manufacturing sector has grown at two thirds the rate of the whole economy, but the sector’s productivity stands at 122% of the whole economy. Also included in this segment are mining and quarrying – which encompasses oil and gas extraction, where GVA has fallen in absolute terms by 7% over the period – yet productivity is 637% of the whole-economy average. The red segment also includes oil refining as well as the chemical and pharmaceutical sectors, both of which have much higher productivity: 384% and 292% of the average respectively. Transport manufacturing, which includes making cars and buses, is also a relatively high-productivity sector at 141% of the whole-economy average. All these sectors have grown more slowly than the whole economy.
Looking in more detail, hours worked are down 9% in mining and quarrying. High taxes on domestic oil and gas producers, coupled with the effective ban on new exploration drilling, have led to estimates of 1,000 jobs per month being lost in the oil and gas industry in the North Sea. The economic impact of these job losses is far greater than the headline figures suggest, because this sector creates more than six times the value added per hour worked than the whole economy.
There are additional impacts further downstream in refining and petrochemicals, where hours worked are down 14%. Grangemouth oil refinery closed about a year ago with the loss of 400 jobs. The oil refining sector produces about four times the GVA per hour worked compared to the whole economy, so the economic impact of those job losses is similarly amplified. As well as producing fuels such as petrol, diesel and kerosene that must now be imported, Grangemouth produced essential feedstock for the petrochemicals industry – including ethylene, propylene and the polymers polyethylene and polypropylene. The chemicals and pharmaceutical industries create about three times the value added per hour worked compared to the whole economy, yet total hours worked is down 2%.
It should also be noted that hours worked per week are down 11% in computer manufacturing and 3% in transport manufacturing, indicating job losses over the period. While those losses have been relatively modest in number, the loss of GVA is far more significant given how much additional value per hour these industries generate.
The loss of North Sea oil and gas production carries a large economic impact in its own right, and an even greater one that extends further along the value chain, hollowing out industries that produce vital building blocks upon which society depends.
The productive sectors of the economy tend to be energy-intensive and have been rendered less competitive by high energy prices and a heavy regulatory burden. Moreover, these industries tend by their nature to be capital-intensive. Expensive energy, high taxes and an onerous regulatory regime have led companies such as Ineos to abandon new investment in the UK. As these companies move abroad, Britain also loses the investment that would otherwise drive further growth.
Conclusions
Energy is the foundation stone of modern economies, as demonstrated by the absence of any examples of rich countries that are low energy consumers. The UK has imposed a swathe of legislation that has increased the regulatory burden and made energy scarce and expensive. In particular, the focus on expensive and intermittent renewables and punitive taxes on hydrocarbons has given the UK the most expensive industrial electricity prices in the developed world.
As a result, energy and electricity consumption are in steep decline and the economy is flatlining. Energy consumption in the industrial sector is plummeting and many of the most productive parts of the economy are shrinking. We need look no further than a disastrous energy policy to explain why Britain has stopped growing.
David Turver writes the Eigen Values Substack page, where this article first appeared.


Discussion
Comments
This week across the site:
To join in with the discussion please make a donation to the Daily Sceptic.
Profanity and abuse will be removed and may lead to a permanent ban.
Net Zero is doing exactly what is was supposed to do.
Stop! It’s not “energy” costs, it’s electricity costs – the two are generally being conflated to cause confusion to demonise fossil fuels.
Electricity is secondary energy, fossil fuels primary energy. Energy means BOTH not just electricity. This article is about electricity not “energy”.
Only about 15% of our (UK) energy is from electricity, 85% therefore from fossil fuels. And it is true electricity prices have surged, but primary source energy – oil, coal, gas – have not.
A large part of that 85% is gas for domestic and industrial use and gas prices have been relatively stable. Much of the rest is oil via motor fuels and they by and large are comparable with other European Countries.
Let’s have some accuracy. It’s important.
Read it again and you will see that there are direct taxes of hydrocarbon use and we have some of the highest of those as well. So it is not just electricity. Aside from what this article covers there are other taxes such as packaging that all help make us poorer every year.
You literally couldn’t make this up. It must surely be by design. Why do politicians want to destroy our country when they’re meant to be defending it and encouraging prosperity? I just don’t get it.
Evil. Evil is its own justification.
It is by design, all to make us poor and keep us under control.
I think politicians are just simply far more stupid than many give them credit for.
How is it possible to make a comment about this absurd economic suicide without using ‘profanity’ and ‘abuse’?
It bloody isn’t! 😉