Further holes have been blown in the regularly adjusted global and local surface databases that show increasingly implausible rates of warming. The latest work from Messrs Roy Spencer and John Christy reveals that since 1978 about half of the summer night-time warming across 10 mostly metro areas of Canada was due to increased urbanisation. This urban heat effect accounted for 20% of the day-time warming produced by ‘homogenised’ temperature datasets. The two atmospheric scientists recently published similar results showing 50% less warming over 50 years across the eastern United States.
As the scientists note, the issue around correct temperature measurement is important “since rational energy policy should be based upon reality, not perception”. To the extent that global warming estimates are exaggerated, “so will be energy policy decisions”, they note. Reductions in actual warming mean “climate models become increasingly irrelevant”.
Dr. Roy Spencer and Professor John Christy both work out of the University of Alabama in Huntsville, where they compile the accurate UAH satellite monthly temperature record. This consistently shows less global warming than surface datasets, but is rarely mentioned in the mainstream media. In January, Google AdSense demonitised Spencer’s blog showing the UAH monthly records on the grounds that it contained “unreliable and harmful claims”. Professor Christy is the Alabama state climatologist, and Dr Spencer is partly funded through his office.
Their grounding-breaking work attempts to remove distortions caused by increasing urban heat, and uses human-made structure density data over 50 years supplied by the Landsat satellites. They use a dataset of urbanisation changes called ‘Built-Up’ to determine the average effect that urbanisation has had on surface temperatures. Urbanisation differences are compared to temperature differences from nearby weather stations. More detail on the methodology behind their work can be found here.
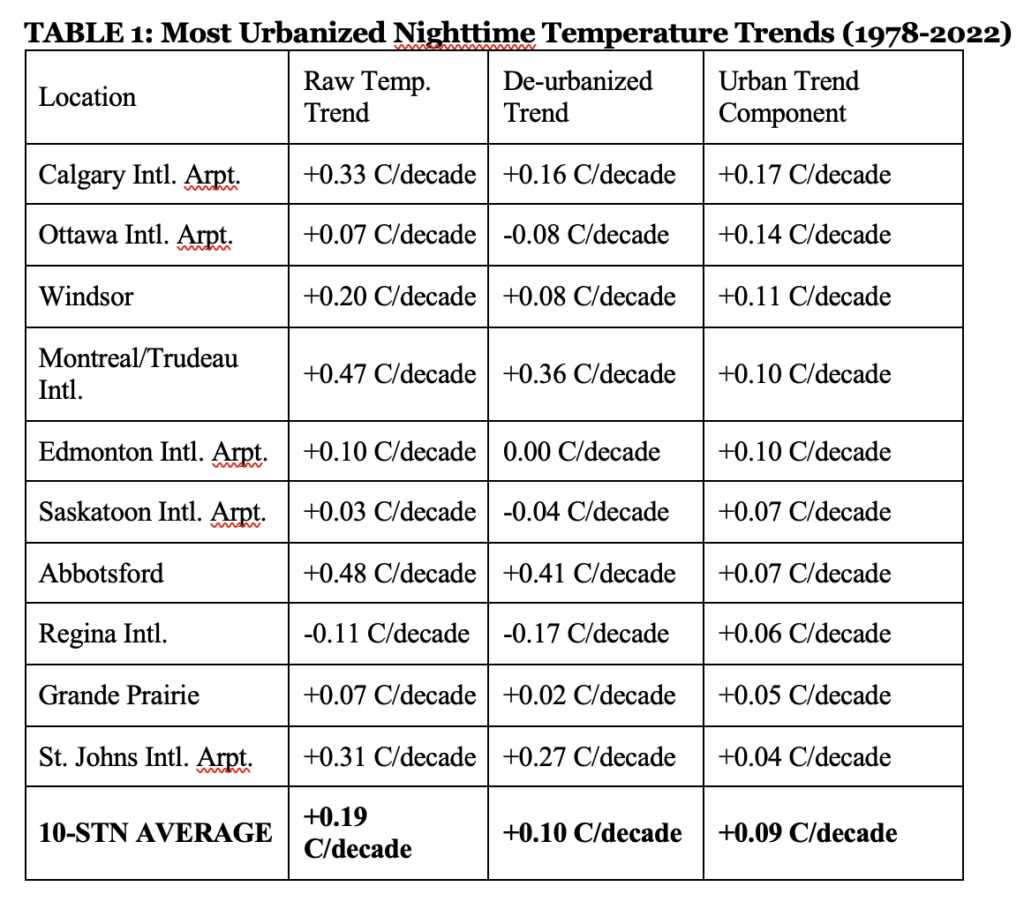
For his Canadian work, Spencer uses the Global Hourly Integrated Surface Database which provides mostly hourly readings to support aviation at airports around the world. Airports are a favoured location for surface datasets run by all the major operators, including the U.K.’s Met Office. Night and day-time urban warming results were produced from 70 weather stations scattered across Canada. The table below shows the results from the 10 stations with the “largest diagnosed spurious warming trends” from 1978 to 2022.

It is notable that Calgary, Ottawa, Windsor, Montreal and Edmonton are the five station locations with the greatest rate of increased urbanisation since the 1970s as measured by Landsat, and therefore the highest rate of spurious warming. Over the 10 highest growth locations shown, “48% of the average warming trend is estimated to be due to urbanisation alone”.
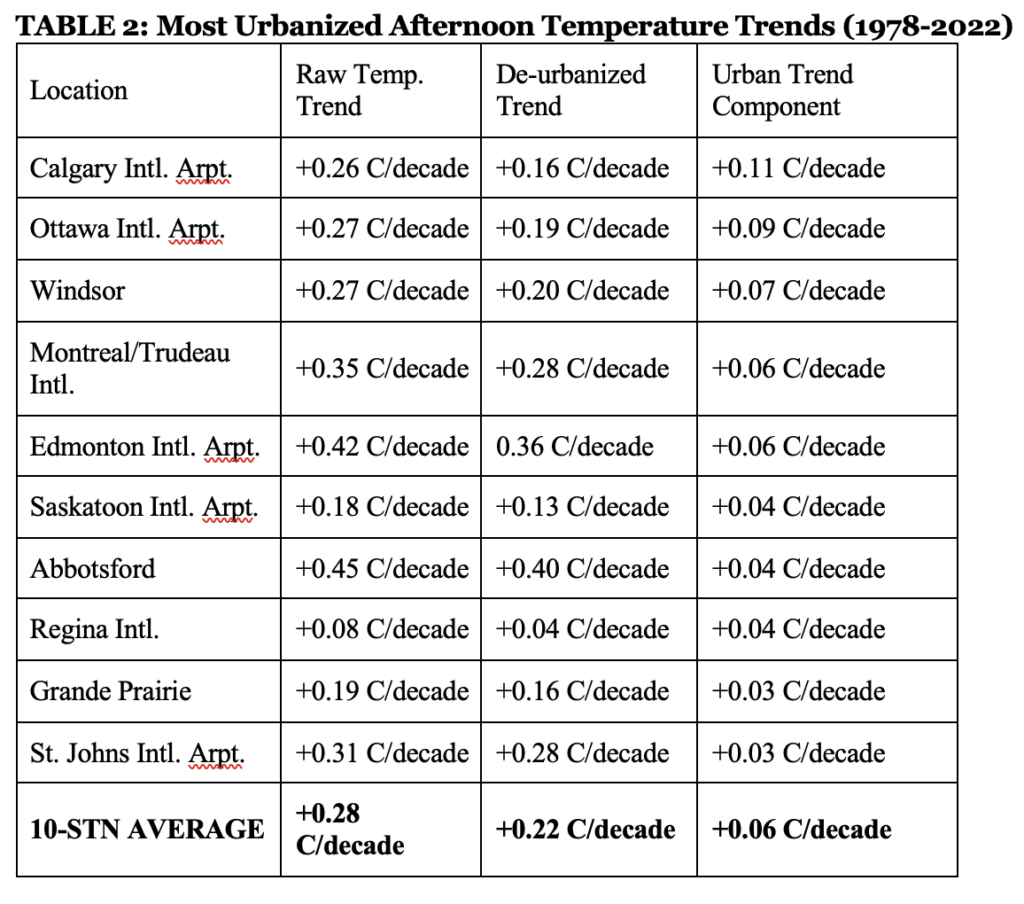
The day-time results are shown below:

For the 10 most increasingly urbanised stations, the average reduction in the observed afternoon warming trend is 20%. The scientists note, as do many others, that the urban heat effect on temperatures is larger detectable at night when solar energy absorbed by heat-retaining building material is slowly released.
This work is part of an ongoing investigation by Spencer and Christy into the degree to which surface temperature datasets are producing warming trends that have been exaggerated by increased urbanisation. Preliminary analysis has also been done for the U.K., France, Australia and China. It seems the more work they do, the more critical they become of the surface datasets. Current ‘homogenisation’ techniques for thermometer data adjustments do not explicitly attempt to correct urban trends to match rural ones, they point out. Instead, it appears the reverse occurs. The work of the U.S. meteorologist Anthony Watts is referenced. He found that the U.S. homogenised dataset produced temperature trends “as large as those produced by the stations with the worst siting in terms of spurious heat sources”.
The scientists also refer to a rarely-publicised dataset compiled by the U.S. weather service NOAA from 114 nationwide stations designed to provide recordings away from urban heat distortions. The measurements started in 2005, and to date show little if any warming across the U.S.
Spencer and Christy’s vital work will continue and the Daily Sceptic will carry on reporting their findings. Of course, the mainstream media will ignore the story, presumably on the grounds that these facts don’t fit a pre-determined Net Zero ‘settled’ science narrative – or sick their ‘fact-checkers’ on to us for daring to report it. Meanwhile, the compilers of the corrupted, but politically-correct, temperature figures will continue to declare new global warming records.
Chris Morrison is the Daily Sceptic’s Environment Editor.


To join in with the discussion please make a donation to The Daily Sceptic.
Profanity and abuse will be removed and may lead to a permanent ban.
The unit in my part of Leeds is tinny, as in, “Can you spare anything for a tinny” or “Fetch us some tinnys”.
What’s “wine”, Toby?
I’ll be honest, this hasn’t attracted as many ups as I thought it would
Wrong crowd?
What part of Leeds is that?
Until the age of 9 we lived in Beeston, looking down on Elland Road – I have vivid memories of incomprehensible Celtic fans streaming past the end of our street – but my first pub was in the lower 6th in Ossett just before Christmas 77.
I would have said that this should be quite a long way down a long list of Brexit priorities. As most businesses, especially in Europe are geared for metric packaging, changing the unit size is going to be pretty pointless.
I think this might be Toby’s point…?!
“So… is this what Brexit has come down to?!”
Sadly, it was all so utterly predictable.
I am neither Remainer nor Brexiteer, by the way. The whole thing was completely pointless. Because the useful idiots in Strasbourg, Brussels et al and heck even the useful idiots in our own Houses are not the root of the problem.
Cameron thought all he had to do to get the Eurosceptics on his side was to offer a referendum, he never guessed it would go the way it did, because he is/was just another out of touch Eton Boy.
How very kind of those wonderful work from home civil servants to allow us to buy champers in pint bottles. I dare say this comes with “and that’s your lot” from those same civil servants.
That’s Brexit done.


Yep but whenever in the past did we drink “pints” of wine?
I dunno -according to this article, those whopping great glasses you get in pubs nowadays hold nearly half a litre, which is close to a pint in old money (if you’ll forgive the mixed metaphor). I’ve certainly seen nearly half a 75cl bottle go into a glass which is a bit excessive IMHO, but them I’m teetotal!
https://www.theguardian.com/environment/2017/dec/14/size-does-matter-wine-glasses-are-seven-times-larger-than-they-used-to-be
Yep but when did you hear anyone go up to a bar and say “eh 2 pints of lager and a pint of merlot please”? ———–I prefer everything to be in the old money as well (if you will pardon the mixed metaphors) but using wine in a pint glass is a bad example.
A gill of Merlot perhaps?
“A gill of Merlot perhaps?”
Somewhat giving away your age and roots.
Up North a “gill” typically referred to a half pint although youngsters these days cannot even understand the tem “gill.” The actual gill measure is five fluid ounces.
Up where I live it used to be “3 pund of tawties and a half loaf, ana packit of cheese an ingin”. —-(3 pounds of potatoes and a loaf of bread and a packet of cheese and onion crisps) ———In those days no one drank wine. Wine was for people on the Italian Riviera
That was my thought – most wine that was around pre EEC days was from France or Germany so basically the size that it is now. This is actually daft!
Wine pre-EEC – mucho, mucho pre, 18th, 19th Century pre – was shipped to Britain from France whence most of the wine came, in 50 gallon barrels…. which corresponded to 400 pints or 225 litres.
It was then bottled by wine merchants in Britain.
However. Things were sold in dozens and half dozens in Britain, and whereas 1 gallon would yield 8 pints, it was realised 1 gallon of wine could produce 6 equal measures, and 2 gallons 12 equal measures, which coincidentally equalled 375ml and 750ml respectively. Why wine is still sold in cases of six and twelve, despite metrication. Each barrel then could produce 25 dozen cases, or 50 half-dozen cases.
I gallon could also produce 8 pint bottles and pint bottles were commonly used in Britain for liquids, so it was possible for some merchants to sell in pints, perhaps to special order.
Ironically, that 19th Century British standard of 750ml became the standard adopted by Europeans which is why wines there are mostly sold based on that measure rather than litre or half-litre commonly used for other liquids.
I believe Churchill drunk champagne served out of pint bottles.
Pitt the Younger was “Advised to drink port every day for medical reasons, Pitt became a “three-bottle-a-day man”, and ended his life as an alcoholic.”
In the 18th century a bottle typically was a one pint measure.
Your answer may be found in history books or even novels.
Can anyone think of a more expensive or wasteful idea? I suspect that a pint bottle will cost more than a 750 (700?) ml bottle of proper wine, and you will have very little choice of cuve(accent). More “hold the masses” down! Rotten wine does come in Tinnies MAK, but few drink this stuff, it is awful!
It’s called ‘choice’. Not everyone’s choice coincides with yours.
As for cost: 500ml bottles already exist. They use less glass, and weighing less cost less to ship.
Yes Net Zero. Organic farming.
FFS! I don’t need a pint bottle of wine. It’s not bloody milk or beer. What is wrong with people??!! How utterly absurd. Should we change everything back to imperial measures just like the good old days when the sun never set on the British Empire? No. It’s effin’ ridiculous.
Well good, now you have established what your ‘needed’ are, how about other people’s needs – or don’t they count?
Why are you so bothered? You’re not a pint bottle wine entrepreneur by any chance are you?
A great opportunity for wine vendors who will price their new pint bottles of wine at around the same level as the old 750ml bottles, trusting that the average shopper won’t spot the difference.
Ever heard of competition?
LOL
Ever heard of ‘shrinkflation’?
“However, it remains to be seen what the demand will be for pint-sized wine bottles among producers and bottlers.”
What?
Isn’t it the demand from consumers that matters?
A pint (500ml near enough) of wine is a good measure. A whole bottle, if you are on your own is too much (although a challenge often met) and a half just not quite enough. So why just for sparkling wines?
I find that if a bottle is too much I can finish it the next day.
Or even the day after that.
“A whole bottle, if you are on your own is too much (although a challenge often met)”
A bottle is too much? I beg to differ. One bottle is simply half time.
What size bottles do US winemakers use for the home market?
All the bottles I remember buying in the SW were 750ml.
Wine from the US arrives here in 750ml bottles. Some of the cheap stuff might come in tankers.