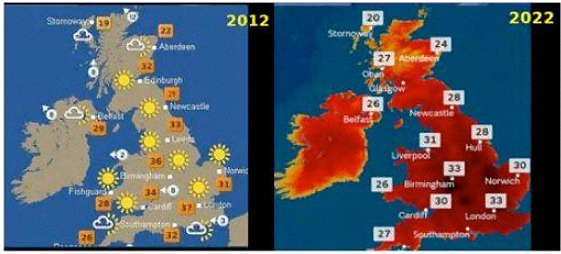
The recent brief heatwave in the U.K. and parts of Europe provides a textbook case of how the weather is being catastrophised to serve the interests of the command-and-control Net Zero agenda. The U.K. heatwave was exceptionally hot, but according to Professor Cliff Mass, this “extraordinary extreme event” is a sign that ”global warming played a very small role in this event”.
According to Mass, the golden rule of climate extremes is: “The more extreme a climate or weather record is, the greater the contribution of natural variability and the smaller the contribution of human-caused global warming.”
Mass is Professor of Atmospheric Sciences at the University of Washington. He does not rule out the involvement of human-caused global warming, but is dismissive of much of the ludicrous scaremongering that dominates the media. “The truth and overwhelming evidence provide a different story: the recent European heatwave is mainly the result of natural processes, but was enhanced modestly by human-caused global warming,” he writes.
Of course the term “modestly” is being fiercely debated by many scientists. To date, there is no credible science paper that has conclusively linked single weather events to long-term changes in the climate. But, of course, this doesn’t stop the BBC’s green activist-in-residence Justin Rowlatt quoting the opinion from the Met Office that the recent extreme heat was made “ten times” more likely because of climate change. Far from questioning this statement, Rowlatt added: “We are being warned that it can pose a life-threatening risk to even normally healthy people and just look at the impact it is having in our hospitals, schools and transport systems.”
Rowlatt saw no need to provide a detailed meteorological explanation for the high temperatures. According to Professor Mass it was caused by a large ridge of high pressure, which produced warming by sinking and moving air northwards on its western flanks. Meanwhile, a trough of lower pressure on the southwest side in Europe enhanced the southerly flow, and acted as a supercharger for the warmth.
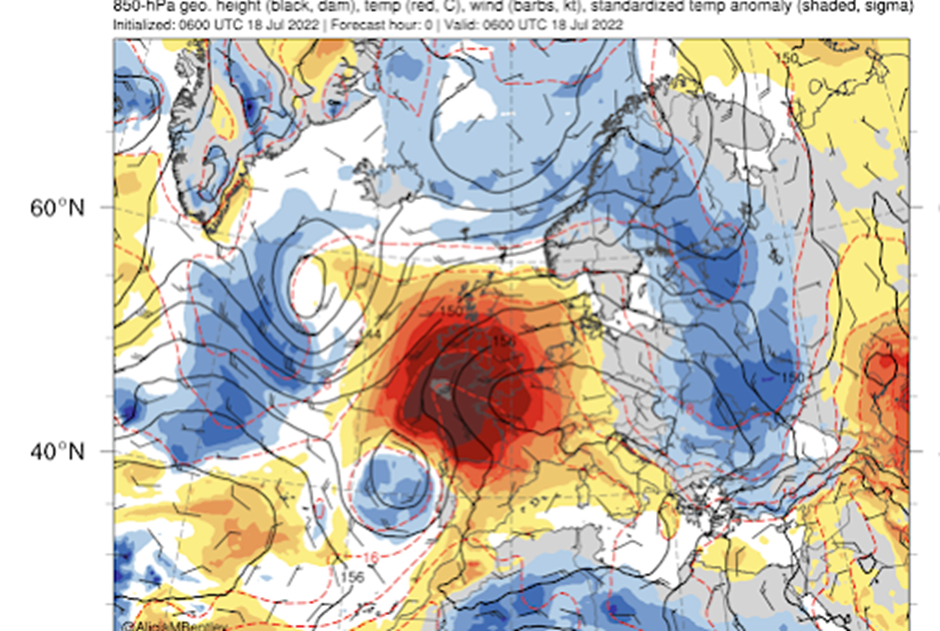
Ironically, notes Mass, such a pattern, as shown above, produces enhanced cooling to the east and west. Needless to say, this was rarely, if ever, mentioned in the relentless media concentration on the localised heat. But Mass is clear about the ridge: “There is no evidence that the ridge in question resulted from global warming.”
Similar climate agitprop was evident last year in North America when it was struck by a heatwave in the northeast. Again, talk of Thermogeddon ‘heat domes’ was common across the media. Now, says Mass, “a shocker”. Below is the same kind of chart for this heatwave.
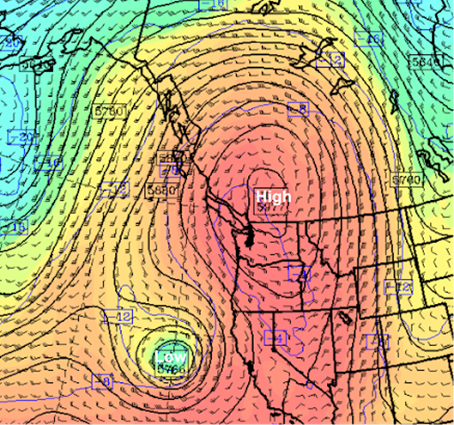
“OMG! Very similar, including the low to the southwest,” notes Mass.
The U.S. meteorologist Anthony Watts is another person to bring some scientific sanity to discussion of the recent heatwave. “Each of these stories trying to link climate change to the heatwave does so without any proof whatsoever. They are nothing more than speculative fearmongering,” he said. Fearmongering he might have had in mind would include Piers Morgan who told TalkTV that we could be “heading for an apocalypse”, and BBC weatherman Ben Rich, who was of the opinion that “it feels like a tipping point”.
Publishing the BBC photo featured at the top of this article, he noted that TV stations were using colour “to make it seem like a crisis”. He also drew attention to the dramatic temperature differences across the UK and Europe as a “sure sign of this being a weather pattern, and not global scale climate change, aka global warming as the media would have you believe”. The same, he added, applied to last year’s northeast heatwave in the United States. Indeed, he went on to note that in recent decades, heatwaves in the US had been far less frequent and severe than they were in the 1930s.
Watts has researched and written extensively on the Urban Heat Island (UHI) effect for many years. In 2017 he wrote that the majority of weather measuring centres used by NOAA in the U.S. had been compromised by UHI. “The result is an inflated temperature that needs to be corrected,” he said. Estimates of the UHI effect in cities vary, but often reach a number of degrees centigrade. “If this were forensic science, such polluted and corrupted data would be tossed out as being unsuitable for the purpose of making a legal decision. Yet entire economies and national policies are being modified based on trends seen in the data, as well as the future projections. When science refuses to own up to bad data, it is no longer science”, he charged.
As the Daily Sceptic recently reported, about half of all land surface temperature measurements used to promote the fading global warming scare are now taken near or adjacent to airport runways. Adjustments are made to the raw data, but – some might say mysteriously – the recent temperatures are all continually adjusted upwards, and historic recordings moved downwards. As a result, the three main datasets run by NASA, the Met Office and the NOAA now show an obvious disconnect with accurate satellite and meteorological balloon recordings.
The atmospheric scientists Professors William Happer and Richard Lindzen didn’t pull any punches over the changes when they recently told the U.S. Government that over the last several decades, “NASA and NOAA have been fabricating temperature data to argue that raising CO2 levels have led to the hottest year on record”. The large adjustments meant they were “totally inconsistent” with other temperature data. What was claimed to be false and manipulated data, was said to be an “egregious violation of the scientific method”.
Watts concluded his recent thoughts on the U.K.’s heatwave by noting that it is well known that UHI can contribute to warmer temperatures. He noted that the population of the U.K. had increased by 11 million people since the hot summer of 1976, and it is not in the least bit surprising that UHI increased as infrastructure was built to support the rise. The BBC is said to have reported that the record recent high U.K. temperature was recorded at Coningsby in Lincolnshire [some reports said it was the village of Coningsby] but what it didn’t tell you was that the record was set at RAF Coningsby, “next to the heat absorbing sea of runway asphalt and tarmac”.
As the Daily Sceptic noted, in joint second place for the temperature record was Heathrow, one of the world’s busiest airports. Also in second place was Kew Gardens in London, which prompted numerous social media critics to inquire if there was a runway in the park. There is not, but the Met Office co-ordinates do place the measuring device about 150m from the Palm House. This is an ornate, tropical greenhouse with 16,000 panes of glass, measuring 62 feet high and 362 feet long. It does not seem the most obvious structure to have next to a temperature measurer.
Chris Morrison is the Daily Sceptic’s Environment Editor.


To join in with the discussion please make a donation to The Daily Sceptic.
Profanity and abuse will be removed and may lead to a permanent ban.
Yes all they had to do was change the colour of the map to red and people fall for it. I think its criminal – a gross misrepresentation of facts and done to deceive the public, just as they did with the Cov id statistics.
I wonder how we would feel if the maps were in a neutral temperature gradation that was not linked in anyway to our learned hot and cold colour programming …
And the Mercator projection map distortion might also have an effect. We are all used to using such maps, but perhaps not with much background knowledge of it.
And have you noticed they have done away with the sun symbol as well? The symbol for the sun generally indicates cheeriness and happiness, but oh no, you will see the Met office sun no more, you are not allowed to be happy about hot weather, nor go out and enjoy it.
All the signs are, to me (being a very unscientific adherent to countryside lores) that we could be in for a long cold winter. Time will tell. But how many thousands would that kill as they won’t be able to afford to heat their homes?
Everything that you see on the screen has been specifically chosen to influence your thinking.
If someone from the media dares to suggest that tropical temperatures are something to enjoy (as millions of holiday makers do year after year) instead of Harbingers of Absolutely Certain Horror Death[tm], the XR-guys will pay him a visit to remind him how vulnerable to unfortunate accidents his office happens to be (as they did with the News UK HQ on Wednesday last week).
Exactly right!
2012 – “Enjoy the sunny weather”. 2022 – “You’re all going to die!”
Similar issues in Australia.
Our Bureau of Meteorology regularly changes data, cancels previous record temperatures, moves weather stations to airports, and discontinues weather stations in cold climates. They regularly “homogenise” data, which means lowering previous temperature records to increase rate of warming.
Our BOM is a $1 billion per year leviathan whose funding depends on scaring the bejesus out of politicians.
And the next weather related issue may be the declaration of “drought” in some parts of England, notably East Anglia and Kent – according to the propaganda channel’s ‘farming today’ programme.
According to Thames Water, we had a dry start to Summer. https://www.thameswater.co.uk/about-us/performance/reservoir-levels-and-rainfall-figures From near the bottom, it says: “At the end of June 2022:
Whether one considers 8 or 9 percent variation to be abnormal, or not, I’ll stick that on the wall.
The other nine percent was probably leaking from Thames Water’s rubbish pipe infrastructure. I remember a pipe burst and water started gushing down the hill in the part of London I lived in a few years ago. This went on for days and nothing was done until the road collapsed!
Due to the nature of averages, about 50% of everything can be expected to be below average. This statements is meaningless without knowing how these averages are calculated, how far below the average the current value is and what the standard deviation for this average happens to be. Something which isn’t at least below average for signficantly more than the standard deviation is just a regular occurence.
Regarding the Kew weather station, it’s in the middle of a fairly large lawn but there are large greenhouses on 3 sides, which might perhaps affect the reading depending on the direction of the wind. https://www.google.com/maps/@51.4818154,-0.2946214,184m/data=!3m1!1e3
Kew Gardens is pretty sheltered; there are a lot of large trees which might perhaps trap any extra heat collected by the greenhouses. It would be interesting to see how the historical records of that particular station compare with others.
It’s also in London, which has an Urban Heat Island effect of around +3 degrees, with temperatures similar to the Channel Islands.
apparently they are ramping up winter weather headlines in NZ too, ‘global warming’ into ‘climate change’
The use of hellish fire imagery seen in the graphics is classic nudge unit stuff. It’s about slowly programming the public to believe something. We know Sky and the nudge unit recently made a deal to push climate catastrophism: Toby went to court about it.
The blatant manipulation of the public by this fetid government organisation needs exposure and one wonders why the mainstream press hasn’t made more of it. After all, the public could be nudged to go after them sooner or later.
“one wonders why the mainstream press hasn’t made more of it.”
I doubt many on here would expect anything resembling journalism from the mainstream press. It’s a lost cause.
Rhetorical question! 😉
As someone who works in the media himself, I know my profession is a lost cause. I wish there was something else I could do! 🙂
The biggest human influenced contributor to the record temperature measurements appears to be the location of thermometers on the concrete halfway down an airport runway.
The BBC is a campaigning body for woke whatever, climate alarm and homosexual hegemony. We know this and it’s tedious to reiterate it. There’s just one thing to do: boycott the license fee. Just don’t pay it.
Well … I KNOW the 3 days of very hot weather we enjoyed last week is down to man-made climate change because that highly-qualified meteorological expert Prince Charles told me it was.
“This proves I’m right” is what he said.
So the long, hot summer of 1976, which I enjoyed as a child and he suffered as a highly privileged, and patronising, young adult, must have been a figment of our imaginations.
Another first rate piece, Chris. Much appreciated!