
About one half of all land surface temperature measurements used to show global warming and promote the command-and-control Net Zero agenda are taken near or adjacent to airport runways. This amazing fact from research by Professor Ross McKitrick casts further serious doubt on the validity of three major global temperature datasets, including the one compiled by the Met Office, which continue to show higher global temperatures compared with other reliable measurements made by satellites and meteorological balloons.
Airports are arguably uniquely unsuitable for providing an insight into global temperatures. Many of them are major industrial complexes spread over miles of heat-radiating tarmac and concrete, containing industrial buildings and subject to constant super-heated jet exhausts measuring hundreds of degrees centigrade.
There are three major global surface datasets. HadCRUT is compiled by the University of East Anglia Climate Research Unit in collaboration with the Met Office, NASA runs the Goddard Institute for Space Studies GISS record, while NOAA is compiled by the U.S. national weather service. All three global averages depend on the same underlying land data from the Global Historical Climatology Network (GHCN). As I have noted on numerous occasions, all three datasets have made significant adjustments, which has had the effect of increasing recent warming and cooling the historical record.
As the Daily Sceptic reported on Monday, Emeritus Professors William Happer and Richard Lindzen recently told the U.S. Government that over the last several decades, “NASA and NOAA have been fabricating temperature data to argue that rising CO2 levels have led to the hottest year on record”. These false and manipulated data were said to be an “egregious violation of scientific method”.
In the U.K., the surface datasets are used to weaponise the weather in the political interests of Net Zero. A few days of hot weather would in the past have attracted ‘Phew What a Scorcher’ headlines, but now these are written along the lines, ‘Life threatening heatwave in tinderbox Britain!’. The Met Office regularly proclaims the temperature at Heathrow, seemingly desperate to promote the highest measurement it can find. Meanwhile the BBC fills its climate page with stories like: “Heatwave: Can I refuse to work?”
The preponderance of airport data in the global surface temperature record has been known for a number of years, although little discussion about the matter can be found in mainstream media or academic literature. In a paper published in 2010, Professor of Economics Ross McKitrick from the University of Guelph in Ontario noted that the number of weather stations providing data to GHCN plunged in 1990 and again in 2005. This had the effect of increasing the contribution from airports to around 50%. McKitrick noted that the cuts reduced the average latitude of source data and removed relatively more cooler, high altitude monitoring sites. GHCN is said to apply correcting adjustments, but after 1990 their magnitude “gets implausibly large”.
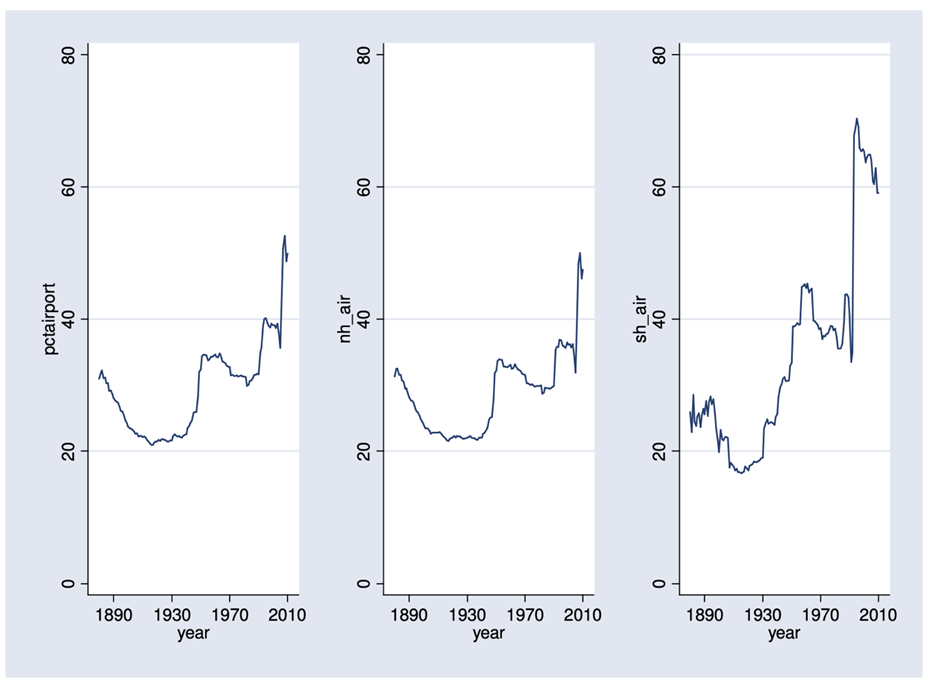
The above graph is given by Professor McKitrick to show the percentage of data supplied by airport sites to GHCN from 1890 to 2010. The graph on the left is the global percentage with the northern hemisphere in the middle and the southern on the right. The data going back to 1890 presumably refer to sites that became airports. For instance, Chicago’s O’Hare Airport was an orchard field with a measuring thermometer in the late 1800s and retains the ORD code to this day. The large jump after 1990 is clearly visible in all three graphs.
In 2017, three climate writers Drs. James Wallace, Joseph D’Aleo and Craig Idso, wrote a paper that examined the validity of the NOAA, NASA and HadCRUT data. The conclusions reached were agreed by a number of academics including Dr. Richard Keen, Instructor Emeritus of Atmospheric and Oceanic Science at the University of Colorado and Dr. Anthony Lupo, Professor in Atmospheric Science at the University of Missouri. The findings were damning: “The conclusive findings of this research are that the three GAST [global average surface temperature] datasets are not a valid representation of reality.”
The Wallace authors were interested in the numerous adjustments that are made to the surface temperature record, a habit that continues to this day. The Met Office has added 30% extra heating to the recent temperature record and cooled past records since 2013. ‘Hottest’ years ever are declared, despite the fact that the U.K. was actually colder in the 2010s than the 2000s. The global temperature pause from 1998 to around 2012 has been adjusted out of the fifth edition of HadCRUT, although it is still obvious from the satellite and balloon record. According to the satellite record, rarely mentioned in the mainstream media, the recent run of global warming started to run out of steam over 20 years ago.
Similar adjustments are seen in all three datasets; the three authors are not impressed: “In fact, the magnitude of their historical data adjustments, that removed their cyclical temperature patterns, are totally inconsistent with published and credible U.S. and other temperature data.”
Again, we refer to the words of Profs Happer and Lindzen: “Misrepresentation, exaggeration, cherry picking or outright lying pretty much covers all the so-called evidence marshalled in support of the theory of catastrophic global warming caused by fossil fuels and CO2.”
Almost every plank that supports Net Zero is provided by these surface temperature datasets, amplified by climate models. They are at the centre of the grim pronouncements made by the IPCC and loyally passed on by mainstream messengers. Time, perhaps, to look in detail at temperature datasets boosted by jet exhausts and constant upward adjustments, along with climate forecasting models that are invariably wrong, to see if the science is quite as ‘settled’ as defined by elite political opinions.
Chris Morrison is the Daily Sceptic’s Environment Editor


To join in with the discussion please make a donation to The Daily Sceptic.
Profanity and abuse will be removed and may lead to a permanent ban.
Years ago I used to do a stand-up comedy scientist act. Nowadays I wouldn’t have a chance of getting a gig. These climate scientists are hilarious
Real-world comedy: Among the Why is heat dangerous? reasons published by the Met Office is (paraphrase) People will flock to beaches which increases the risk of swimming accidents.
🙂
It all goes with the epidemic of micro-management, which is a neurosis in its own right.
Psychosis would probably be more appropriate.
But the problem with the Met Office flagging a temperature of 28C (Reading) as EXTREME HEAT! (caused by CLIMATE CHANGE!! — government must cut emissions OR WE’RE ALL GOING TO DIE!!! [BBC]) is not one of micromanagement. That’s the same method already employed to market COVID. Describe something unexceptional using extreme terms to create wrong impression that something extreme is in fact going on.
Plus a bit of outright lying from the BBC. While I’d love to see government emissions cut (No more spurious press releases! Yay!), that isn’t really about emissions of the government the government could thus cut. It really means The government most prohibit more everyday activities of people to reduce the amout of emissions caused by them.
Yes, your word is more appropriate, thank you.
The two give-aways are that:
[1] No ‘extreme heat’ warnings have ever been given to UK tourists when they go on their summer holidays to Greece, Italy, Spain, Portugal, Mexico, Florida, Bahrain, Dubai, Egypt or Australia. All these places can and will experience summer temps in the 40s.
[2] No warnings and instructions have been given for disposing of used face masks. If they work or the virus is that deadly then they should have been treated as a serious bio-hazard. But they weren’t and there have been no excess deaths within the workers that collect and dispose of these pieces of theatrical costumery.
There is no way to adjust a flaky measurement into a correct one. The input of such a calculation is some piece of information about the real world. The output isn’t anymore. Consequently, this process shouldn’t be called adjustment. Forgery would be more appropiate.
The temperature dataset that does away with this urbanisation bias is the UAH Satellite dataset which relies on atmospheric temperature measurements – see https://www.drroyspencer.com/
I’ve been pointing this out for years…
Good. Keep it up.
Using Crowd Sourcing in the internet on badly placed thermometers (airports, encroaching cities, grass to parking lots, etc.) was instrumental in starting https://wattsupwiththat.com/ years ago. not news but so many people do not know. so keep saying it.
Also urban heat island effect has a role. cities bigger now.
In 1800 there was one city of 1 million, London. Now there are over 500.
‘Your blood thickens and then clots’: what extreme heat can do to your body
https://www.telegraph.co.uk/global-health/climate-and-people/why-people-die-heatwave-how-stay-safe/
Ever get the feeling that there’s an ulterior motive behind the relentless MSM doom-porn? Only five years ago this would have been described as a nice summer’s day with pictures of attractive young people sunbathing.
Four years ago, actually. According to Laura Dodsworth (of yesterday) weather forecasts changed to doom porn (nice term) after 2018. I think I also know the reason for that: 2018 was an exceptionally hot summer with larger rivers like the Rhine virtually drying up. Just what the climate changers wanted.
But – as always with the weather – things keep changing and no other exceptionally hot summer occurred since then. Since September 2019, the weather has generally been cool or cold and very rainy. Summer 2022 pretty much only started last week. That’s absolutely not what the climate changer want. Hence, they’ve rechristenend summer as deadly heatwave and keep telling fictional horror stories about it in the hope that nobody notices this until another hot summer actually comes.
We were in Cologne, on the Rhine, in July 2018. It was at a record low but still the cruise ships and goods barges could get through.
Some evidence to back up your assertions:
‘The data don’t matter. We’re not basing our recommendations [for reductions in carbon dioxide emissions] upon the data. We’re basing them upon the climate models.’ Chris Folland – UK Meteorological Office
“The common enemy of humanity is man. In searching for a new enemy to unite us, we came up with the idea that pollution, the threat of global warming, water shortages, famine and the like would fit the bill. All these dangers are caused by human intervention, and it is only through changed attitudes and behaviour that they can be overcome. The real enemy then, is humanity itself.“– CLUB OF ROME
More die in the UK from hypothermia than from heatstroke, more for from the cold than from the heat
Anecdotical data point about deadly heatwaves: A little more than 30 years ago, I was on a summer holiday together with my sister on a farm in Bodmin Moor. By the time we arrived, it hadn’t rained in Cornwall for 19 weeks and the moor farms were partially being supported by water tankers. The sun was burning so badly that I ended up with a sunburn which still hurt terribly when I was exposed to it while wearing a pullover. By that time, the only thing that got me was Man up, boy!-style chastising[*]. This was the hottest and driest summer I ever encountered despite it happened before the so-called 1990s warming.
[*] Mankind seems to have gotten a little effete since then 🙂
Those that didn’t live through the summers of ’76, ’77, don’t know what a hot English summer is like.
And 1911 and 1935. Of course I have no memory of those but they were very hot. As you know the dust bowl was on the 1930s.
The problem isn’t just airports, any weather station that has seen an increase in urbanisation around it will show an increase in temperature that won’t be seen at nearby rural stations.
The big problem is that part of the “adjustment” process involves the homogenizing of data from adjacent stations. Basically this often means that if an urban/airport station shows a trend of increasing temperature and a nearby rural station doesn’t the data from the rural station will be adjusted upwards so it matches the trend from the urban station.
Save the world – make humans smaller
https://www.conservativewoman.co.uk/save-the-world-make-humans-smaller/
Dr Kevin Donnelly
Stand for freedom – Yellow Boards By The Road
Saturday 16th July 11am to 12pm tomorrow
Yellow Boards
Junction Sopwith Rd &
Harvest Ride Warfield
Bracknell RG42 2QB
Stand in the Park Sundays 10.30am to 11.30am – make friends & keep sane
Wokingham
Howard Palmer Gardens Sturges Rd RG40 2HD
Bracknell
South Hill Park, Rear Lawn, RG12 7PA
Telegram http://t.me/astandintheparkbracknell
Amongst climate change sceptics the institutionalised bias of temperature data is no surprise but it would be a shock to about 70% of the population.
A 5 minute read of this should cause every contender for the Tory party leadership to revisit their net zero stance but it won’t. Only Kemi Badenoch has taken the time to actually examine the evidence, or lack of evidence, to support the net zero lunacy.
Every reader of the Daily Sceptic should be forwarding Chris Morrison’s article to everyone they know and asking each of them to do the same.
And there is the problem. The Solomon Asch Conformity and the Milgram Compliance experiments show that about 70% of people will conform and comply even if they are aware that something is not right. During the Wuhan Flu debacle the governments of many countries acted according to what the majority felt they needed, and it was about 70%.
Agreed about measuring temps in developed areas. All the increases in measured heat is because of the Urban Heat Island effect. Except:
[1] You cannot say “…and subject to constant super-heated jet exhausts measuring hundreds of degrees centigrade.” The weather stations at airports need to be accurate because take off performance (and landing to some extend) is calculated based on accurate temperatures. They cannot be subject to jet blast otherwise they will be blown away and the jet exhaust temperature is rapidly dissipated. There are videos of people standing at the end of the runway at St. Maarten and no one has suffered burns. No one. The high temps at airports is entirely the hot surface, otherwise there is no need for snow clearing equipment during the winter.
[2] “..and removed relatively more cooler, high altitude monitoring sites.” Measuring temps need to be done as close to sea level otherwise temps taken at altitude will need to be adjusted based on the atmospheric lapse rates (dry or wet). Aircraft performance calculations use the Standard Atmosphere which is 15C and 1013mb at sea level. Interestingly it was 15C 40 years ago.
[3] Many airports, particularly in the US have been swallowed up with urbanization. And it is any urban development, not just airports, that have surfaces that store and radiate the suns heat, but also, so do open well drained fields.
[4] Anthony Watts at wattsupwiththat is a meteorologist and has been pointing out that many weather stations have been poorly sited, or rather developments have made them unreliable, such as new A/C equipment, new buildings, new car parks, walls, loss of vegetation.
Airport weather stations are exactly where they should be and the temperatures out on the field are likely to be similar to any surrounding urbanization.
They cannot be subject to jet blast otherwise they will be blown away and the jet exhaust temperature is rapidly dissipated.
As this intepretation of subject to jet blast make obviously no sense, why are you assuming it must have been meant, anyway? Just that you can think of something which doesn’t make sense doesn’t mean anybody but you meant to express it. And what precisely do you believe dissipated means? Due to the law of conservation of energy, energy can’t be destroyed. Hence, the heat of the jet blast doesn’t go away. Physically, that’s a bunch of gas molecules moving very quickly. They become less concentrated as they spread out among the slower moving molecules of the surrounding atmosphere. They’ll also collide with these which causes their speed to decelerate and that of the hit molecules to accelerate (which then again spread and collide and …). Pulling this together yields the rather trivial observation that air temperature will be hotter the closer to a jet blast it’s being measured, exactly what the author meant to express.
Yes, and airport weather stations are not subject to jet blasts and airport surface temps are not higher because of jet engines. You can see photos of airports during winter and the snow is not melted away because of the hot gases. It might get blasted away. Unfortunately this point about jet engines and heat is used by those that wish to find issue with aviation. On a normal day Heathrow will have at least 2 aircraft landing or taking off and maybe 10 taxiing. Meanwhile 3,700,000 vehicles drive in London every day. A car body becomes a radiator on a hot day which will warm the surrounding air. Aircraft are nearly all highly reflective in colour. The atmosphere is warmed/heated by contact with a warm/hot surface. (of course there is heat from engines too, but it cannot compete with the sun)
Your definition of subject to jet blast makes no sense and repeating it doesn’t cause it to make any more sense. What was obviously meant was that they’re close enough to jet blasts to measure air heating caused by it. Which they decidedly do. This is not about finding issue with aviation but about cases of unsuitably located temperature measurement stations. To use a simplified exampe, as more and more surface temperature measurement stations get engulfed by all kinds of heat emitters, eg, jet engines, air condition exhausts, cars on busy roads etc, temperatures measured by them obviously rise. But that’s completely irrelevant for temperature rises supposedly caused by increased rereflection of infrared waves due to greenhouse gases.
I don’t usually use the BBC as a reference but this one is surprisingly balanced for a change.
https://www.bbc.co.uk/news/uk-44980493
Chris writes: “…and subject to constant super-heated jet exhausts measuring hundreds of degrees centigrade.”
The Heathrow weather station is situated 130 metres north of the edge of the northern runway and a quarter way down the runway from the East. If there were strong southerly winds this could push warm air towards the weather station, but highly improbable and all jet blast is never sent sideways. During high pressure weather the winds tend to favour landing and taking off to the East and if taking off the airliners will be well in the climb by the time they get parallel to the weather station and if landing they will have left the runway. Today and right now aircraft are landing on the northern runway to the west in light variable winds so they will be touching down almost adjacent to the weather station and this will be done with the engines in idle. Heathrow changes the landing and take off runway at 15:00 every day and reverse the pattern every week. As only one runway and the the other will be experiencing jet engines at maximum thrust I would expect to see temps go up or down either side of 15:00 every day. They don’t. Also, the weather station is on grass, but it is right next to the boundary road.
In the following video you can see people being blasted with jet exhaust at the end of the runway at St. Maarten. They are about 50/80meters from the engines and only those exactly behind the engines get blasted. Those a little way to the side are untouched. The exhaust will be hot but no one gets burnt with super-heated jet exhausts.
And…it seems jet exhaust temps can be as high as 600C but this falls quickly to about 150C in about 15m and then just a warm blast not much further out. Hardly ‘super heated’.
Yesterday, in my ground-floor town flat in Eastern England, the temperature most of the day was 23 degrees. Outside, it was 24 degrees. No fans, and certainly no air-conditioning. Today, despite being sunnier, it’s a couple of degrees cooler, inside and out. That’s using the correct thermometers, correctly.