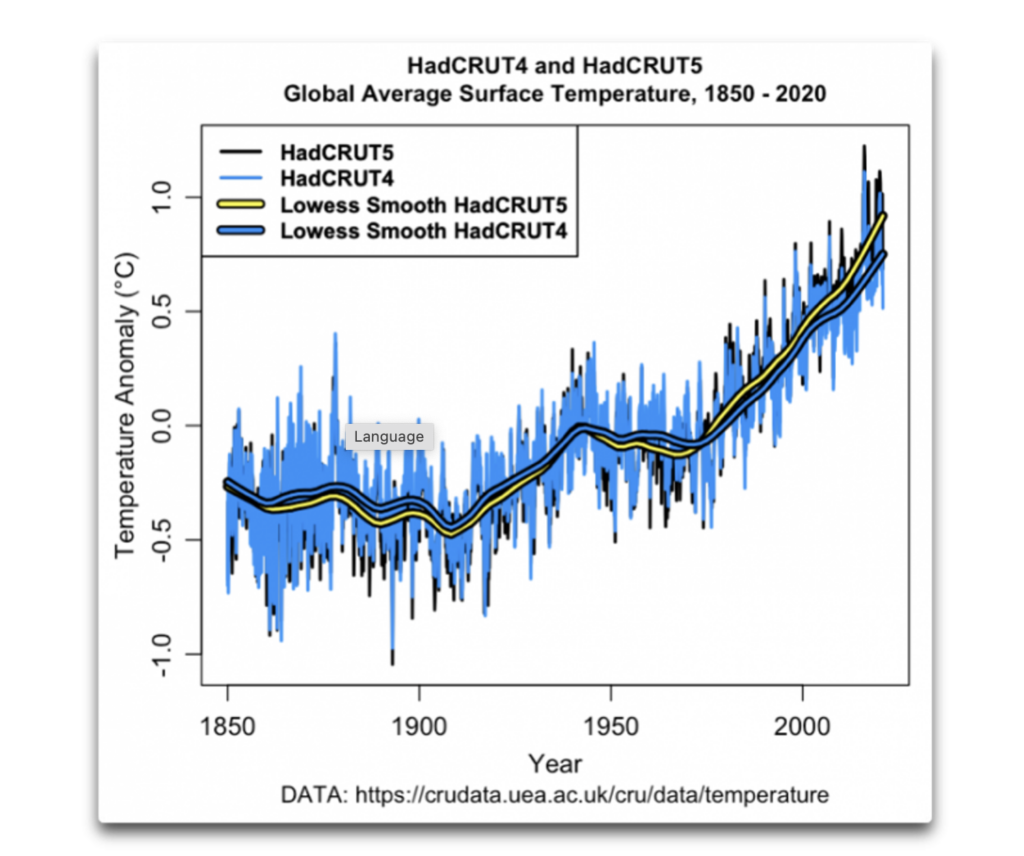
Average global temperatures rose rapidly after the 1970s, but there has been little further warming over the most recent 10 to 15 years to 2013. So said the Met Office in a report about the ‘pause’ in global warming in 2013. But these days it’s ‘What pause?’ following two timely revisions of the Met Office HadCRUT temperature database, including the recent 14% boost revealed by the Daily Sceptic on Monday.

As the above graph shows, the December 2020 14% boost in recent temperatures in HadCRUT5 finally erased the inconvenient pause. An earlier revision to HadCRUT4 had started the work by removing a flatline trend and replacing it with some gentle warming.
Attempting to explain the pause when it was still around in 2013, the Met Office claimed that the additional heat from the continued rise in atmospheric carbon dioxide, “has been absorbed in the oceans”. There are of course constant heat exchanges between land, sea and air. Constructing a believable hypothesis that humans burning fossil fuel cause heat in the atmosphere, which suddenly decides to play temporary hide and seek in the oceans, was always a tall order. It was memorably given short shrift by the writer Clive James, who just before his death wrote: “When you tell people once too often that the missing extra heat is hiding in the ocean, they will switch over to watch Game of Thrones, where the dialogue is less ridiculous and all the threats come true.” He went on to add that the proponents of man-made climate catastrophe asked us for so many leaps of faith “they are bound to run out of credibility in the end”.
Much of the Met Office report refers to the outputs of climate models. Analysis of “simulated” natural variability suggests that “at least two periods with apparently zero trend for a decade would be expected on average every century”. As it turned out, this was a lousy forecast, even for a climate model. The pause ended under the influence of a powerful El Nino weather fluctuation soon after. Despite another large El Nino in 2019, it failed to interrupt another pause which to date has lasted over seven years.
Announcing its latest boost to global warming, the Met Office noted that HadCRUT5 was now “in line” with other datasets. This is true. NASA has also been updating its GISS database in similar fashion, removing the pause by warming up recent recordings. Changes over the record have been substantial with a range of 0.3C.
There is no doubt that extreme green zealotry runs through many scientific institutions. Commanding and controlling the economy through the Net Zero project is seen by these zealots as the last hope to save the world. These days, no scepticism or debate about the role of atmospheric CO2 can be tolerated. The science is “settled” – seemingly any tactics are justified for the greater good.
Peter Kalmus is a data scientist at NASA and was recently arrested outside the JP Morgan Chase building in Los Angeles during an Extinction Rebellion tantrum. Wearing a large XR badge, he raged: “I have been trying to warn you guys for so many decades that we are heading towards a fucking climate disaster… it’s got to stop, we are losing everything… we are seeing heat domes, people are drowning, wildfires are getting worse… it is going to take us to the brink of civilisational collapse.” He later described his experience in the Guardian, adding: “If everyone could see what I see coming, society would switch into climate emergency mode and end fossil fuels in just a few years.” In his view, it was no exaggeration to say that Chase and other banks “are contributing to murder and neocide through their fossil fuel finance”.
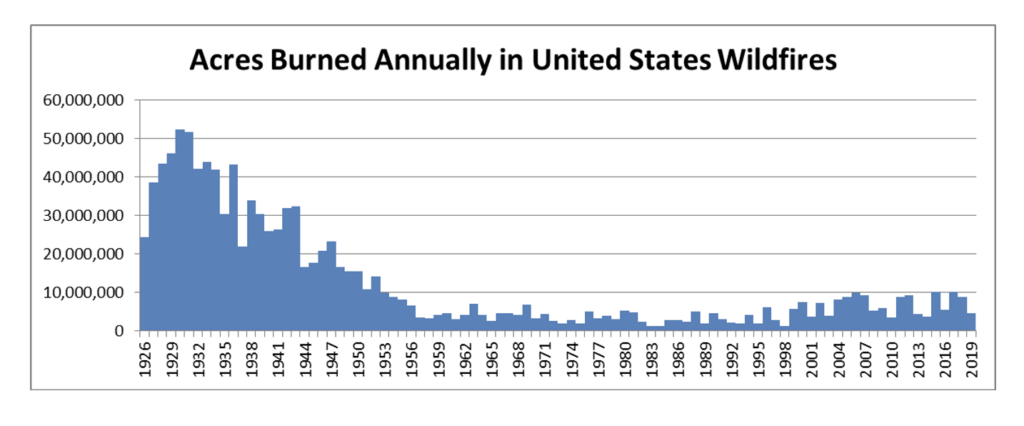
It is interesting how zealots such as Kalmus are focusing on bad weather events rather than the increasingly unreliable global warming motif, for their ‘end is nigh’ political messaging. Heat domes became fashionable last year in North America when it was discovered that some parts of the country are warmer than others during the summer. Wildfires provide plenty of scary headlines, not least when the National Interagency Fire Center (NIFC) – the keeper of all US wildfire figures for decades – removed all its data from before 1983.

As the graph above clearly shows, wildfires were far worse in the past. 1983 just happens to be the lowest point in the entire record from which a small recent rise can be seen. The data going back to 1926 is simple to compile – the number of fires and acreage affected. In the past, the NIFC noted that figures prior to 1983 may be revised as it “verifies historical data”. Last year it suddenly removed all the collations prior to 1983, stating that “there is no official data prior to 1983 posted on this site”. Is that what “verifying” means in climate emergency-word? Deleting?
Commenting on the move, the climate writer Anthony Watts noted: “This wholesale erasure of important public data stinks, but in today’s narrative control culture that wants to rid us of anything that might be inconvenient or doesn’t fit the ‘woke’ narrative, it isn’t surprising.”
Chris Morrison is the Daily Sceptic’s Environment Editor


To join in with the discussion please make a donation to The Daily Sceptic.
Profanity and abuse will be removed and may lead to a permanent ban.
As I’ve said before, we’ve had wild fire in Sutherland. And wild fire in Australia was caused by poor land management. The fellow who broke environmental laws and created a firebreak round his home survived unscathed during one of them…
And didn’t the so-called United States have a great dust bowl in 1934?
(And hasn’t global forest cover been increasing, despite the scare stories from the Amazon?).
How convenient he fires in California and Australia in 2018/19 were for the Carbon Neutral narrative – arson as Global Warming terrorism anyone?
I don’t know about you but I am sick to death of being lied to, deceived, conned, vilified, threatened and coerced by an array of fraudsters, crooks and thieves, and which infest our scientific and political institutions. It does not matter if it is Covid, Climate Change/Global Warming, the same mind-set proliferates “we know best, if you don’t agree with us, you are a denier”.
I have had enough of them and I don’t see why I should continue to keep paying ever-increasing taxes to fund these dishonest charlatans and their useful idiot supporters.
I’d add pesticides. So there.
None of which have eliminated you.
Bill Gates
What does Bill Gates have to to with pesticides?
Two things Hugh doesn’t like, therefore they are the same thing.
Same mentality as climate alarmists. Repeat it often enough and it must be true.
That’s right, Bill gates.
Is there anything Gates hasn’t got his fingers into?
Melinda, at least not recently
Frank Warren got shot in 1989 and he’s still alive and kicking, so I guess we can conclude that firearms are safe (if not effective).
Your options are:
1 – Stay angry but keep on drinking the KoolAid anyway
2 – Lose your job, your house, your family and go to prison.
Neither of the above will have the least effect on what is happening, of course.
“Commenting on the move, the climate writer Anthony Watts noted: “This wholesale erasure of important public data stinks, but in today’s narrative control culture that wants to rid us of anything that might be inconvenient or doesn’t fit the ‘woke’ narrative, it isn’t surprising.””
(As in “Watts up with that?).
They really are counting on people’s ignorance, aren’t they?
“Who controls the past controls the future: who controls the present controls the past,” repeated Winston obediently.
Highly recommend reading the comments section on the link to the guardian article provided within this piece. They are hilarious. Literally squabbling between themselves to show who is the most virtuous. It’s a perfect example of the mindset of these childish moronic Guardian readers. My favourite so far is the person who asks the rheoretical question “How many people can honestly say they have no plans to fly somewhere for a holiday?” and reading the idiotic tw*ts queue up to answer it.
These people are needy children who need constant reassurance. They are also the very same people that have established positions of authority, hence influence, in every single institution on the land. These are the people that are now running the show – children.
Where is that link, the only one I can find is to the Watt’s up with that blog in the last paragraph?
7th paragraph. “later described” is the link.
https://www.theguardian.com/commentisfree/2022/apr/06/climate-scientists-are-desperate-were-crying-begging-and-getting-arrested
And WUWT is great – as was the late, great Christopher Booker, Bill Gates.
History doesn’t re-write itself, you know!
No …those in power who win the wars write it of course – “propaganda of the victors”.
Presumably then, atmospheric heat has been absorbed by the oceans in the past, which has to be released at some point in time.
Now, perhaps?
Or do the oceans just continue to absorb heat until they are boiling?
Usual fabricated nonsense from the congenitally moronic alarm mongers.
Excellent point. It’s what we call ‘critical thinking’ and would spin Guardian readers into a frenzy of emotion-driven abuse.
Even Argo Buoys are a complete fraud. They ‘Park’ at 1,000 feet before diving to 2,000 feet every 10(?) weeks before surfacing to transmit their data, then returning to their parked position.
Strangely, they haven’t detected any extra heat, which the alarmist nutters blamed on different buoy manufacturers and problems with calibration etc. which they ‘fixed’ by data manipulation.
What’s really interesting is, however, that while they scoff at Roy Spencer’s tropospheric temperature data, whimpering “because we don’t live in the sky” they embrace ocean temperatures forgetting the inconvenient fact that humanity does not live at 1,000 – 2,000 feet beneath the sea surface.
They are just too dumb to string together a coherent argument.
Bill Gates
Is Bill of Gates in the room with us now, Hugh? Can we assimilate him?
Blame it on those pesky pesticides.
Bill Gates’s pesticides.
Interesting. Don’t suppose you’ve got a link to any of this stuff? I’ve a brother who is convinced the world is going to end next week. He’s a Guardian reader. Also a Covid fanatic. Also a blo*dy idiot.
I wouldn’t bother, trying to get through to people like that really is pissing in the wind.
Best to break the family ties. He’s batting at 100% lunacy
Forget the ‘Guardian’ and the ‘lost’ bought -out and sold media – we need to establish new ones run by real journalists .
100% agree. They’re just subtle shades of the same thing.
Bill Gates
Is living rent free in your mind. Klaus approves.
More likely both ” rent and accountability free” in your mind from your posts.
Haven’t you read RFK’s The “Real Anthony Fauci”yet ? Mr Gates and his ‘philanthropic’ activities attract some interesting attention.
Anthony Watts is not a “Climate writer”.
He runs a science blog (as stated on his site), which is utterly dominated by “the most important issue of our time” – if the doom mongers are to be believed.
WUWT is perceived as a climate site because every day the MSM or some bonkers scientist produces nonsense with ‘Klimate Katasrophe’ in its title even if the subject is the sexual proclivities of the natterjack toad.
No one of course is in the least bit interested in natterjack toads of course, but including ‘Klimate Alarm’ in the research study’s title automatically, and instantly, attracts money for the research.
It then automatically, and instantly, sinks into obscurity as yet another well funded waste of time and effort.
Bill Gates
P.S. I love natterjack toads.
Hughie wanna cracker.
You have the intellectual capacity of a natterjack toad.
Bill “no points” Gates.
Silly me. There was I thinking that a chap who writes about climate and edits a science blog about climate, could be described as a climate writer.
What was I thinking.
Go and read his site. It is not “a science blog about climate”.
It is a science blog. Numerous subjects are discussed.
Also recommended is ‘Notalot ofpeopleknowthat’
The science is settled. The historical data is however subject to change.
Science is never settled or the earth would be circled by the sun and be flat.
Hugh now demonstrating his Obsessive Compulsive disorder. 🤣
#NotACult, I’m sure.
How Dare You!
Bill gates.
Why assume a conspiracy when there is a perfectly reasonable publicly available explanation?
The US wildfire data before 1960 was useless. The sources are no longer known and the figures are absurd. 50m acres a year would be a disaster that dominated the headlines round the world. It is an area larger than the entire state of Nebraska. The real scandal is that is was ever included as national data. From 1960 there was some kind of order in the collecting of statistics but still using a variety of methods. It is only from 1983 that there was a consistent rigorous method covering the whole of the USA.
But Klimate data going back over 100 years, is reliable.
Riiiiiiight……..
The age of the data is not the point. Hundreds of scientist pore over the climate data comparing different sources and analyses under intense scrutiny. The wildfire data prior to 1983 is essentially a collection of random reports of uncertain source and meaning which have been subject to almost no analysis or verification.
How difficult is it to count wildfires and make a reasonable estimate of the area burnt. Obviously beyond the capability of anyone born before 1960. The decline in wildfires predates 1983, and this would seem to indicate the historical data was picking up an accurate trend back to the1940s.
How difficult is it to count wildfires and make a reasonable estimate of the area burnt.
Read the link. You need to make sure you are only reporting them once. (Several different agencies are going to be aware of a wildfire). You have to decide what is a wildfire and what is intentional burning. You need a consistent method of estimating acreage and so on. Anyway the sheer absurdity of the data shows something was badly wrong. Obviously the USA was not having wildfires every year equivalent to the entire state of Nebraska.
The decline in wildfires predates 1983, and this would seem to indicate the historical data was picking up an accurate trend back to the1940s.
The fact that rubbish data shows a decline proves it is not rubbish? I don’t get the logic.
It seems quite likely that the reason the reported data showed a decline from 1930-1960 is that reporting gradually improved getting closer to the truth. But really the only statistically sound thing to do is to accept the data are invalid prior to 1983.
Perhaps Forest Management to prevent fires was more efficient? Clearing tinder dry brushwood fro example?
Disorganised collection of data usually results in under reporting not over reporting.
Depends on the data. If you try to count road accidents by just asking for reports from anyone or organisation involved in an accident then you are going to get gross overcounting..
Meanwhile Mark Stein blows wide open the ‘Vax Narrative’ on GBNews – catch it on You Tube before it is “cancelled”.
The Vax Billionaire would-be Global Emperors have no clothes and our MPs have no excuse for not acting on te revelations!
As with all of their crimes the tactic will be to simply ignore the evidence and carry on regardless.
A new report from the same globalist scientists now proves that the unvaccinated suffered far more vaccine adverse events than the vaccinated.
I rather enjoyed that one. Thank you.
We a are all looking forward to globohomo rewriting the history of the dust bowl era in 1930s America, I’m sure they will decide that the history was written by anti LGBT Nazi extremists and must be dismissed or some such bollocks.
[Will it be illegal to write ‘bollocks’ under the Tories new internet censorship Bill, I mean the word would probably upset the trans community and be considered hateful]
‘… “has been absorbed in the oceans”.’
And miraculously managed to get from the atmosphere into the ocean depths without going through the upper 1km of water and warming it, where the temperature is monitored by the ARGO buoy network.
Vladimir Lenin was born on April 22, 1870. On his 100th birthday, the date was renamed to “Earth Day”
https://superu.net/video/2d3493c7-fbe3-4ae8-bdb9-faa5270454cb/
Google Celebrates Lenin’s Birthday
Tony Heller
Stand for freedom with our Yellow Boards By The Road
Monday 25th April 5.30pm to 6.30pm
Yellow Boards
Junction A332 Windsor Rd &
A330 Winkfield Road,
ASCOT SL5 7UL
Wednesday 27th April 4pm to 5pm
Yellow Boards
Junction B3408 London Road &
Wokingham Road
Bracknell RG42 4FH
Stand in the Park Sundays from 10am – make friends & keep sane
Wokingham Howard Palmer Gardens
(Cockpit Path car park free on Sunday)
Sturges Rd RG40 2HD
Bracknell
South Hill Park, Rear Lawn, RG12 7PA
Telegram http://t.me/astandintheparkbracknell
That HADCRUT graph is itself a piece of propaganda. The scale of the axes leads to the impression of a sudden recent warming; in reality observational satellite data (from UAH) should be plotted alongside as it excludes the effect of progressive urbanisation of weather stations – leading to exaggerated warming – and the temperatures are not adjusted to fit a particular narrative.
I’m glad that there is an awakening about the climate crisis hoax & publishing exposing articles
I hope you’re right about awakening, but I don’t detect it. Young people in particular now seem more climate-demented than at any time since the whole lying business started in 1988.
Global Warming – a load of absolute bollox which “they” are trying to support by any data manipulation necessary. It has been so from the start many years ago which led to Gore’s “Hockey Stick” fabrication.