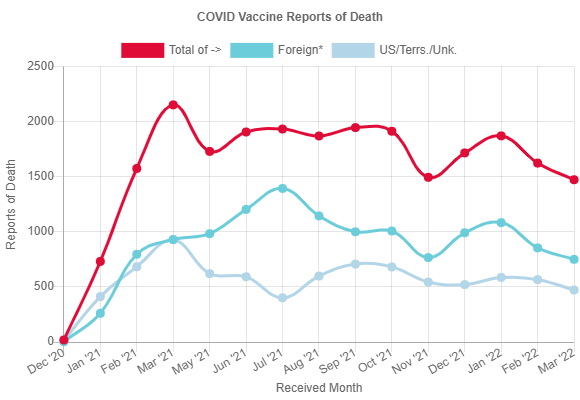
I wrote recently that, with over 2,000 deaths reported to the Yellow Card reporting system as adverse events following Covid vaccination, the true figure of U.K. deaths from short-term vaccine injury may be around 20,000. This is allowing for an under-reporting factor of 10, which, I argued, doesn’t seem unreasonable given analysis of an Israeli survey of booster recipients, which found under-reporting factors of hundreds or thousands for many adverse effects when compared to U.S. VAERS reports. The under-reporting factor for hospitalisation was 120, meaning 120 times more people reported being hospitalised as a result of their booster in the survey than in VAERS.
While it might seem that 20,000 deaths as a result of short-term vaccine injury should show up in overall mortality data, I argued that it is in fact more than possible that this number of deaths may be obscured by, for example, Covid waves and the subsequent troughs of mortality displacement, where people who would otherwise have died during those weeks died early due to Covid.
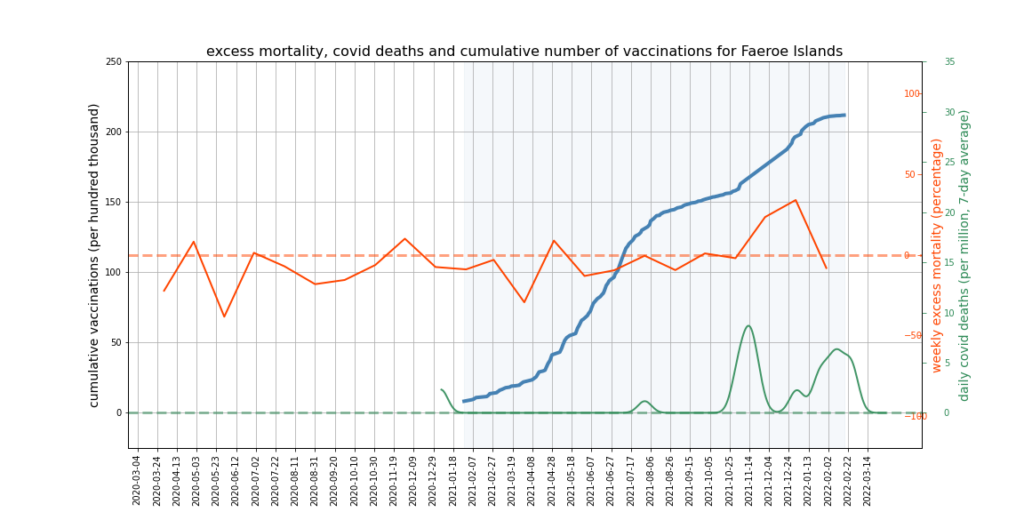
Take the example of the Faroe Islands. The Faroe Islands has a population of around 60,000 people, which is about 1,000 times smaller than the U.K. population of around 67,000,000 (using round numbers to keep the maths simple). Given 20,000 U.K. vaccine deaths, and assuming the U.K. and Faroe Islands populations are broadly comparable, we would expect around 20 vaccine deaths in the Faroe Islands, i.e., 1,000 times fewer than the U.K. If those 20 deaths are spread evenly over the 15 months of the vaccine rollout then you’d expect an average of 1.3 deaths per month or 0.3 per week. The U.K. experiences around 10,000 deaths in a normal week on average, so we can suppose the Faroe Islands experiences around 10 deaths in a normal week. It’s easy then to see that 0.3 additional deaths per week are unlikely to generate a noticeable signal among the usual 10. If the average number of deaths goes up from 10 to 10.3 per week, it’s hardly going to stand out in the statistics.
Another way of saying the same thing is that 20,000 U.K. vaccine deaths spread over 15 months works out at around 300 deaths per week, which is only a small percentage (3%) of the around 10,000 deaths per week that normally occur in the U.K. That kind of signal (10,300 instead of 10,000) will easily be lost amid Covid waves and mortality displacement as well as deaths resulting from lockdown and lack of access to healthcare. Even if some of the deaths bunch up around certain points in the rollout, such as when older people are receiving large numbers of doses, the numbers are still relatively small compared to weekly ordinary mortality (even if they are shockingly large in the context of vaccine injuries). It’s also worth noting that VAERS data show Covid vaccine death reports spreading quite evenly throughout the rollout.
As it happens, the Faroe Islands does show a slight increasing trend of excess mortality since the vaccine rollout began (see below). However, it’s not what you could call an unmistakable signal.
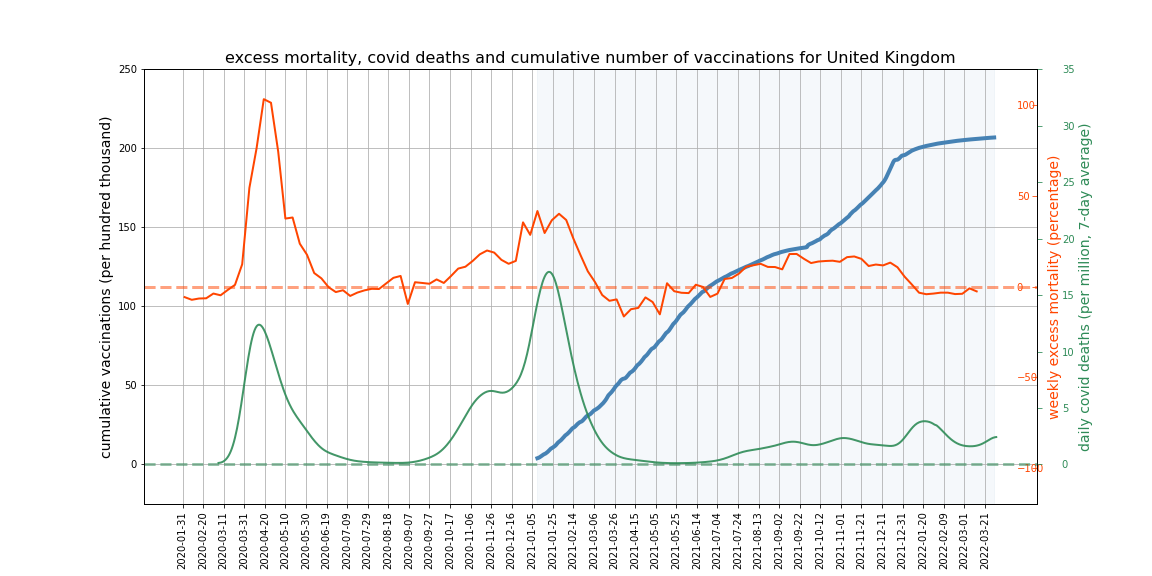
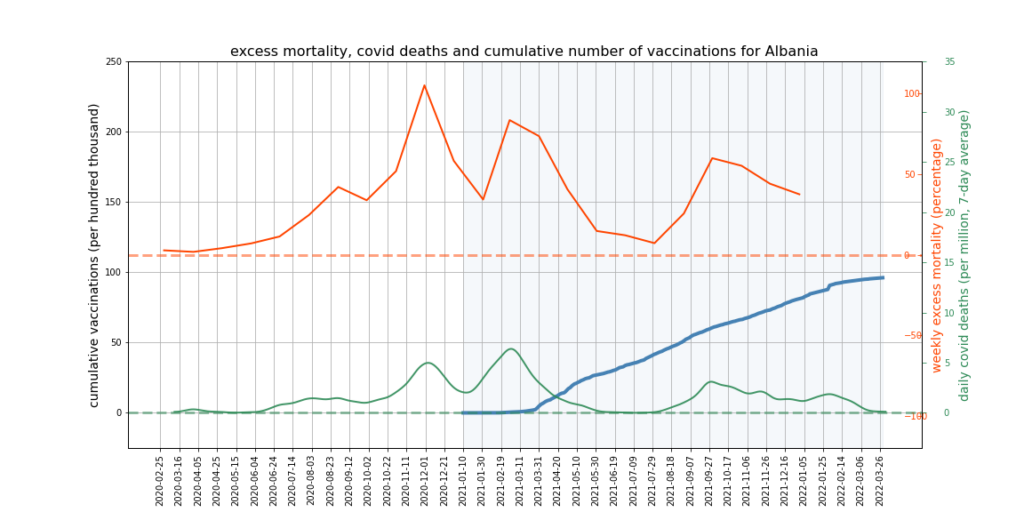
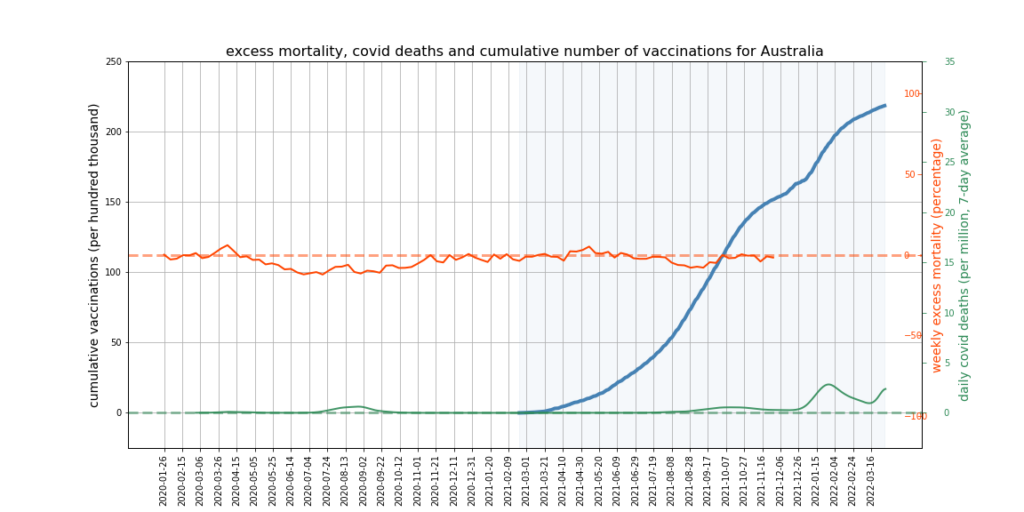
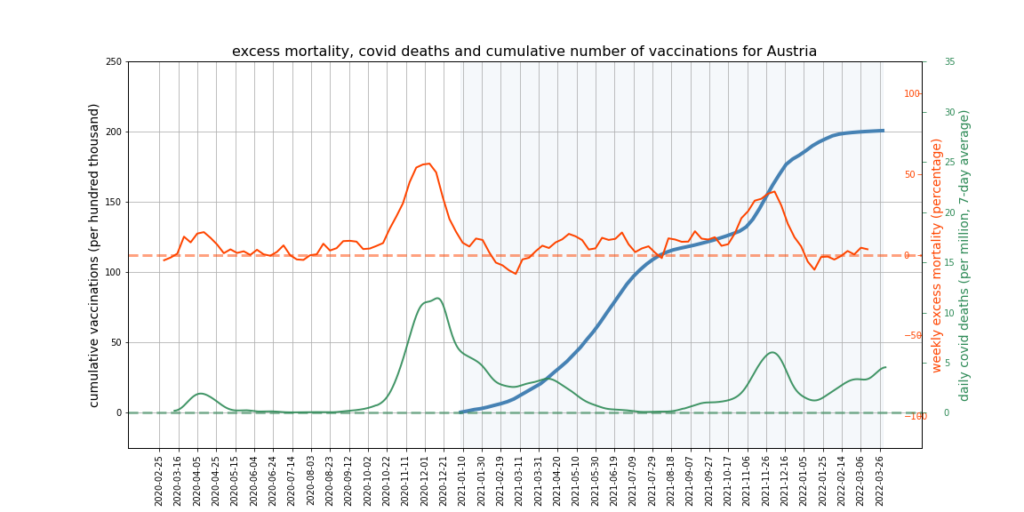
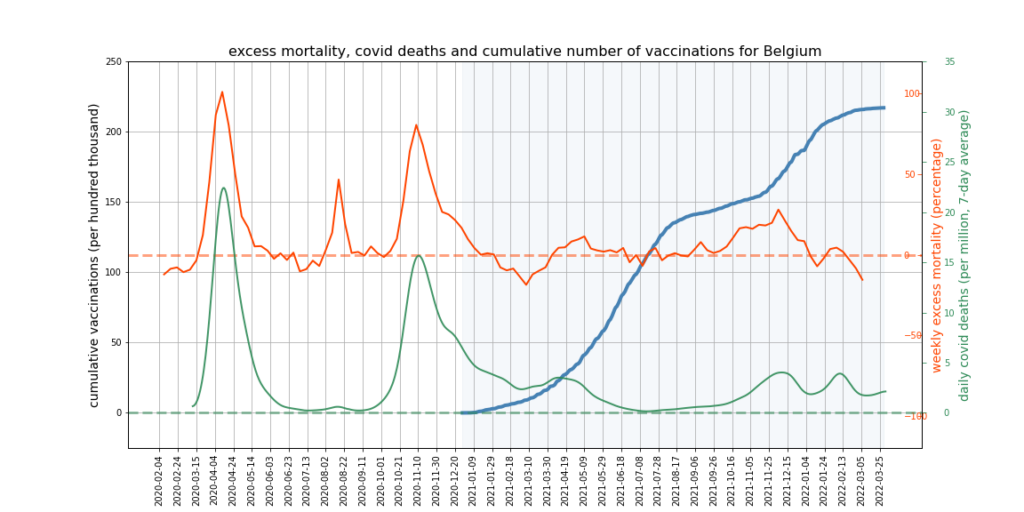
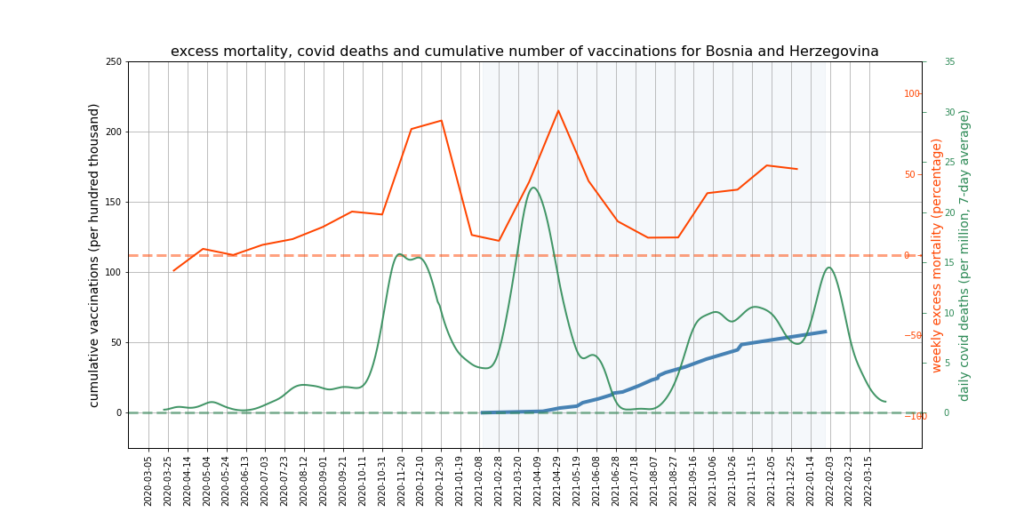
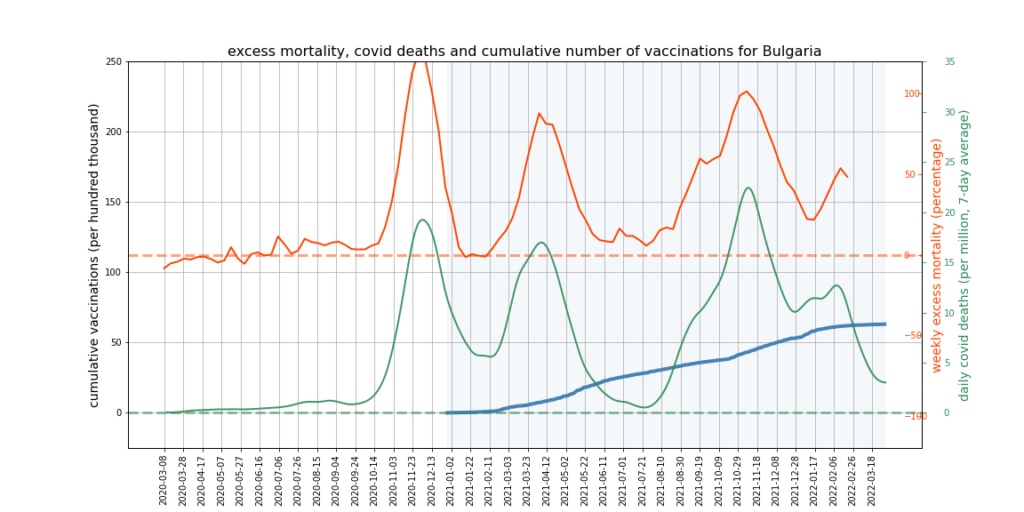
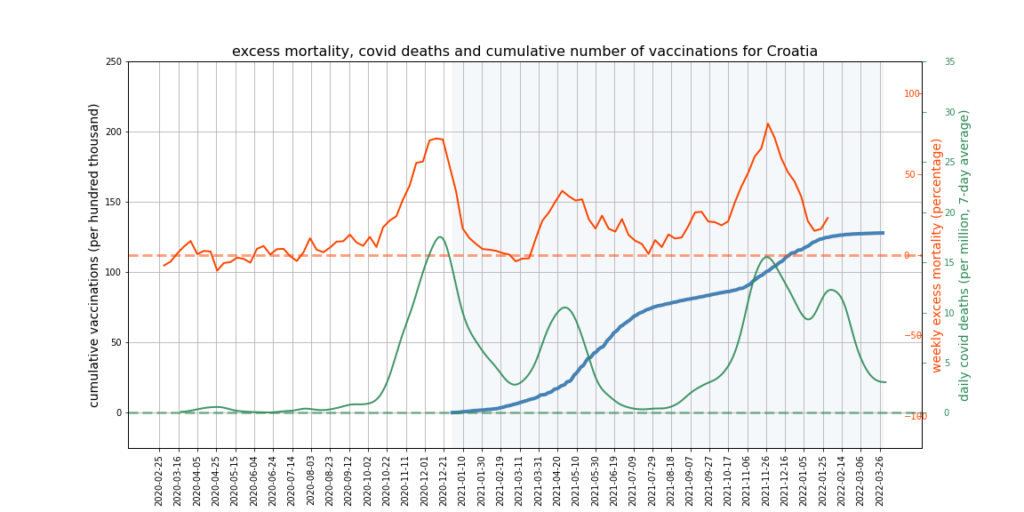
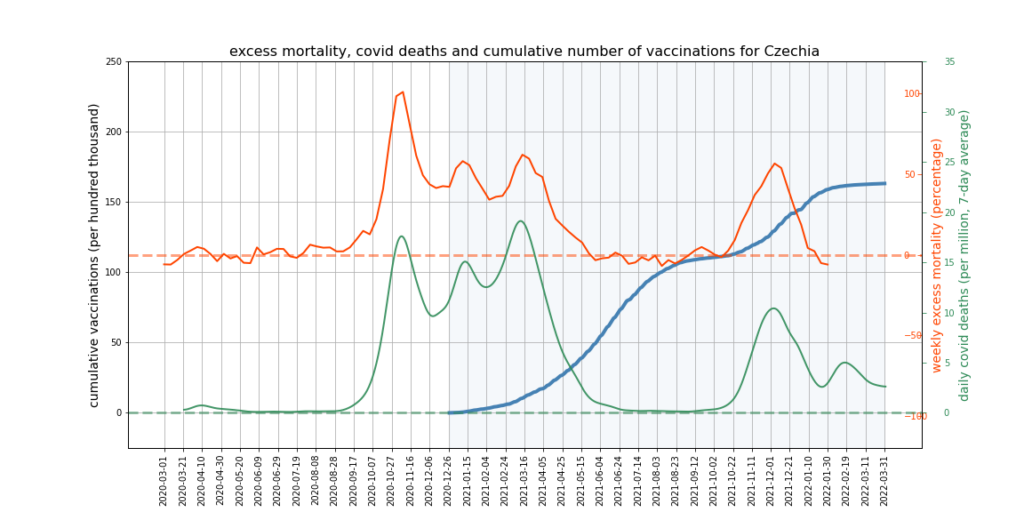
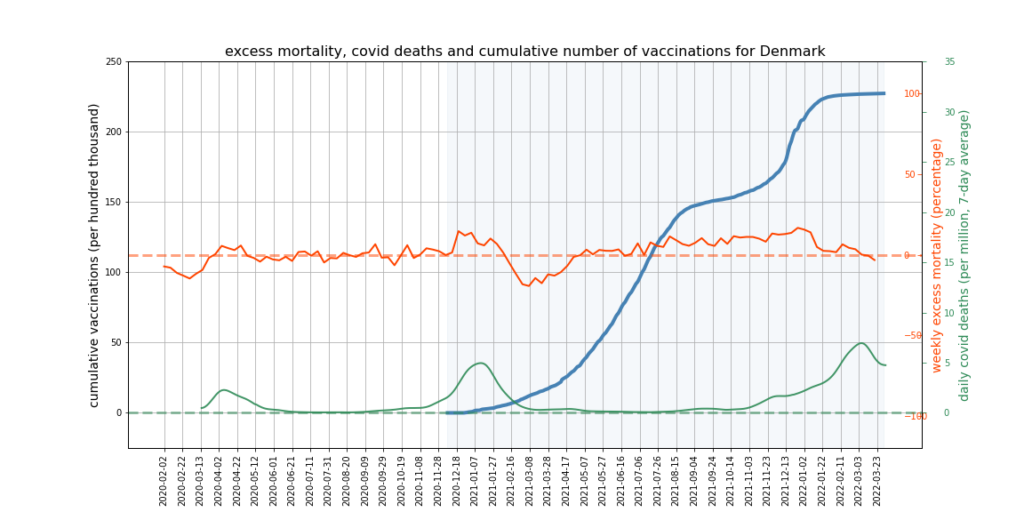
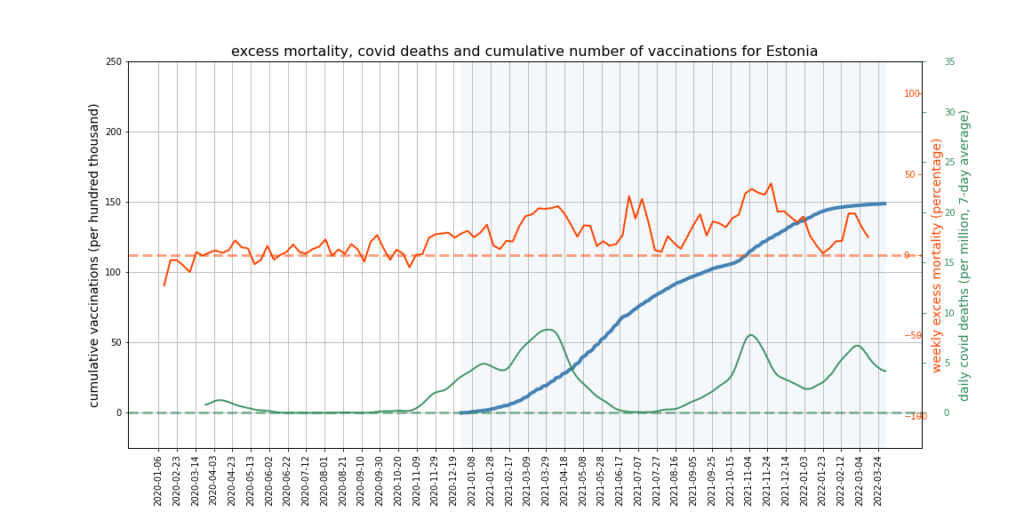
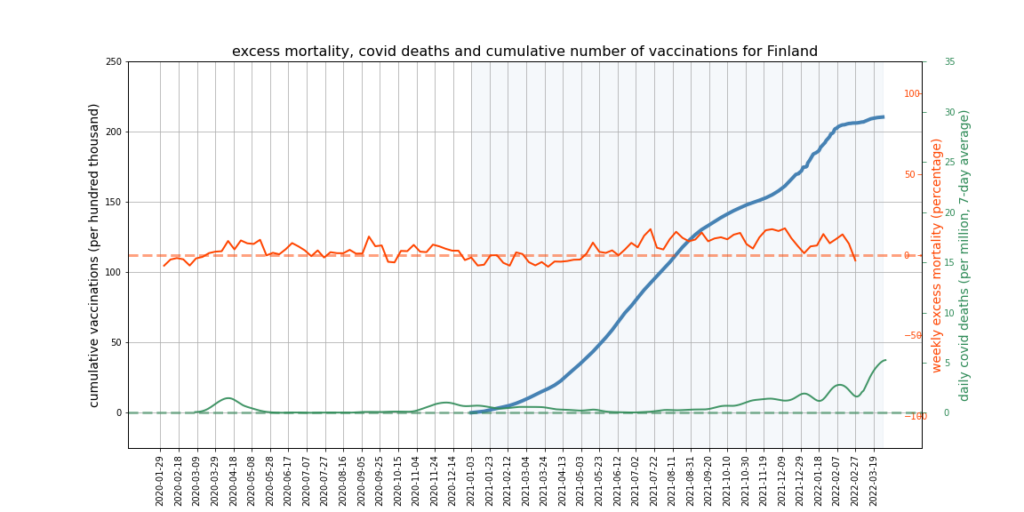
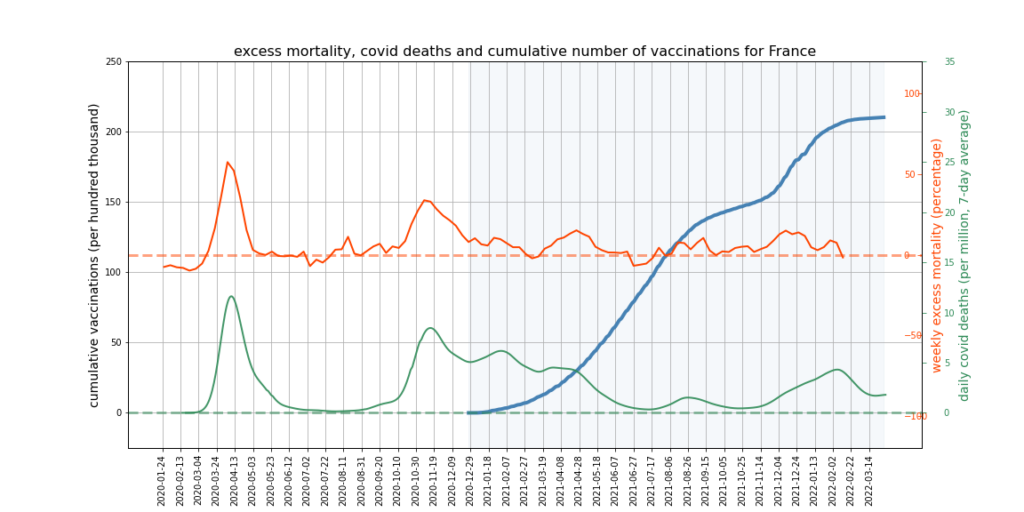
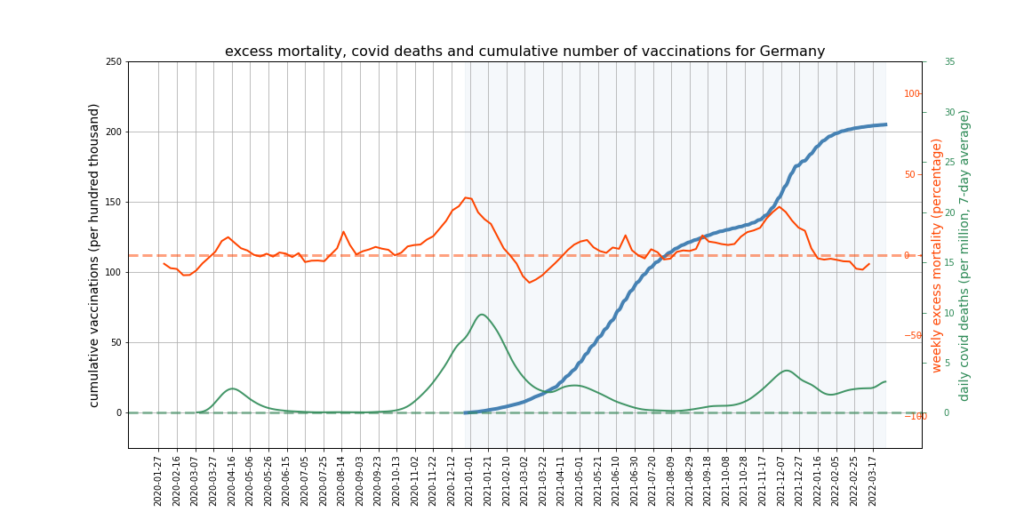
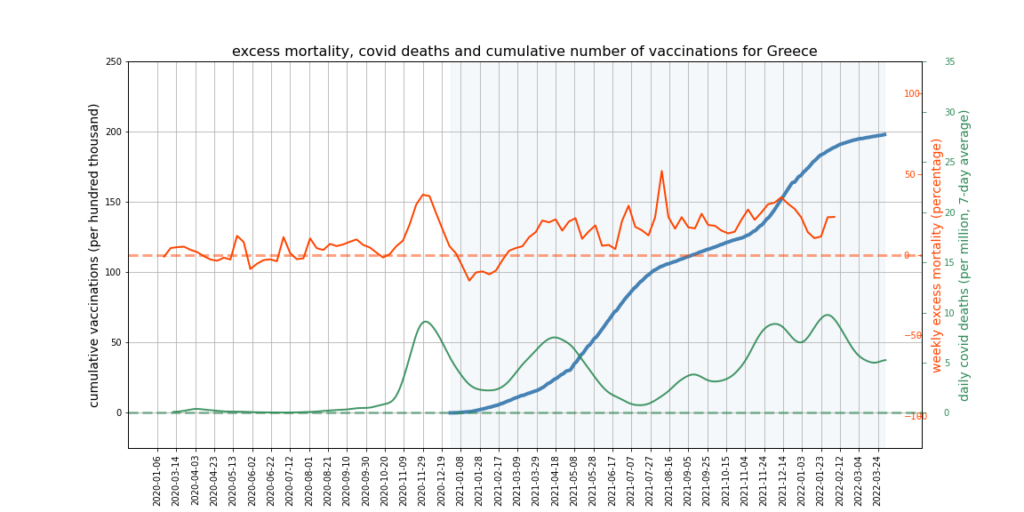
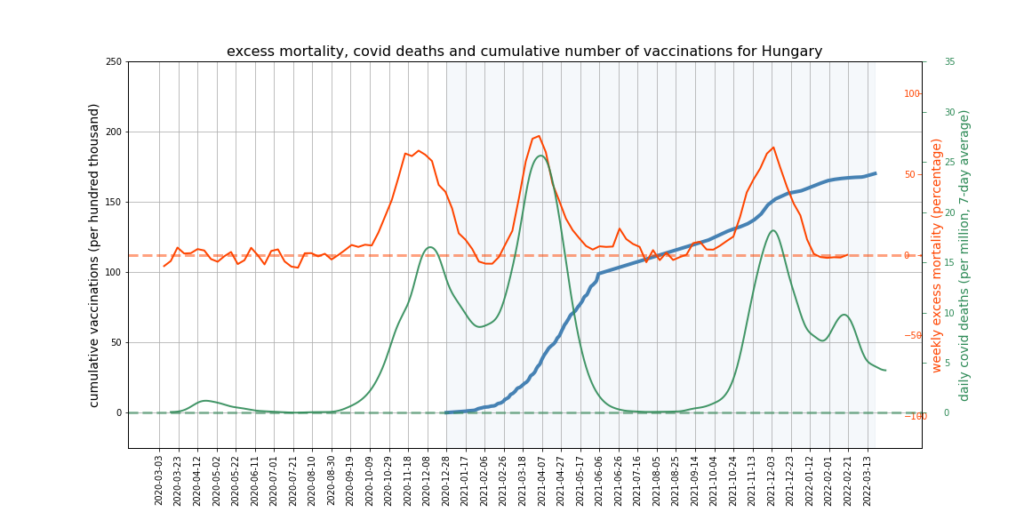
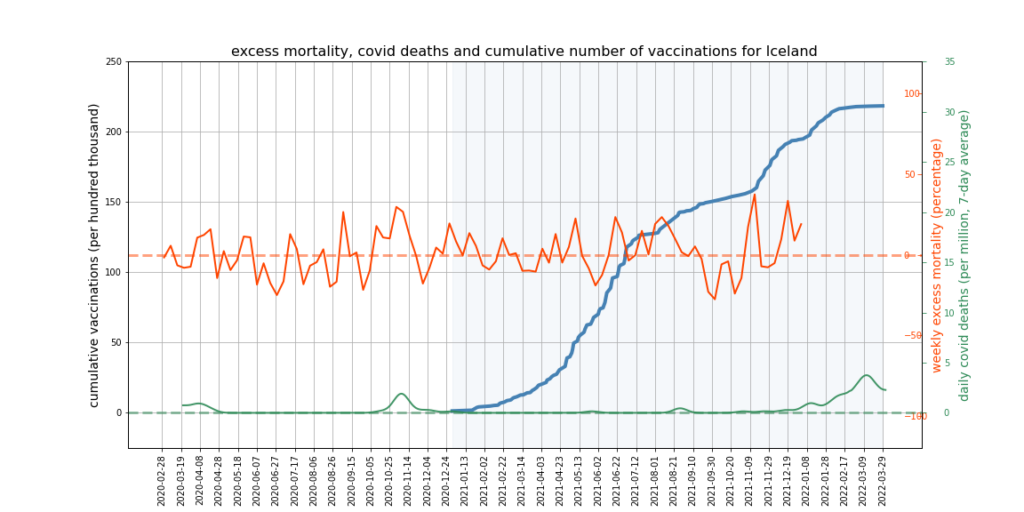
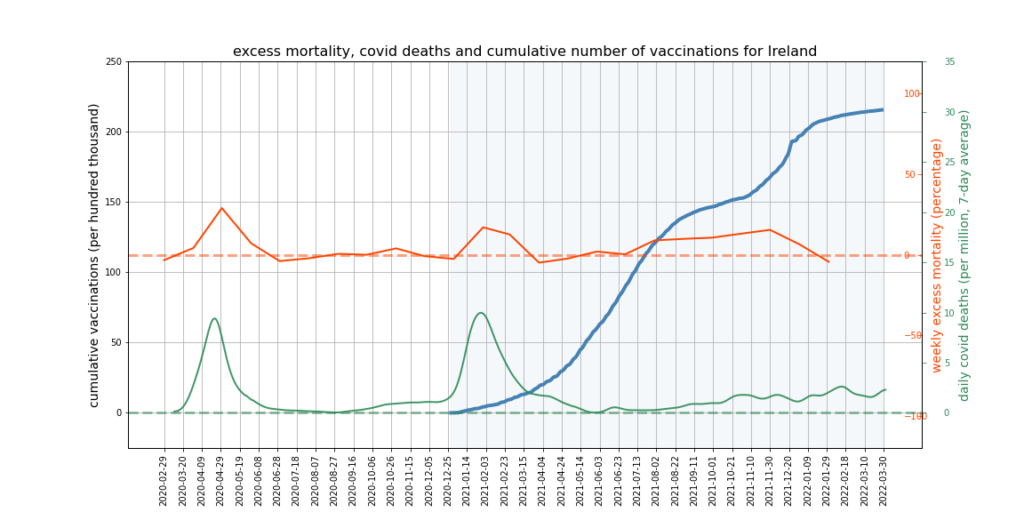
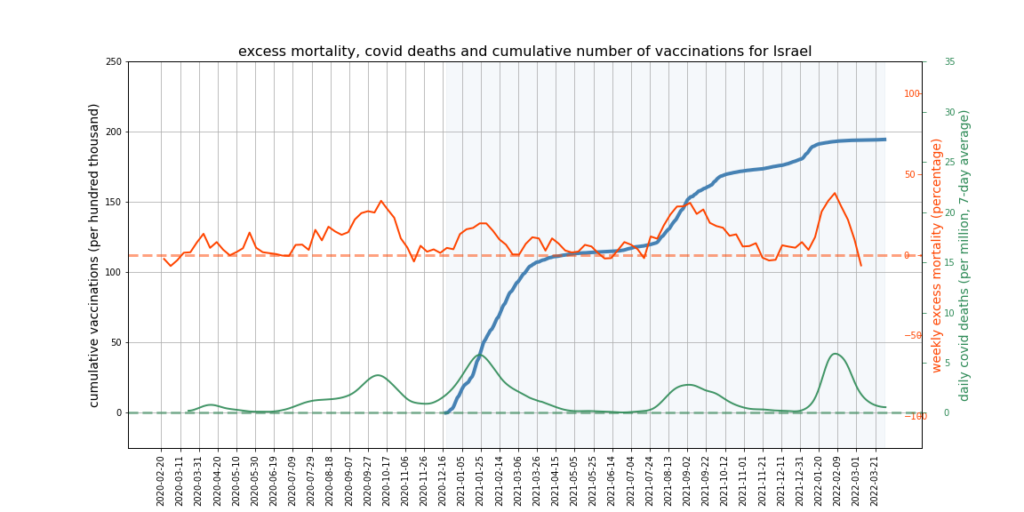
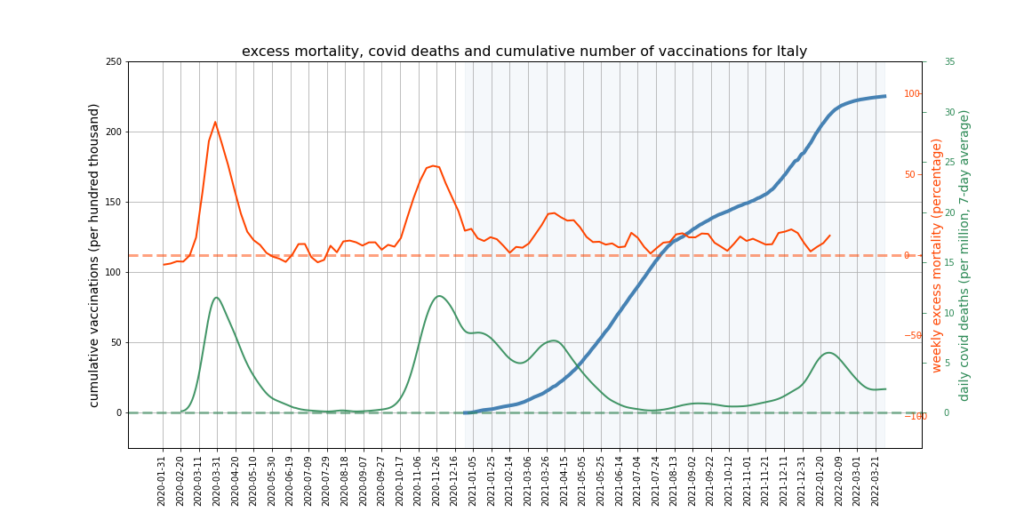
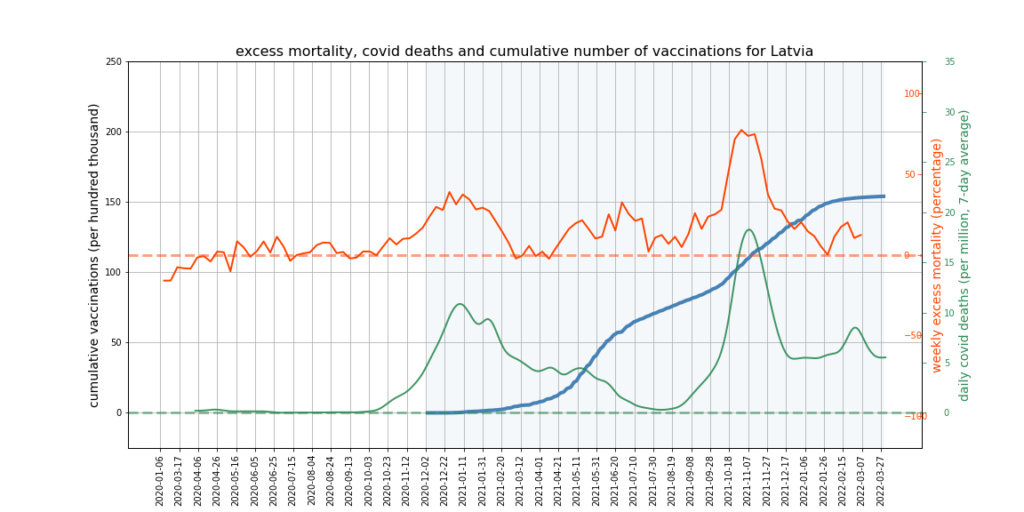
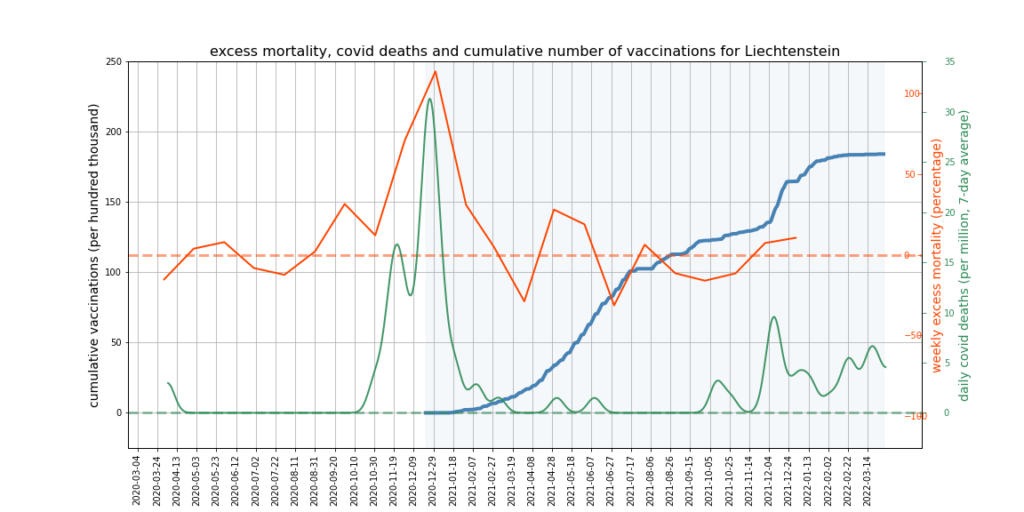
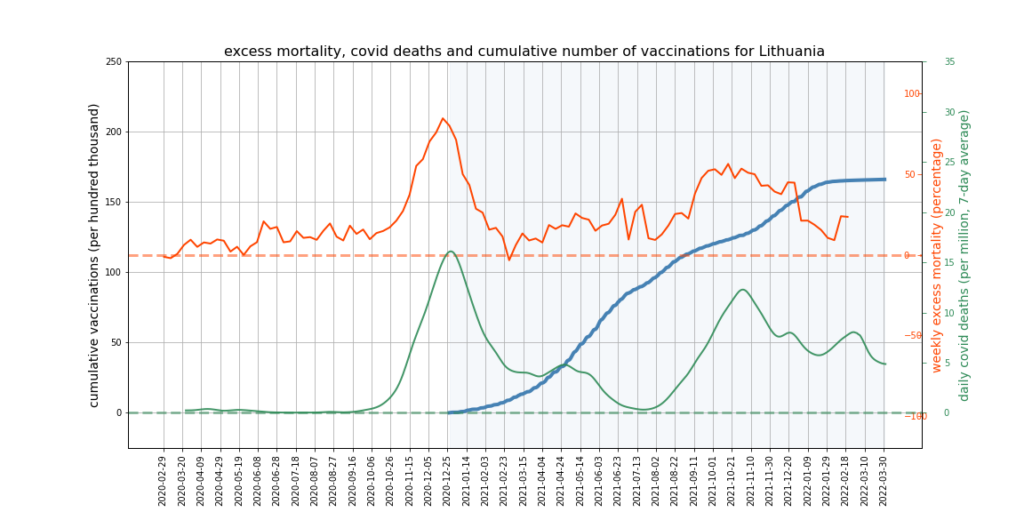
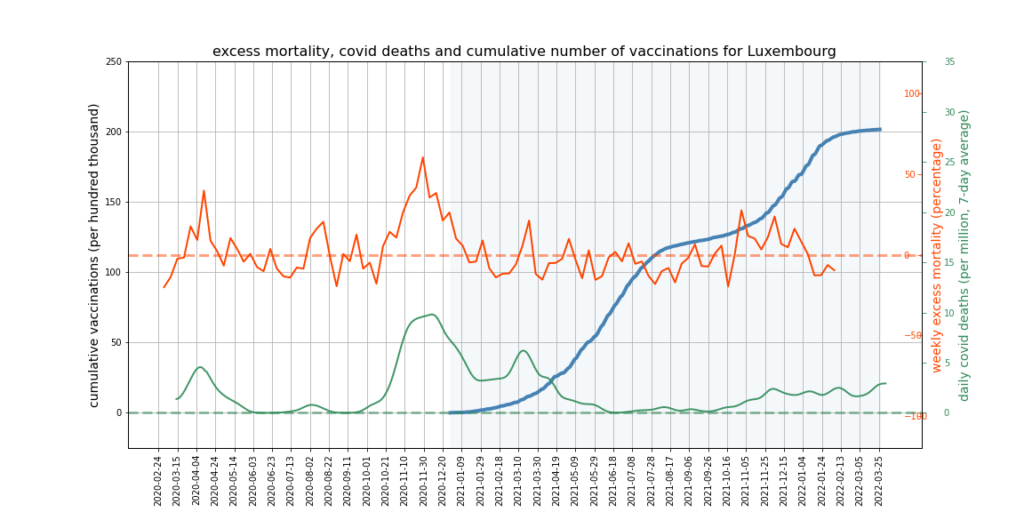
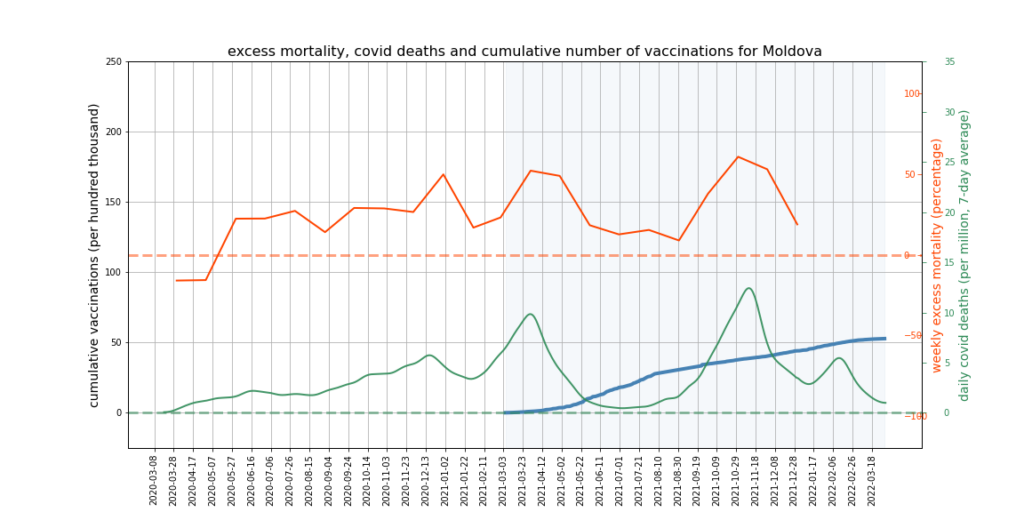
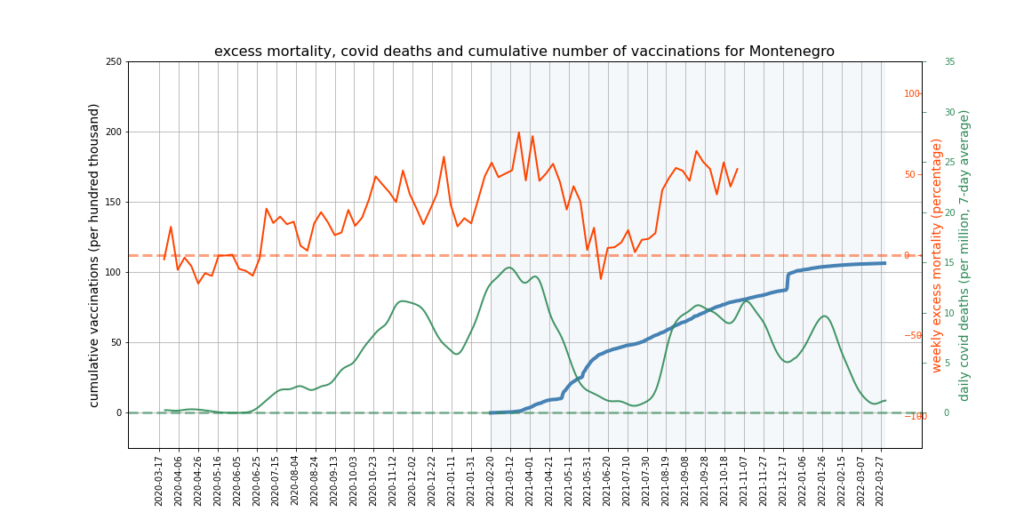
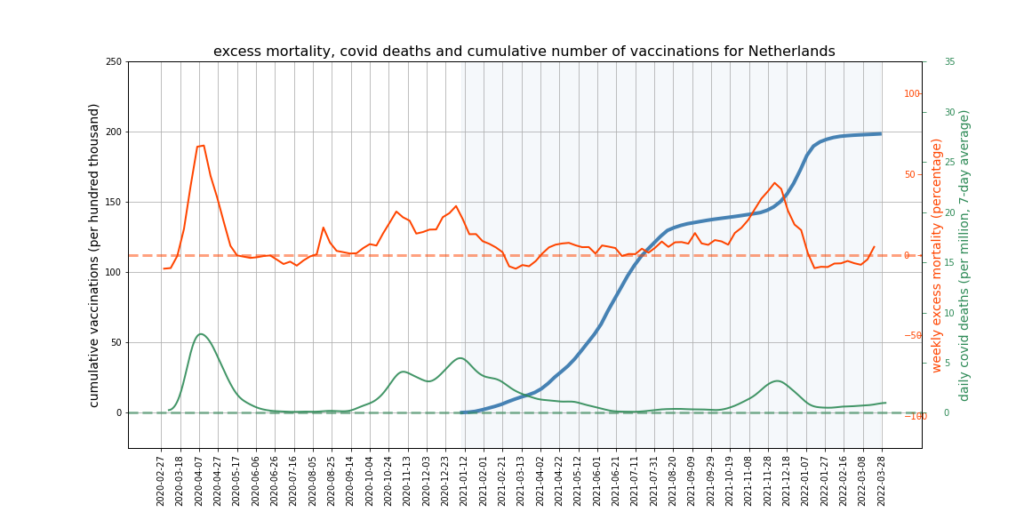
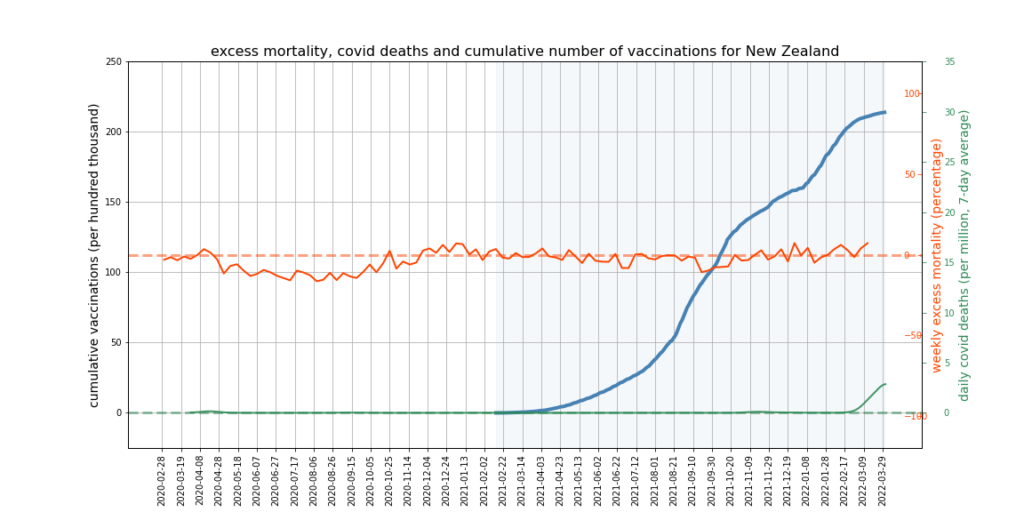
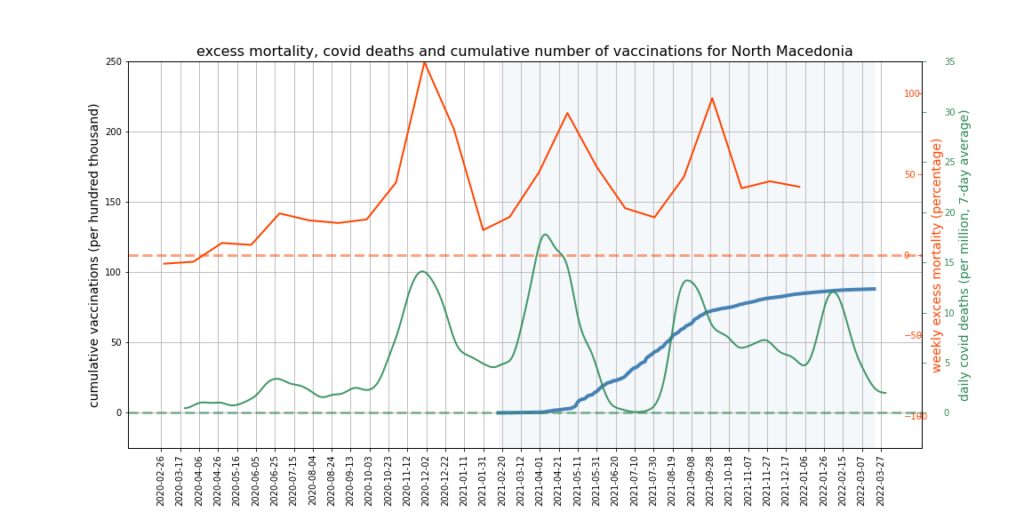
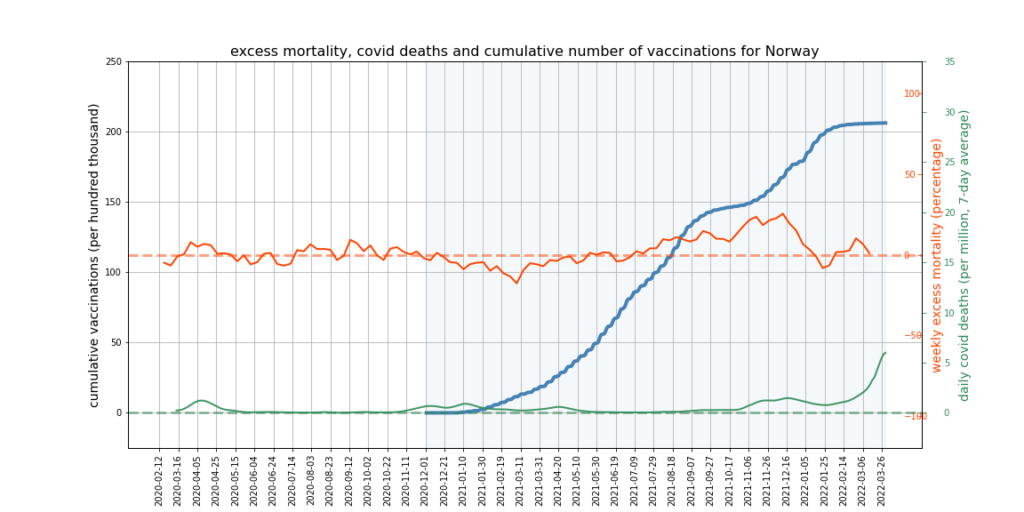
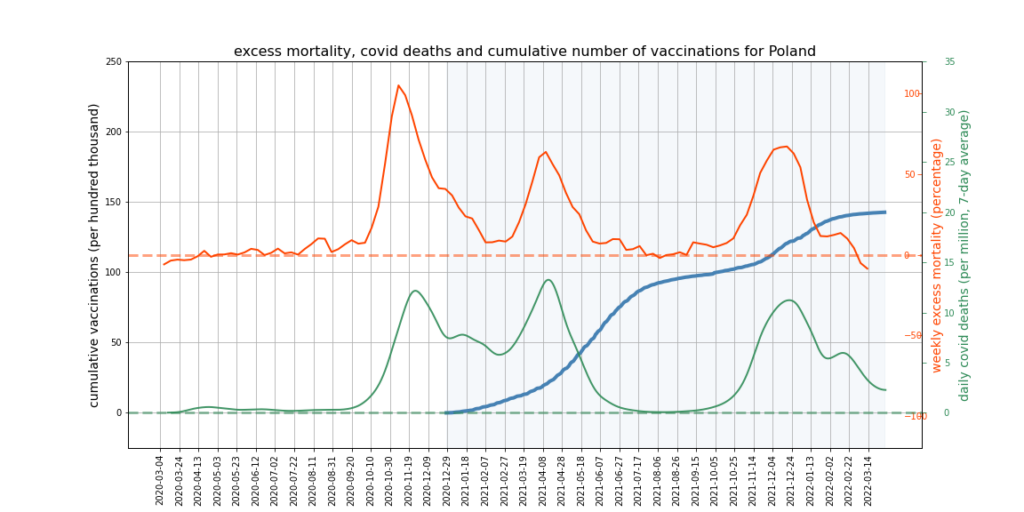
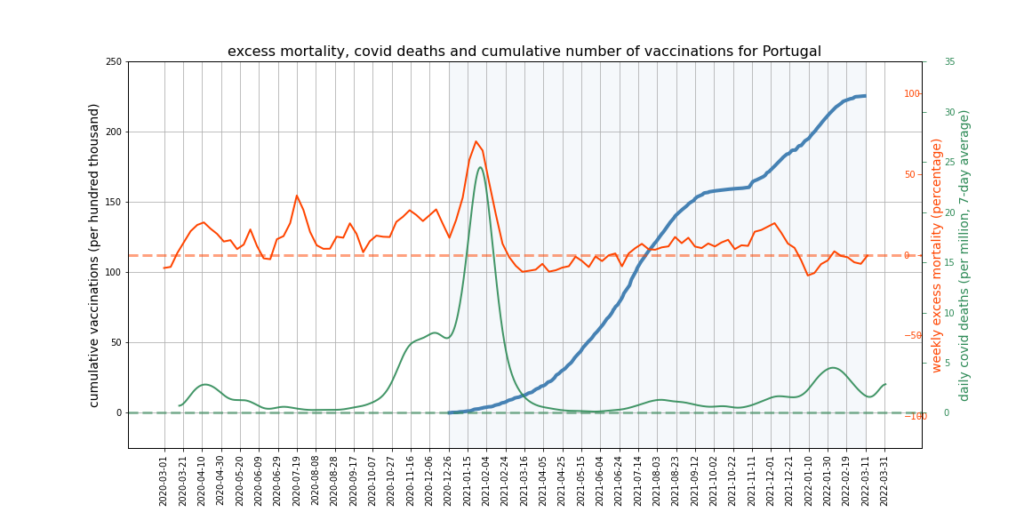
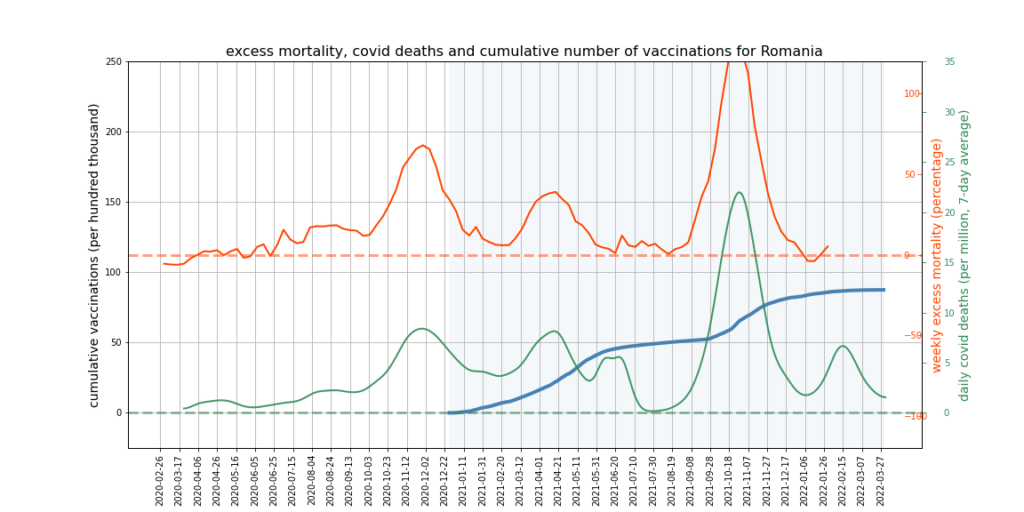
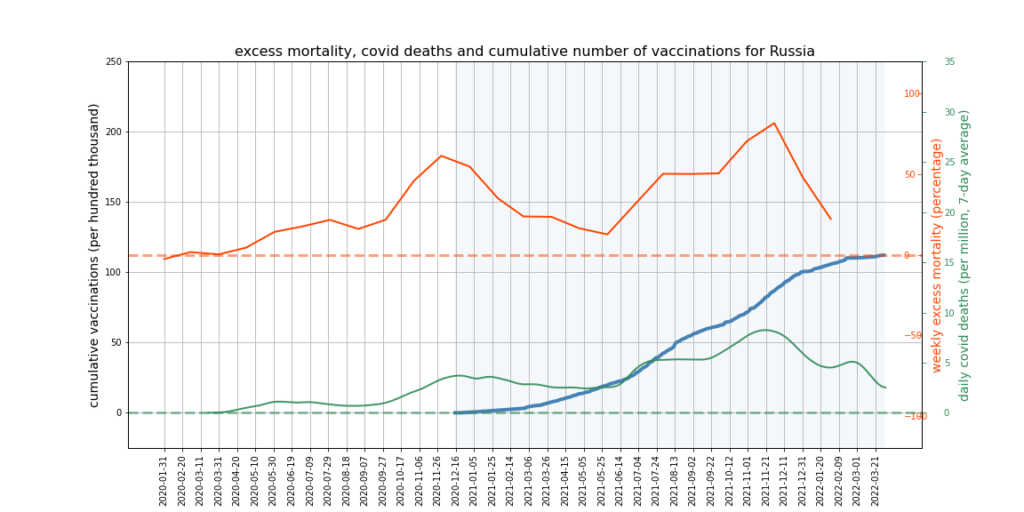
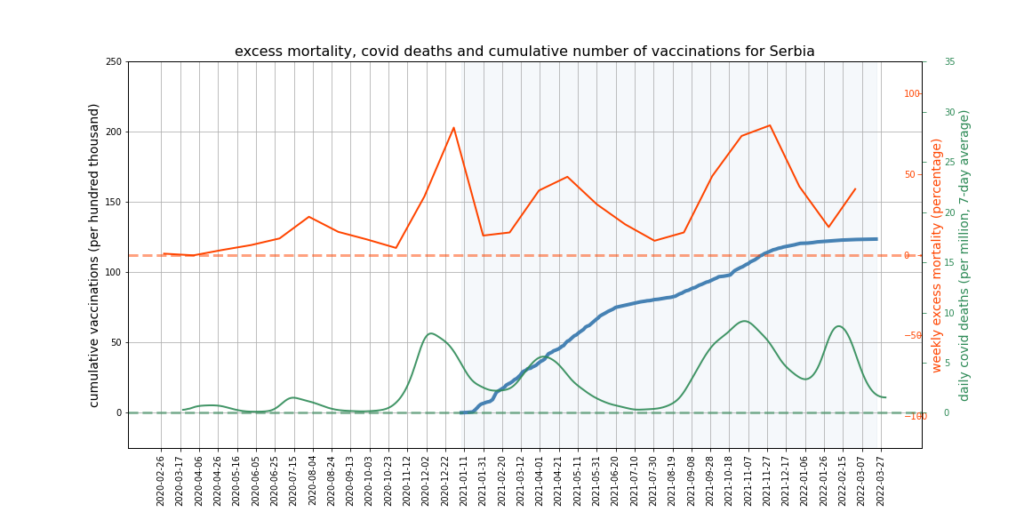
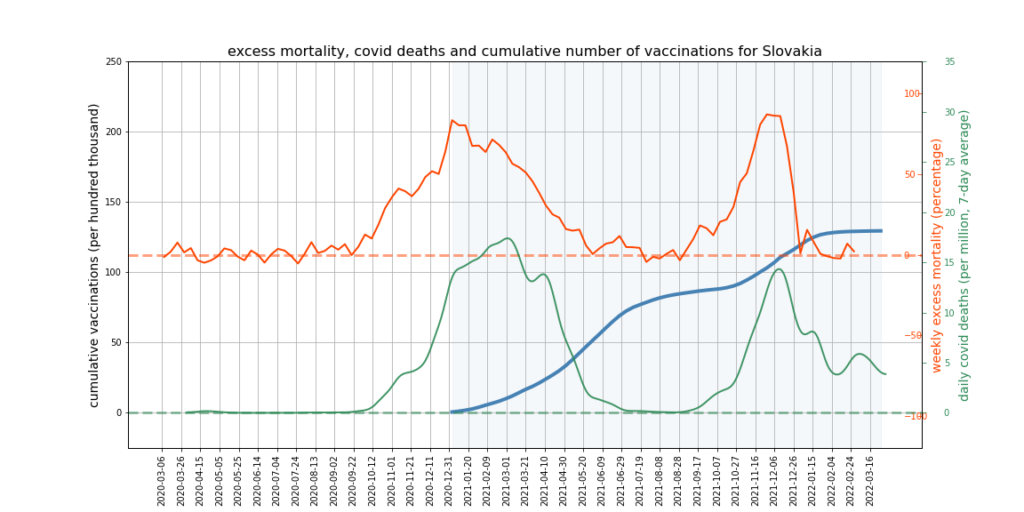
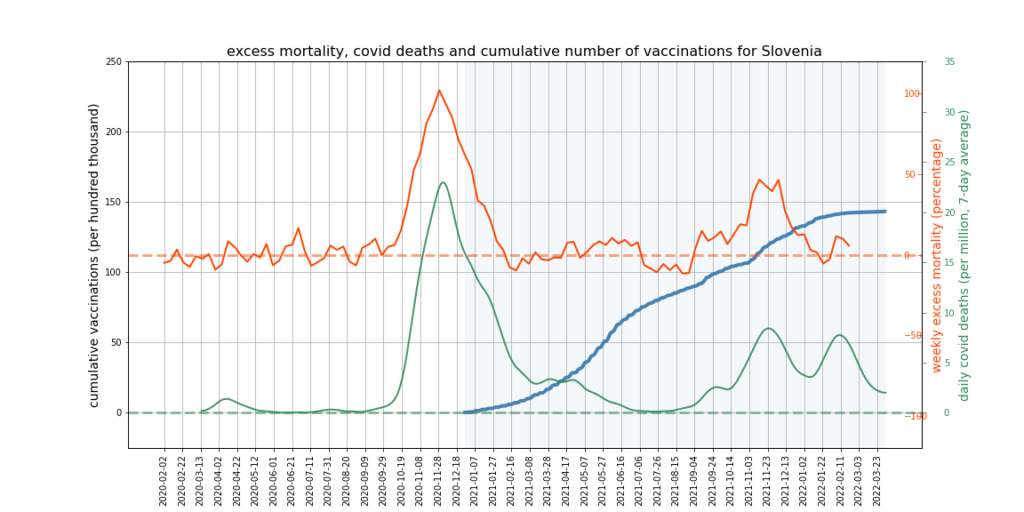
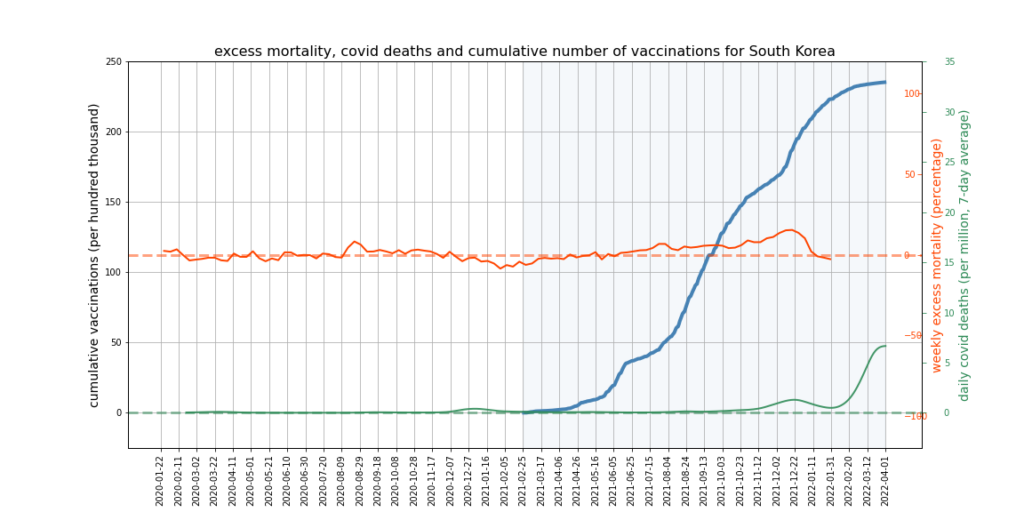
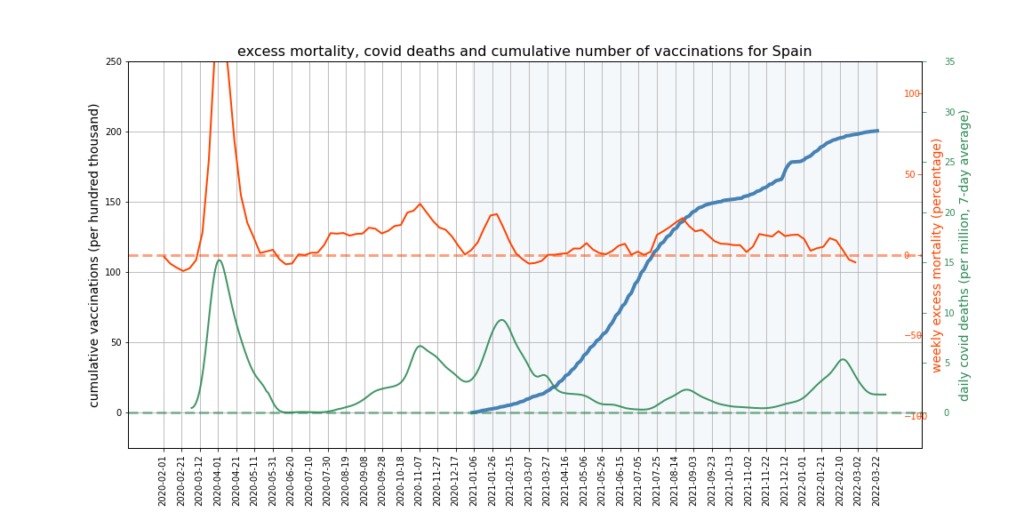
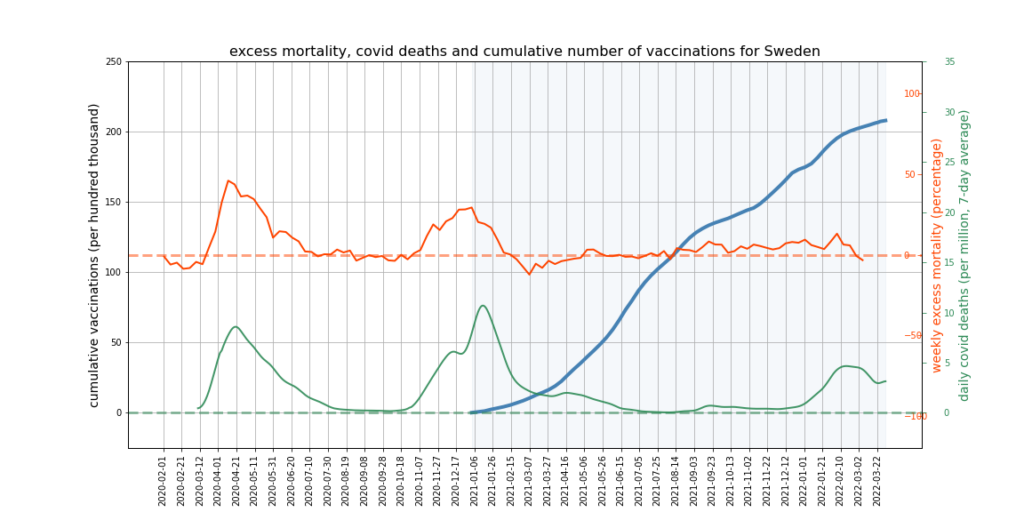
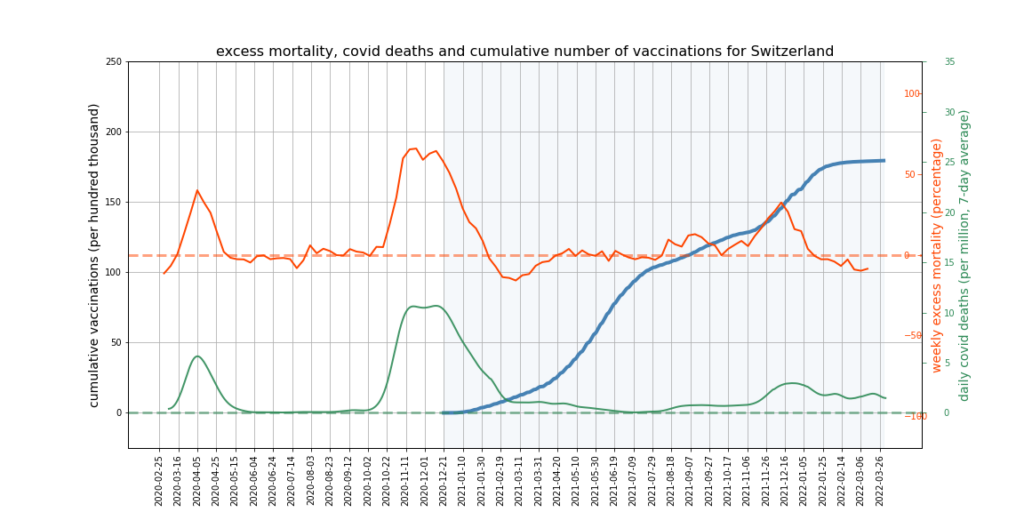
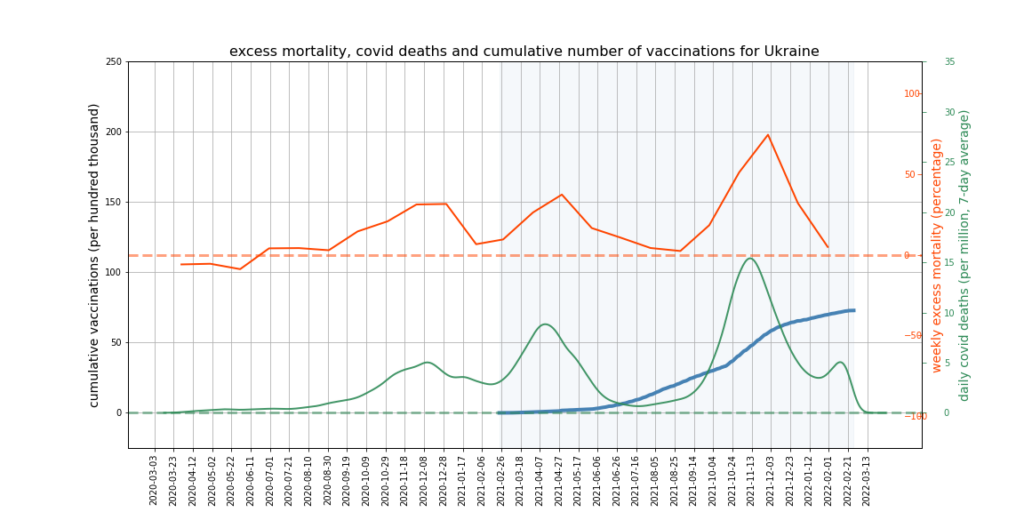
The graphs below show Covid deaths, excess deaths and vaccine doses for 42 countries, mostly in Europe but also Australia, New Zealand and Israel. In many of them a broad rising trend in excess deaths is discernible since the vaccine rollout began, with some more pronounced than others. The large impact of Covid waves and mortality displacement is also clearly visible. In many of the countries, the rollout (particularly to the elderly) was done during the winter 2020-21 Covid wave, obscuring a potential vaccine injury signal, and the subsequent mortality displacement has a similar effect. In Australia and New Zealand, the very mild winter ‘flu season’ (when flu was not around) during the rollout in 2021 resulted in low excess deaths in some of the colder months such as September, also obscuring a possible signal – though notably the winter months of June and July and, in New Zealand, August did not have the low mortality you would expect in a winter without flu. In the northern hemisphere, excess mortality in the winter just past was depressed by the mildness of Omicron, again obscuring a possible signal.
It appears there is a limit to what we can expect this kind of mortality analysis to show. More sophisticated analysis might try to adjust for the impact of Covid deaths and mortality displacement on excess deaths, and would break down the data by age and take cause of death into account. However, it’s not obvious that this kind of analysis could succeed in accounting accurately for all relevant factors, or would not become overly dependent on questionable assumptions – such as that all ‘Covid deaths’ are deaths from Covid, or what the correct extent of mortality displacement is.
What I think can be said with confidence based on the charts below is that the mortality data are compatible with the assumption that the true number of vaccine deaths is around ten times the number reported to the adverse event reporting systems. While the data in some countries may show clearer signals, they don’t in all countries. However, they are nonetheless compatible with the worrying signs seen in the adverse event reporting systems and elsewhere.
What we really need are autopsies carried out with the potential for Covid vaccine injury in mind and proper investigations of the safety signals from the adverse event reporting systems. Any signals that do appear in overall mortality – such as the unexplained rise in non-Covid deaths since summer 2021 – should also be taken seriously, given how severe they have to be in order to show up amid normal mortality and confounding factors.


To join in with the discussion please make a donation to The Daily Sceptic.
Profanity and abuse will be removed and may lead to a permanent ban.
We will never get to the real figures unfortunately.
Thanks Will and co. for your great efforts.
“What are really needed to investigate fully the safety of the vaccines are autopsies carried out with the potential for Covid vaccine injury in mind”. Exactly. There’s the obvious anecdotal evidence (e.g. athletes), but without a proper neutral-minded autopsy it’ll remain hearsay, easily ignored by the those who want to. The problem, of course, is that anyone that carries out this task, and concludes disturbing results, will have their reputations systematically trashed – already seen with the German pathologist who did exactly this.
i don’t believe we’ll ever know the truth; the elites seem to have this wrapped up neatly, no matter which way you look at it. Even if the truth was to emerge now, the robotic morons that make up the vast majority of society will just shrug their shoulders anyway as long as the BBC/Guardian tell them to.
The recent scandal of avoidable deaths in maternity units is the best example. People knew things were not right but they did not speak out for fear of jeopardising their careers. Times that by a million and that’s where we are with these jabs.
This will only happen if the pathologist is informed of the deceased covid bioweapon injection status, dates of by the coroner & coroners aren’t asking for this to be looked for at the post mortem according to a pathologist who works in England.
Whilst overall mortality is going to be difficult to find a signal in the noise, I seem to recall a graph of excess mortality in the under 20’s that showed a distinct correlation between jab rollout and increased mortality among the cohort. Because death is much rarer in younger people and assuming vaccine injury is consistent across age groups then that is where I think you will find the evidence.
Yes, I quickly worked that one out – to find excess mortality that stands out, you have to look at the younger age groups. I didn’t think Will was ‘getting there’ so I skipped the article…
Indeed, presumably mortality signals should be more easily spotted in younger age groups, especially if they could be separated out into those individuals not known to have any previous morbidities.
Perhaps a good example of what is discussed in this article is the fact that, between the start of the vaccine rollout in December 2020 and early June 2021, 5,522 people died in Scotland within 28 days of an injection. Suspicious? Of course not!
Your example of the Faroe islands is useful when I look at the remote area where I live. Population is around 20000. Before covid, number of deaths per week usually 1 to 3, with occasional weeks of 0, or 5 in winter.
During April 2020, there were 10 deaths in one week, and a series of 8s in subsequent weeks. But not covid, they were not registered as covid. By the end of 2020 only something like 4 covid deaths were registered, and even now the total is something like 6 over the two years. So either a worse than usual bug went round, or a medical edict to withdraw care was issued to take out those who maybe would have died over the next couple of months. Or it was covid, but the local authority denied there was covid in the region at the time. In fact, that really unusual peak in April 2020 has never been noticed by anyone or commented on by the authorities. It’s safely under the rug, probably with the empty vials of midazolam.
After April 2020, death rate looks like the old pattern until the start of 2021. From the start of 2021 there have been 6, 7, 8 deaths a week fairly often, the numbers do not look like the old pattern. But it’s really hard to see on a “noisy” graph. My gut feel is that the rate is 25% higher than previously.
I suspect urinary tract infections & dehydration in care homes & people ‘cared’ for in their own homes caused a disproportionate number of deaths. Carl Heneghan speaks very well about the problems in spring 2020 in care homes, they struggled with staff & the advent of PPE meant changing between each patient, fewer patient visits were made. Couple this with no relatives visiting the inpatients stopped getting badgered to drink, infections set in, the patients were also depressed due to no interaction. The whole thing was a recipe for disaster. You don’t need drugs or a virus to explain it just enforced neglect.
Even without a wholly complicit media as dictated by TRPTB bigpharma has decades of experience in duplicity and lies.
Even when data clearly shows the damage from vaccinations it is ignored.
http://vaccinepapers.org/
Excess deaths/attributable to the jabs will be buried as per usual, but if an explanation were ever required the MSM would simply be ordered to say that the excess deaths are simply from continuing “covid” as opposed to the jabs – after all it is the spike protein which does the damage, and they’ve already set the scene for that by saying covid itself causes precisely the same damage to the immune system as critics say the jab does. Just look at the ever expanding causes of death/injury from covid.
That said, experts such as GVB have said for two years that the jab is dangerous in itself for the individual and for the population as a whole because it encourages immune escape as it is non sterilising. (No dead end there Mr. Fauci ).
The science is there at a bio molecular level to prove the jabs are harmful. GVB latest papers on this.
The science is there from post-mortems which clearly shows the damage done by the jabs
to the body as a whole- Dr. Ryan Cole.
The tragedy (criminality) of this is that this science will continue to be ignored.
And, we’re still jabbing kids.
Dr. Naomi Wolf on Pfizer: “They hid. They concealed. They redacted.”
https://rumble.com/vzu39b-dr.-naomi-wolf-on-pfizer-they-hid.-they-concealed.-they-redacted..html
Bannons War Room
Stand for freedom with our Yellow Boards next events
Thursday 7th April 5.30pm to 6.30pm
Yellow Boards By the Road
The Meadows (A321) Marshall Rd
College Town
Camberley GU47 0FD
Saturday 9th April 2pm to 3pm
Yellow Boards By the Road
Loddon Bridge, A329 Reading Rd,
Winnersh (Outside Showcase)
Wokingham RG41 5HG
Stand in the Park Sundays from 10am – make friends & keep sane
Wokingham Howard Palmer Gardens
(Cockpit Path car park free on Sunday)
Sturges Rd RG40 2HD
Bracknell
South Hill Park, Rear Lawn, RG12 7PA
Telegram http://t.me/astandintheparkbracknell
Even if the figures were self evident The Powers That Be would not investigate it because they have spent decades telling us how safe “vaccines” are and it would dent the publics confidence in medical and scientific authority and kill off the cash cow that is Big Pharma.
The only way I can see “vaccine” injuries and deaths reaching the news is if high profile court cases come to light.
The family of Taylor Hawkins suing the Foo Fighters for forcing him to take the experimental jab when he didn’t want to would be a start.
It won’t happen but is an example of what needs to be done with an open minded independent pathologist after an autopsy and expensive open minded independent legal representation.
Fentons analysis showed there were signals in the non covid deaths in the unvaccinated which corresponded to the vaccine rollouts in each age groups. The trick of not classing them as vaccinated for 14 days and no investigations into vaccine deaths will account for many vaccine deaths being misclassified.
Plus when you have had a period of high excess mortality like spring 2020 and winter 2020/21 you would expect to have a period of lower mortality. You can see this in spring 21. But just because it is below average numbers of deaths doesnt mean there are not vaccine deaths hidden in there, and in effect the mortality numbers should have been lower. Then go to summer 2021 when there were above average deaths. A lot in the working age population if i recall correctly, many due directly to lockdown imo. This was a time when seasonal viruses shouldnt have been in such high circulation. Lots of vaccine deaths could be lost in that data as non covid and covid deaths, with so many people testing positive.
Just to be clear the government actually state:
”It is estimated that only 10% of serious reactions and between 2 and 4% of non-serious reactions are reported.”
https://www.gov.uk/drug-safety-update/yellow-card-please-help-to-reverse-the-decline-in-reporting-of-suspected-adverse-drug-reactions
According to the MHRA there were as of 23 March 450,567 Yellow Cards, 1,475,393 ADRs, 2,075 fatal reactions from Covid “vaccines”
https://www.gov.uk/government/publications/coronavirus-covid-19-vaccine-adverse-reactions/coronavirus-vaccine-summary-of-yellow-card-reporting
if we propose 20,000 deaths from Covid vaccines we are only holding them to their word.
Criticism of a technical point: Defining excess mortality is deviation from an average doesn’t make much sense. Due to the nature of averages, actual values will almost always differ from the average. Fluctuation of actual values are only interesting if they differ significantly from the average, eg, by more than one would expect, given the standard deviation. The standard deviation is the square root of the average of the squared deviations of individual values from the average (the point of the square-than-square root is that the eliminates the direction, ie plus/ minus, of the deviation).
This should be included in such diagrams.
“Lies, damned lies and statistics – still with us after all these years.
Everyone knows that those who provide them decide on an outcome they want to justify and select accordingly.
The “Authorities” in the UK have not provided objective and honest stats from day one!
The font size makes all of these graphs illegible. Waste of time.
Thank you Will Jones. You are a true covid warrior. Your efforts are greatly appreciated💕💕
The UK has reported about 80k covid deaths since Dec 2020 when the injections were rolled out. If there have been 20k deaths caused by those injections, that would represent a 25% increase in deaths, which is statistically significant. If covid deaths are over reported as thought, the percentage is even higher than 25%.
Since covid deaths are readily noticeable on the excess deaths graphs, we should expect vaxx deaths to be equally noticeable. They are not. The question is why not?
Actually, the better question is, Why are covid death waves so clearly visible on the excess death charts? After all, if vaxx deaths are small enough to be lost in the data, so should covid deaths get lost for the same reason. Is it possible that the excess death data has been corrupted?
Looking at excess mortality in total – figures will be lost in the general noise.
Looking at excess mortality by decade in the 30 to 60 year old cohort (where normal mortality should be low and vaccine-induced mortality appears anecdotally to be high) should give a clearer signal that something is amiss.