We’re republishing the latest analysis by James Ferguson, a financial analyst, which argues – quite convincingly – that not only is Omicron considerably milder than Delta but also less transmissible.
Almost a year ago to the day, I noted that the reasons given for closing down Christmas celebrations in the U.K. last year had owed more to a basic mathematical error than the supposed increased transmissibility and virulence of the new alpha (Medway) variant.
This year, a similar threat from omicron appears to be scaring the politicos, but this again seems more a figment of the scare-mongers’ hysteria than scientifically-grounded evidence.
The willful damage that certain so-called scientists have serially inflicted on the economy needs to be queried. However, the propaganda machine likens any healthy skepticism to flat-earth advocacy.
Consequently, this note takes a leaf out of Steven Koonin’s excellent book on the climate debate Unsettled, and only interprets the Government’s own official data.
However, as you will see below, this interpretation comes out quite differently to the Government propaganda/BBC party line. Covid, as is the way with new viruses, is mutating into both a significantly less transmissible and substantially less virulent variant.
You are only about one third as likely to catch Covid this Christmas as last and, even if you do, you are now 80% less likely to die from it. So, why isn’t this the new narrative?
Same Government data, different headlines.
A fifth wave?
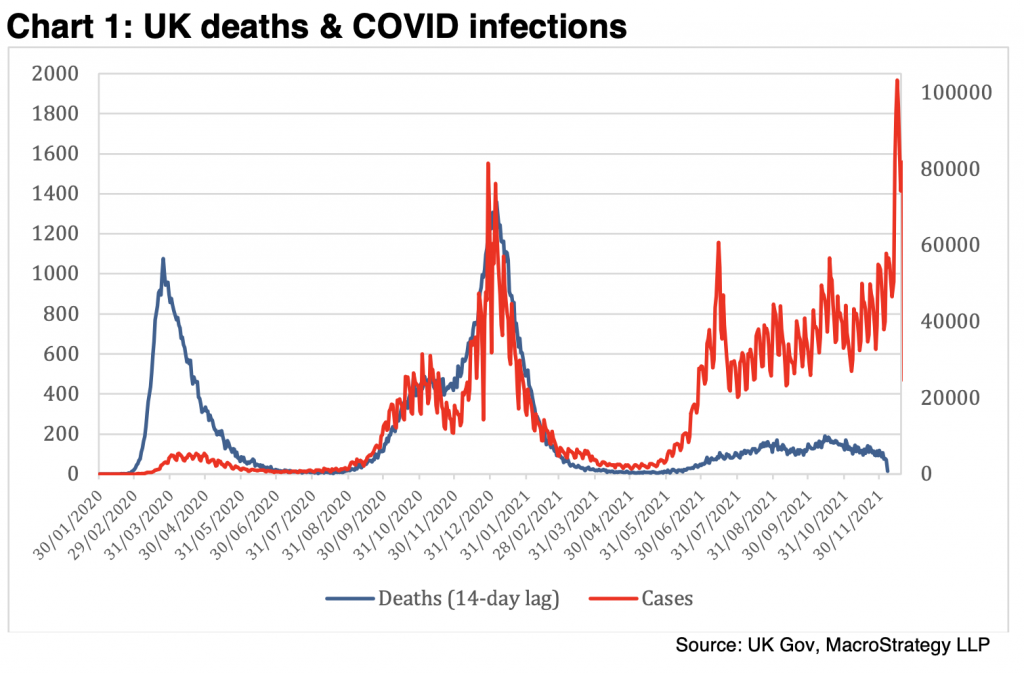
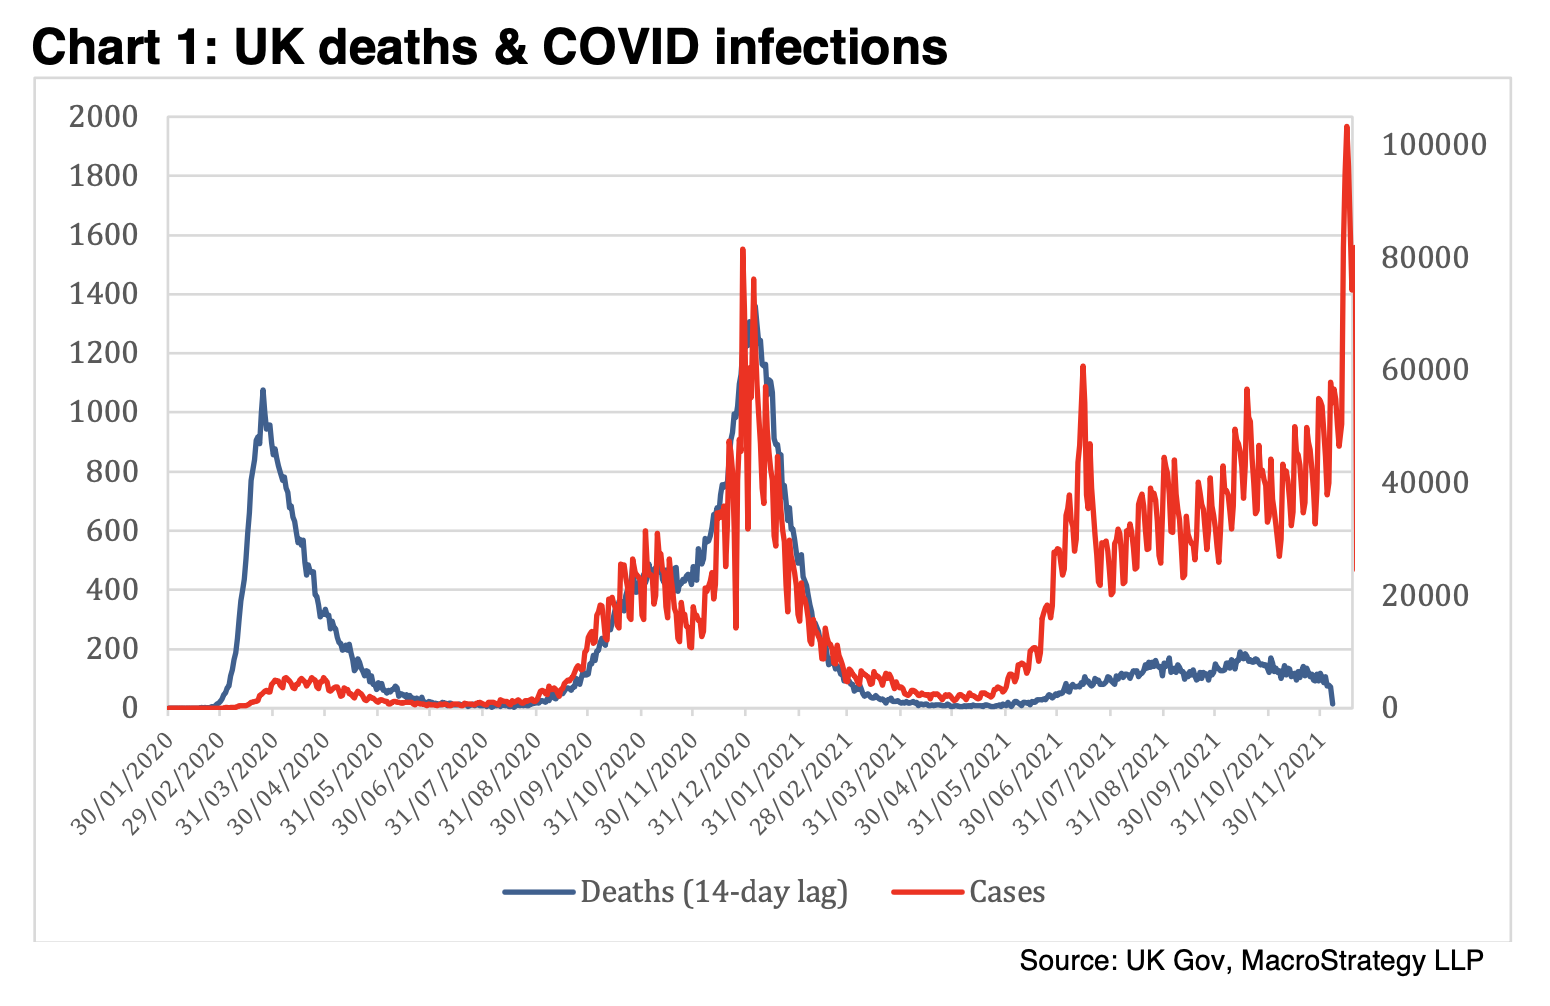
The UK is currently in the throes of its fifth Covid variant wave: Wuhan (Mar 2020), Spanish (Sep 2020), alpha (Nov 2020), delta (Jun 2021) and now omicron (Dec 2021). Cases are at a record high, despite one of the most comprehensive vaccine programmes in the world and a series of extensive non-pharmaceutical interventions (NPIs), like lockdowns and forced self-isolation. Yet behind the media hysteria, an extremely salient fact seems to have gone largely unnoticed. Whilst the number of positive tests has hit new highs (see red line on Chart 1 below), the number of deaths which used to follow just 14 days behind such ‘cases’ have fallen away, especially since omicron (blue line).
Prescription discrepancy
If this far lower death rate has been a triumph for the vaccines, they don’t seem to have done anything to prevent actual infection. If, on the other hand, the lower Covid death rate is due to better hospital treatment, including the drugs which have now (finally) been approved (the antibody drug sotrovimab and the antiviral molnupiravir), then why are emergency approval-only vaccines, which have yet to be safety- checked, still being prescribed? It’s a mystery.
Record Cases
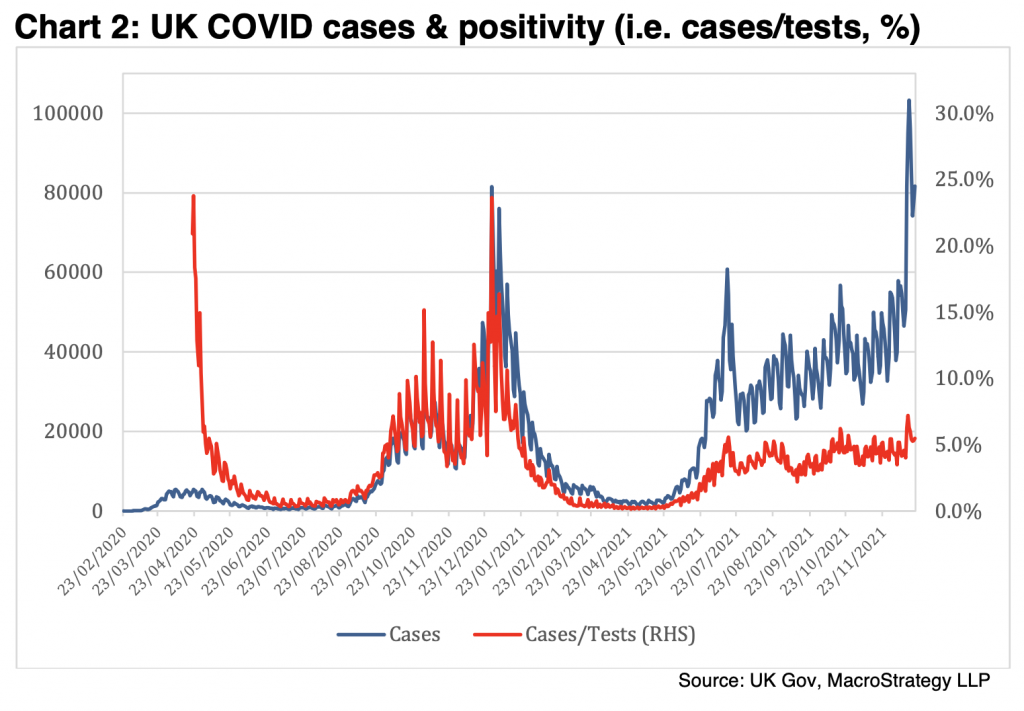
The main problem seems to be that the political narrative of the pandemic has strayed quite a distance from what even the Government’s own data is saying. Officially there are only five numbers released by H.M. Government to the press and public: tests, cases, hospitalisations, vaccinations and deaths. However, even this paltry list is barely ever analysed. For example, on Wednesday December 22nd, the BBC reported that a record 106,122 cases were reported and that “the eight highest daily case figures… have all come since December 15th.” Yet as the blue line on Chart 2 below shows, the official Government data reveal that this is lazy reportage. The number of cases by specimen date (as opposed to the date the test results were reported), had already peaked on December 15th at 103k and has declined by about 20% since then.
Positivity
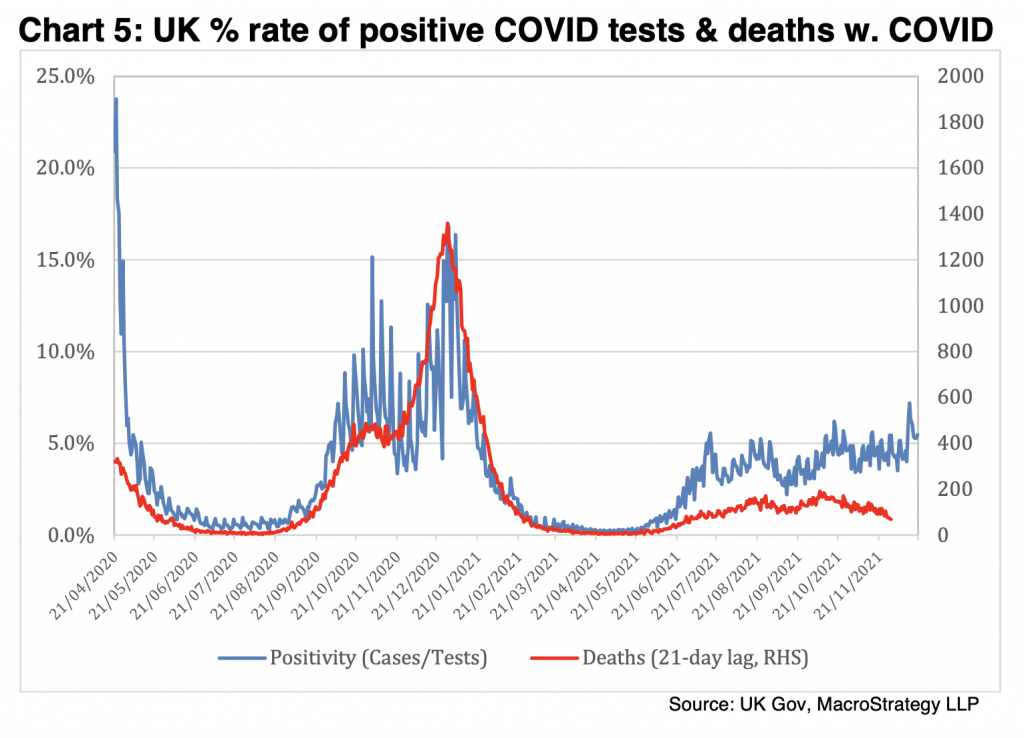
Far more relevantly, so-called ‘cases’, which remain undiagnosed by doctors and are merely positive PCR test results, are quite naturally a function of several other several factors, not just the Covid infection rate. First and foremost amongst which is the number of tests taken. It is not the number of positive cases that indicates how widespread infection is, but the proportion of those tested that are positive. This ‘positivity rate’ (positive cases as a percentage of tests administered) is of far more relevance to how widespread COVID is than the absolute number of positives; and positivity has been stable, at around 4-5%, since as far back as early July 2021 (see red line). Thus, the apparent spike in cases, that the BBC news headlines scream out, is a mere figment of the corporation’s fevered imagination.
When is a ‘positive’ not a positive?
Another important, and highly relevant, issue is the sensitivity of the polymerase chain reaction (PCR) test itself, or more importantly, the cycle threshold chosen for determining a ‘positive’ result. Conclusive positive confirmation of a positive PCR test, by successfully sequencing the virus in the lab, is uncertain above 20 cycles (1 million copies) and impossible above 30 cycles (1 billion). Since each PCR cycle doubles the number of viral copies, 30 cycles = 2 to the power of 30. The UK is still counting PCR tests as ‘positive’ for cycle thresholds “> 37”, which multiplies each of the existing viral strands by at least 270bn.
Naturally, quite a bit of viral shredding, the biological equivalent of Chinese whispers, occurs with so many doublings and the reliability of the result degrades proportionally. Even the inventor of the PCR process advised that his method never be used for diagnostics. Nevertheless, from the Government data alone, we can now tentatively conclude several things.
First, there appears to be no discernible omicron wave. The apparent ‘record’ high cases are entirely explained by the increased number of daily tests being administered (a record high 1.64m on December 15th).
Second, the vaccine, largely rolled out by end-June, doesn’t seem to have had much prophylactic efficacy since July (hence the messaging moving onto the prevention of serious illness, hospitalisation and death).
Third, the omicron variant appears no more transmissible (i.e., it has much the same positivity rate) than its predecessor, the delta variant.
Fourth, Covid, in both its delta and now omicron variants, appears to have become endemic. There have been no clearly distinct ‘waves’ in the positivity data since last summer, just a fairly continual 4-5% detectable infection rate.
Fifth, whilst the bad news is that these new variants may not be burning themselves out as fast as their predecessors, the good news is that the positivity rate is two thirds to three quarters lower now. Both delta and omicron appear less, as opposed to “more”, transmissible (despite alarmist insinuations to the contrary).
Unintended consequences
Normally, viruses select for more transmissible but less virulent variants. People walking around infected but relatively asymptomatic naturally infect far more people and spread the virus further than those bedridden with a more virulent strain. Therefore, NPIs may have prevented these more transmissible but less virulent Covid variants from becoming dominant. This begs the question: if Covid is now less (or at least no more) transmissible, is it perhaps therefore more virulent? Fortunately, the answer at this stage appears to be ‘no.’
Hospitalisation rate
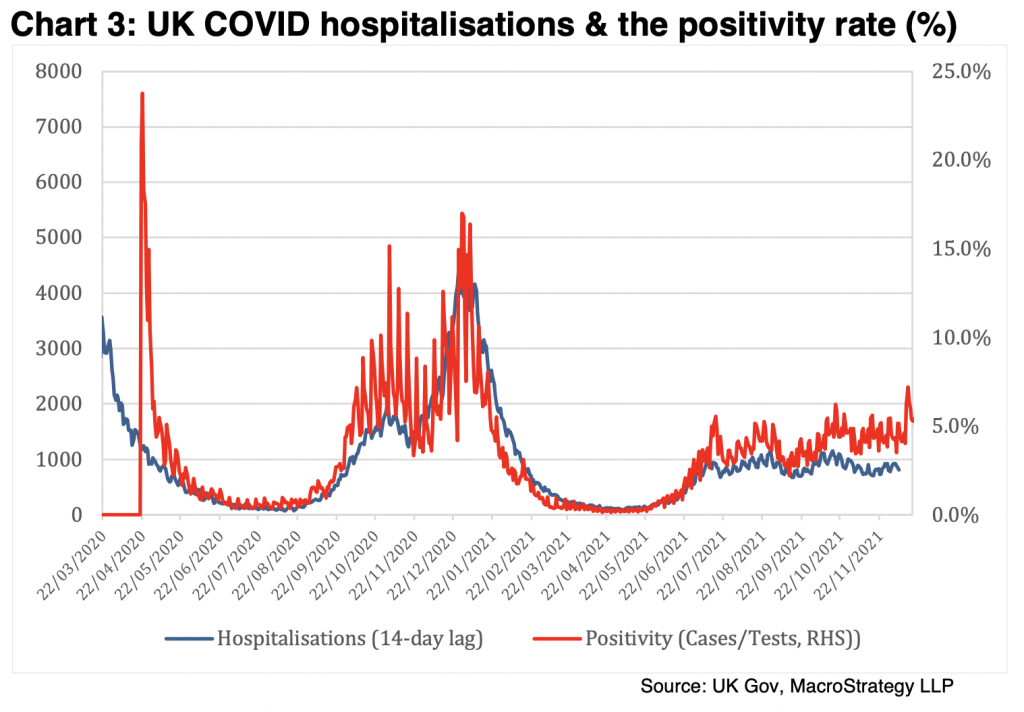
Little can be said about Wave 1 (Wuhan), because hardly anyone outside of hospital was tested, but the late summer 2020 Wave 2 (the Spanish variant), seems to have had a lower hospitalisation rate than the later alpha (Medway) variant that peaked in New Year 2021 (see red and blue lines in Chart 3 below).
Getting lucky
By inhibiting transmission of the milder variant therefore, NPIs might have been contributing to some increased COVID virulence. Yet nevertheless, since last summer’s delta variant, we appear to have got lucky. With total hospitalisations lagging increased positivity, compared to last winter’s alpha variant, delta and omicron seem, if anything, to have resulted in a smaller number of infections requiring hospitalization than delta and, in the case of omicron, only about half as many as alpha did.
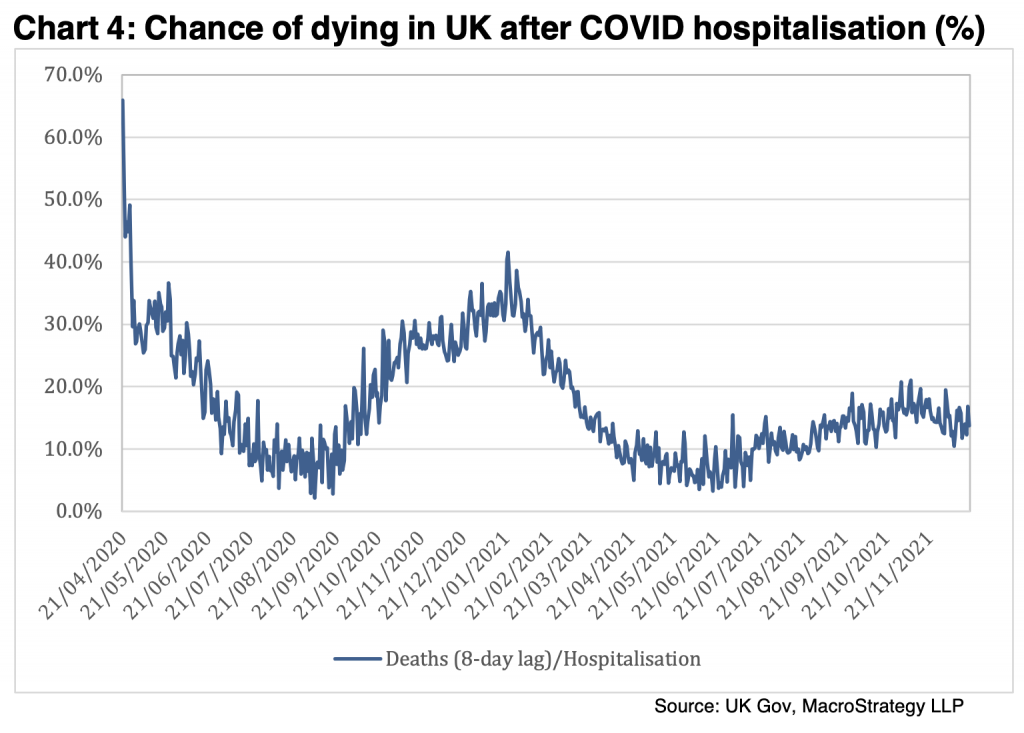
Meanwhile, Brits’ chances of dying, if seriously infected enough to require hospitalisation, have improved substantially. During the winter of 2020, deaths rose to about a third of all COVID hospitalisations. Whilst this was only half the number of hospitalised succumbing during the first wave, it still wasn’t a great advertisement for the overall quality of care. However, survival chances for those on the wards have doubled again since then, to about 15% (see Chart 4 below), and as Chart 3 above already showed, the chances of being hospitalised have also halved since a year ago.
Conclusion
Around about this time last year, over 15% of all those tested for Covid in the U.K. pinged positive, as the more transmissible and virulent alpha variant swept the land. Fast forward to this Christmas, and the tail-end of delta, along with the emergent new omicron variant, are generating a 5% positive rate (see blue line on Chart 5 below), suggesting that these newer variants are perhaps only one third as transmissible as alpha was. Whereas a 15% positive rate of infection was resulting in around 1300 deaths a day at the peak of the alpha variant, a positive rate of only about one third of that is this winter only resulting in about 75 daily deaths (less than 20% of the expected rate). Furthermore, this death rate is declining and has halved again over the last two (omicron) months. All of which means you are now 80% less likely to die of Covid this Christmas than last (red line). How’s that for Christmas cheer?


To join in with the discussion please make a donation to The Daily Sceptic.
Profanity and abuse will be removed and may lead to a permanent ban.
Why the panic? Because the world won’t just reset itself!
Probably so; I preferred to believe they were just on an ego driven treadmill and didn’t know how to get off. That has become less and less likely as the months crolled by.
Johnson Family and Gates …thick as thieves!
Yes……and Schwab and Soros get closer to the knock of the “Grim Reaper” as every day passes!
Because “Covid.” Because therm carries the connotation of a uniquely pernicious killer that does not discriminate. Because it’s as if Black Death hooked up with Andromeda Strain and spawned a love child named Ebola.
Heroneous Bosch (sp?) could not have put it better.
On a more mundane level you will recall that they spent months telling us that Covid does not discriminate when their own statistics were telling us that it did and how it did so.
Hieronymus Bosch (just FYI). 🙂
..
In an earlier DS article today UKHSA Chief Jenby Harris let slip that (in UK) The fourth dose might have to be launched early in view of the ever spreading Omnicon.
THE fourth dose, as though already planned?
I was going to mention this in that thread but got distracted for a couple of hours.
The fifth, sixth and seventh doses etc are no doubt already planned for those poor souls who haven’t succumbed to vaxx injury and are ill educated enough to believe that the “poison death shots” will have some prophylactic or therapeutic value.
There are 20 slots on the COVID vaxx pass. Go figure.
So they must have planned all ‘666’ in advance. But why plan FAILED vaccines? Unless they have another purpose.
Worthless woman…why pay any attention to her lies?
“THE fourth dose, as though already planned?”
All warned about before the first dose was even off the ice.
AIDS?
Because panicking, sayeth Welby and Johnson, and validating the panic of others, is to love your Facebook neighbours.
as thyself?
Welby? Oil trader?
The fraud pretending to be a ‘Christian’?
Why the panic?
This is what I’d like to know too.
Either the conspiracy theorists are right and there is something much more sinister going on or we are being led by hysterical morons and self-serving opportinists who are getting enormously wealthy by prolonging this misery for as long as possible.
Knowing our luck (bad), it’s quite possibly both. After all, ventriloquists’ dummies have a ventriloquist to operate them, and he who pays the man with his hand up the sinister puppet’s backside commands all.
That’s why I’m happier for bozo to remain PM, anyone else would be better at implementing their evil plans.
And, you never know, he might just try a maverick one man rebellion in a Bullingdon Boys caper to save his skin.
“That’s why I’m happier for bozo to remain PM”
Stockholm Syndrome strikes again!
It’s really not! Nobody is saying he’s great – merely that most/all of the likely alternatives are worse!
No argument – the answer is get rid if them all!
I’d say it’s more realpolitik than Stockholm Syndrome
Something very sinister is in the offing. Watch this 8 minute video and you’ll get some idea about where they want to take us. https://rumble.com/vppv0h-dr.-luis-de-benito-shares-part-of-his-report-on-the-mac-address-phenomenon-.html
Yes.. I’ve seen that before Rowan, and I agree with you, something along those lines is most definitely in the offing..
There are no “Conspiracy Theorists” – just a demonic, genocidal Globalist Conspiracy!
“Conspiracy” is now a blatant fact, not a theory!
……
Excellent article, but Toby surely by acknowledging that the government is using propaganda to deliberately manipulate the public and maintain the pandemic, you are confirming your belief in a hidden agenda? They aren’t accidentally lying through their teeth are they?!
Exactly. Wake up Toby!!!!
Too late now.
…..
Got to justify their share of the Tsunami of Covi, lockdown and now vaccine, government advertising propaganda funding.
No mention of the ‘case number’ being a product of increased testing of people who aren’t ill.
What a surprise…
There are some very devious minds working on these headlines..
Perhaps the nudge unit is writing them to save the journalists the bother?
Dear Daily Express,
Give Britain the best gift this Xmas – stop publishing your toxic, mendacious, pathetic excuse of a “newspaper”…..FOREVER! The world would definitely be a better place.
Now fuck off!
Daily Express! The perfect Cat Tray Liner!
*blinks*
It’s real……
“a similar threat from omicron appears to be scaring the politicos”
No. What’s scaring them is the Big Lie being exposed, leading to political disgrace or worse. How long does this have to go on for before you admit they are NOT LOOKING FOR A WAY TO END THIS.
The threat scaring the politicians is the Righteous Anger of the bulk of the population when they finally realise they’ve been taken for fools.
The more they have been taken in the angrier they will be so it can only get worse as the politicians only hope is to spin it out for as long as possible until . . .
My and my mates used to include a compulsive liar, he would lie even when there was no possible benefit. We asked ourselves ‘why?’
Jordan Peterson does a good take on Hitler, pointing out that chaos and destruction might have been the aim all along, rather than something he fell into at the end. There’s certainly an increasing recklessness in the lies and tyranny that is less and less rational all the time.
I’ve got that lecture on digital file.
Can’t remember the details but it reconciled how his lunatic behaviour becomes more understandable when we stop confusing his ultimate aims with his implementation of the war. As example how he (or his minions), in the face of oncoming defeat, divertet precious resources into the Final Solution rather than the front line.
It concludes, if I remember correctly, that his final War Aim was No Surrender, hence the total destruction of Germany.
Yup, that’s the one. I believe he (JP) has become something of a sceptic.
Ordo ab chao.
Australia – now saying that getting the virus is necessary in order to build immunity and ending the pandemic … the more people who get the virus (inevitable) the quicker this will end …
https://twitter.com/risemelbourne/status/1473866052433895426
As many here have been saying from late Spring 2020 onwards.
Nothing new here …see Yeadon et al 10 months ago.
If only the dumb majority could read.
Ok for the slow of learning, one more time:
It’s not. About. A virus.
I keep repeating that even on here but the same charts and graphs are still churned out.
Because prolonging the fear porn is the only way to get even the sheep to accept, nay now even demand, the desired digital ID – without which their project fails.
Victory over covid will only be declared when enough fools are jabbed.
Never forget, we have right on our side, – we wouldn’t ever use kids as human shields, we didn’t mandate lockdowns and the inevitable consequential suffering therefrom, we didn’t unleash the untold mental harms to infants and babies caused by the execrable mask diktats, etc etc.
Hold the Line.
People are beginning to realise they’ve been lied to repeatedly.
One aspect Toby has missed is last winter was a gigantic scam, where 70% of respiratory death was allocated to CCP Virus. This year after the vaccine roll out that figure is a more realistic 25%. There was mass hospital spread last Dec/Jan and Alli Pearson is reporting the same again.
All the stats have some political angle but the same problems in the NDS are as clear this year as they were last year. Also LAST years ruinous winter shutdowns were totally without need, that should always be said.
A new high of ‘cases’ again today but the number of tests conducted in Northern Island is not included although ‘cases’ are. This is two days in a row that the number of ‘cases’ has been reported but the tests have been underreported. Hence difficult to calculate positivity. I smell a rat and a big one at that!
https://coronavirus.data.gov.uk/details/whats-new/record/5027b6f4-5796-4c9c-84ba-184499cfae45
We’re also never told about the double, triple and quadruple repeat testers. The deliberately erroneous implication is that every positive is a “new infection”, when it obviously isn’t.
That’s my thinking too. I don’t think that anyone can trust the numbers, that are of course in any case seized upon by the MSM without providing any context.
Good point. I know of people who have had repeated tests, even some who test themselves several times a week.
I’ve never been tested once!
Getting there ,…still someway to go …try Googling “Genocide” by stealth injection.
Worth noting again that if it weren’t for obsessive testing, we wouldn’t be aware of anything unusual. The pandemic would have been regarded as over last year, at the latest.
Another example of how new technology, in the hands of technocrats and obsessive do-gooders, has made our lives far worse.
Last week, needing a taxi home, I got through to their call centre to be told one and a half hour wait.
Knowing this to be “computer says” I rang twice more until finally getting through to local persnel.
“Hi, this is ‘KV’, seems I can’t get home until 6pm?”
‘No problem K, there’s a car clear round the corner, I’ll send it over’.
Pulling rank you might say? No, it’s just knowing that ‘the system’ operates for it’s own benefit, not mine.
A point worth repeating: During the winter wave last year, the ratio of active COVID cases to people with COVID in hospital was below 30. As of yesterday, it has risen to 128. Weren’t it for the mass testing of healthy people, we’d be looking at the hospitalisation numbers (at worst) and would think “Well, thank God, it’s over!” (since Spring 2021).
The Drosten PCR test is not “technology”, it is a totally deliberate computer modelled fraud and cannot identify any infection of anything.
I think that the government is very frustrated that not enough people have died yet, and are getting impatient. They’re trying to hurry things along.
Not to worry, the “booster “will hurry things alongs” just fine!
Because the blob can’t let go of the power it seized over this non pandemic.
We must take it back, fight them.
Dave Spart of Watford!
NEIL: What do you mean, revolution?
RICK: Blood runs! Flags wave! Come on, everybody, throw down your tools and knock down the barricade. Come on, run into the Winter Palace. Run into the Winter Palace and stand on tables, waving bits of paper at each other! Yes! Yes!! Hello, are you the Czar?!
“Scamdemic”.
Steve Bannon – the war against the ‘unvaccinated’ is about to begin.
I think from MSM articles and Government pronouncements and pleadings over the past week it’s already well under way!
https://www.zerohedge.com/covid-19/steve-bannon-war-unvaxxd-about-commence?utm_source=&utm_medium=email&utm_campaign=369
I think you have to be very careful around people like Steve Bannon.. I feel some of them are repeating a headline they want to see happen..
Because Doris said so, obviously.
Two points:
1) I am given to understand than in non stable viruses when they “evolve/ change” they become more transmissible & less virulent or they can be passed between hosts more easily and are less likely to kill the host.
They do not as Mr Ferguson above implies become less virulent & less transmissible at the same time.
Any observed reduced transmissibility amongst the unvaxxed is as likely to be due to the huge number of unvaxxed who are immune due to previous infection & recovery.
The numbers of naturally immune are something the authorities are studiously avoiding knowing about, which is a huge big clue stick on its own.
The stats are illuminating… ONS Data…
UK Deaths (all causes)
2019 = 11 months Jan to Nov – 483,381
2020 = 11 months Jan to Nov – 552,016
2021 = 11 months Jan to Nov – 528,985
Taking into account the age-related deaths, there is really nothing out of kilter here.
Even more startling in our neck of the woods ( a city of 254,000 souls ), the figures are :
Deaths (all causes )
2019 = 11 months Jan to Nov – 2,349
2020 = 11 months Jan to Nov – 2,383
2021 = 11 months Jan to Nov – 2,392
You do the maths and ask yourself that?
And here’s the burial and cremation figure for Cornwall 2015 to 2020.. 2020 being the year when so many in the county lost there livelihoods because of the killer pandemic..
Absolutely key data – reflected across the country.
There was no “killer pandemic”.
Beware the vaccines!
Must watch 2 minute video.. listen to what she says right at the end.. so why the hell why you force people to have it unless there was another reason..
https://twitter.com/i/status/1474038884711415816
There is a God.. watch German Health Minister blackout at conference..
https://twitter.com/i/status/1474097826384781312
There needs to be an additional bit of context :
Even at its worst, this virus never caused the destruction and death that was claimed – so this latest information reduces impact to truly negligible levels.
(and no – it isn’t the vaccines – see S.A.)
I have no fear of ‘covid’, a positive test for cancer, dementia, heart disease, diabetes would be another story
If anyone want’s to see what the mRNA clot-shots actually do to a person’s immune system this 14-minute video by Dr. Nathan Thompson, Illinois, United States is a must see.
This doctor did blood tests on a patient before and after this patient received shots 1 and 2 of the “vaccines”. The results this doctor displays clearly show that the clot-shots destroyed the patient’s immune system. The shots left the patient in such a diminished state that a common cold or a bite from a common insect might possibly kill him.
Check this link if you want to see the shameless lying imbecilic types that anti-vaxxers are up against. It’s Politicfact, factcheckers that has the gall to claim that Dr. Nathan Thompson interpreted the blood test results wrongly.
If you are undecided about the “vaccines”, watch that video. It will ensure you give the clot-shots a wide berth.
2020: Covid induces fear in the general public.
2021: Covid induces fear in the lie-peddling politicians and health experts.
While the MSM condemns the use of ivermectin, the most populated state in India just declared they are officially COVID free after promoting widespread use of the safe, proven medicine. In addition to this, Ivermectin attaches to covid spikes and prevents them from binding to ACE2. Get your Ivermectin today while you still can! https://ivmpharmacy.com