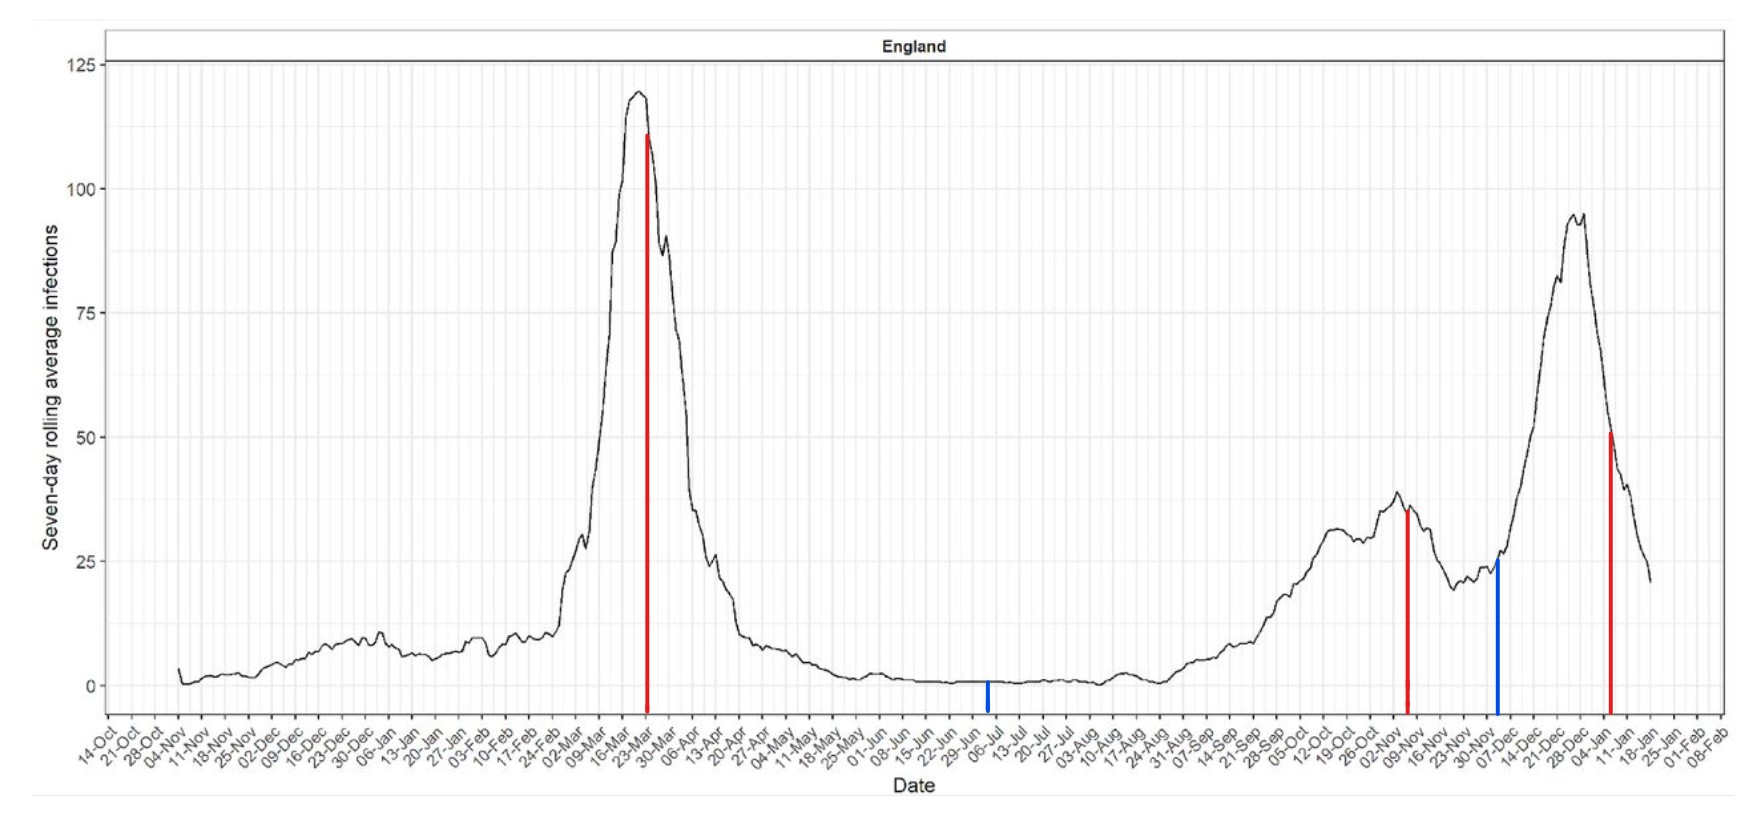
The above graph is the COVID-19 epidemic curve for England, reconstructed by Imperial College’s REACT antibody survey by asking those who tested positive in an antibody test when their symptoms began. I’ve added the start dates for lockdowns in red and the end dates in blue.
It’s a very useful graph because it does not involve any PCR tests at all, only lateral flow immunoassay tests, self-administered at home. This means it does not suffer from the problem of detecting non-infectious virus as it is not detecting virus at all but antibodies. (Its specificity is reported as 98.6%, giving it a 1.4% background false positive rate, which the researchers adjust for.) This means, for example, that the epidemic decline is much faster than in the familiar “case” curves, and the curves are more symmetrical.
What does it show? Here’s what I take from it. You might see more.
Firstly, it provides further evidence that SARS-CoV-2 was circulating at low levels in England throughout December 2019 and to some degree also in November. This fits with widespread anecdotal evidence of people falling ill with Covid symptoms in December. It doesn’t fit with the original official timeline of an outbreak beginning in Wuhan in December.
Secondly, despite circulating widely during the winter of 2019-20, SARS-CoV-2 did not undergo fast spread in England until the end of February. Indeed, the winter of 2019-20 was the least deadly on record in terms of age-adjusted mortality, despite SARS-CoV-2 being around and infecting people.
Then, around February 25th 2020, it suddenly launches into a three-week long spike of extraordinary exponential growth. This abruptly comes to an end around March 17th, and after a short plateau till around March 21st it enters just as extreme a decline. This is all ahead of the first lockdown on March 23rd of course.
The mystery is: what happened on February 25th (or thereabouts – we don’t know whether Imperial’s assumptions about the incubation period are exactly right) to cause a virus that had been circulating for at least three months at a low level suddenly to go bang and spread like wildfire? It wasn’t panic – no one was panicking at the end of February. Mobility levels were still normal until around March 12th. There was nothing unusual about the weather. Suggestions on this welcome in the comments below.
The second mystery is what caused it to stop? Not lockdown, obviously – several days too late. Social distancing? It’s a possibility, given the timing. But notice that infections also go into decline around October 19th and November 3rd, neither of which is after a lockdown (the second lockdown began on November 5th). Also, the winter surge enters steep decline around December 29th, well before the third lockdown began on January 5th. In fact, the Christmas period when people were mixing with families and experts issued dire warnings of a Christmas surge is when the infections suddenly stopped growing and began to plunge.
In every case, then, infections plateau, peak and fall before lockdowns come in, and even during times of unusually intense household interaction.
Conversely, we can also see that infections suddenly stopped falling and began rising again around November 20th, nearly two weeks before the lockdown was lifted on December 2nd. So infections fell before the lockdowns and sometimes rose during them. What’s the point of lockdown again?
One last point: this time last year infections had dropped to zero and there was no summer ripple like we’re currently experiencing. Yet it was certainly seasonality and not lockdowns causing it as there was no surge in infections during the busy “Eat Out to Help Out” summer once reopening happened in July. Presumably the Delta variant is playing a part in this, though it’s safe to say it’s highly unlikely to be as bad as SAGE is predicting.
Perhaps you have some other observations. Feel free to leave them in the comments below.
To join in with the discussion please make a donation to The Daily Sceptic.
Profanity and abuse will be removed and may lead to a permanent ban.
Excellent stuff, fascinating. Feb 25th would’ve been just after the half term school holidays, so it may have just been the effect of people bringing it back from their ski holidays in Europe
I doubt that more than a few thousand go to Italy but it could’ve been enough?
A friend of mine was Patient Zero for covid in his small town after returning from a ski trip to Italy in February 2020.
Like others I had a racking cough, temperature over 40 degrees and “a bit of pneumonia” in late October 2019 followed about 2 weeks later by blood clot and heart attack.
Sars Cov 2?
It’s an interesting article and I’m sure some of the more statistically minded will consider it more competently than I ever would.
“Like others I had a racking cough, temperature over 40 degrees and “a bit of pneumonia” in late October 2019″
I had something similar at the same time where I had a chest cold I could not shift and had to take anti-biotics for a chest bacterial infection for the first time ever.
Worst chest ever.
I just put it down to getting old.
I had this too – slightly earlier in the October. I was really ill for a whole month – was told I had ‘walking pneumonia’ – never experienced anything like it. 2 courses of antibiotics neither shifted it. I had to sleep sitting up as couldn’t get a breath lying down.(I was only 39 at the time – so didn’t put it down to old-age.) I finally got fed-up with the doc just shrugging and decided to self-medicate with out of date prednisolone that had belonged to my Dad. Got better within 3 days of taking it. Would be interested to see if I actually have antibodies.
T cells.
Worth marking up school dates and mass international travel weeks. Spring half term is around last 2 weeks of Feb, 1st week Mar – how many people took a ski trip, must number in the 10s if not 100s of thousands. In fact could well be in the 10s of thousands in each county, given the number of daily flights, loads of airports and airlines flying into France, Italy, Switzerland. This would seed schools and workplaces en masse in a short window on their return.
Schools reopened in Sept, so there would be the normal wave through the school population that slowly spreads out. December, the +ve rate of change starts after initiation of vaccine campaign. Gradient looks like another seed event. Worth looking at 1st and 2nd derivatives of the curve.
is there any way to break it down by location, to see if that offers any clues?
I am wondering if for example, it was predominantly seen in London it could potentially be tied to pollution levels, which were also known to be high in Wuhan and Bergamo regions.
I think what we are seeing is the progression of the variants. There are thousands of variants that evolve and compete. They tend to go from deadlier and not very infectious to milder and more infectious – deadlier ones put you straight in bed, milder ones you go about your business spreading it.
as a simple hypothesis
variant 1 – comes out of the lab in 2019. quite nasty. puts middle-aged people in hospital (anecdotally). doesn’t spread quickly. slow burns a bit through early 2020
variant 2 – prevalent in northern Italy. milder than variant 1. spreads quickly and only kills the very old or frail. UK gets seeded with this one 1000 times as skiers come back from Italian Alps. spreads like wildfire. herd immunity and seasonality suppresses it (and some reduced mobility). Some countries get this one too late for the winter season and we all say how well they’ve done with their response – just luck.
Imperial bases their models on death rate from variant 1 and infectiousness of variant 2. (they always looks for the most alarming data they can)
variant 3 – the Indian/delta variant – far milder than variant 2. spreads quicker. hardly kills anyone (look at Indian deaths / population). may still kill the hyper frail (what doesn’t!). This is the end-game. It spreads and immunises people against all variants (just mopping up in the UK). evolved in India and evolved to spread in hotter weather – hence our little uptick (which appears to be flattening because there’s no-one left to infect).
I expect the same happened to sars-cov-1. A mild variant evolves and spreads and immunises everyone. We just weren’t looking at it.
I think or, at least, suspect there is a lot to like in your hypothesis given over 300000 variants so far in, say, 18 months and like you I have recently caught myself wondering whatever happened to Sars Cov 1.
Thanks, I think this is a very believable explanation. So it turns out that the scariants that the government and meeja are using for domestic terrorism are actually the solution.
They never have and never prove anything, do they? They just invent and announce.
Also more virulent viruses are likely to trigger an antibody response as the innate system including T cells becomes overwhelmed. Less virulent versions are likely to be attenuated by the innate system, with few if any symptoms. This also corresponds approximately to the time the hospitals were discharging patients back into the community. Could the more virulent form be nosocomial?
There is no evidence that the variants are significant – all the stories are manufactured to make causality out of coincidence.
As you say : “There are thousands of variants that evolve and compete”. How strange that a mere handful are ‘of concern’, and as you have said, the ‘Indian’ variant could be considered safer and more effective than the vaccine, given the effect in India! The rat smell is overpowering.
Excellent ideas.
Locally we had a lot of something very like covid between october 2019 and february 2020. One family caught it after their son returned from a skiing holiday on France around december. He was worst affected, the rest of the family had very varying degrees of symptoms.
In the rest of the country not many people were dying until they started putting them on ventilators, and I suspect most of the spread then was nosocomial, especially when they started throwing elderly ill people out of hospital and back into care homes where they got no treatment for whatever they were in hospital with in the first place.
You’d almost thing they worked hard to increase deaths.
Another fascinating article from Will. I wish I could offer some useful insights, but I’m struggling.
How reliable is this data? Particularly pre February 2020? I’m not saying it’s unreliable, but when something doesn’t seem to be readily explainable it’s always worth asking that question.
How does the picture change if we break down into geographical regions? We here in the deep South West appear to have gotten away lightly with covid from March 2020 on, but there is much anecdotal evidence of a covid-like illness circulating here December-January 2019/20.
My guess is that it takes more than one factor to trigger the virus into taking off. Seasonality is probably one, but I reckon working in combination with others. By looking for only one factor, or one over-riding factor, we risk blinding ourselves to other possibilities.
I wonder if population susceptibility varies with time? Perhaps during one surge of the virus a proportion of people in good general health (good nutrition, good sleep, vit. D, non-stressed, etc.) come into repeated contact with small amounts of the virus and develop a temporary immunity. But when the surge dies away they lose that immunity, allowing the virus to come back later?
Is there something within the virus itself which tells itself not to push infections too far, but let things die down a bit so it can have another surge later, perhaps when it’s mutated a bit thus enabling it to push new boundaries? Does the virus have an internal clock?
Does it work in combination with other viruses?
My guess is someone will eventually crack this, one day, but only after looking at similar curves from throughout the world, and asking the obvious and sometimes stupid questions. Sometimes you get answers to questions like this when you’re not really looking for them – and only when you’ve lost all your previous preconceptions.
Better make another cup of tea and get the children up.
Ah now there’s a thought. The dominant virus theory: perhaps there was another virus circulating from Oct 2019 until Feb 2020 – a rhinovirus for example – that kept the coronavirus in check. Then it fizzled out and the ‘rona took over.
Anecdotal evidence that I have collated appears to show CoViD19 type symptoms in autumn 2019. For example I had a 6 week dry cough plus change in taste in November 2019, multiple patients that I saw had persistent cough around the same time. My GP colleagues noted the same. What has become apparent that across England there were significant admissions for respiratory conditions that started in September 2019 and peaked around January, with smaller peak in autumn 2020. Corona viruses typically arise in late August lasting until January. Finally the “common cold” ca be due to a rhinovirus but also corona viruses.
I had a 6 week dry cough plus change in taste in November 2019
I recall that, even before this, there were ‘cold’ viruses circulating that concluded with a dry cough that was very unusual in its persistence – lasting about a 3 weeks to a month after other symptoms had ceased.
Do you know if it would be possible now to go back and get a definitive answer on whether that was covid? For example by blood tests for t-cells? Or testing for antibodies in donated blood?
Mrs TJN and I reckon we had SARS-COV-2/covid in late December 2019 – the classic symptoms. Mrs TJN is convinced; I’m 70/30 that it was covid. But presumably it would be possible to check if we have t-cells or other markers?
i had an antibody test in April or May, which was negative. However, I wouldn’t have expected a positive result for a couple of reasons:
A) my symptoms, although annoying, were not particularly serious and hence it possibly didn’t trigger an antibody response.
B) I did have an antibody response but they are relatively short lived about 90 days, therefore my test was too late.
Yes, that’s my understanding with the antibody tests. But aren’t t-cells longer last and thus detectable for much longer?
Surely it shouldn’t be beyond the wit of science to find out if SARS-COV-2 was indeed circulating widely in the UK in autumn 2019?
But it’s as if no one in the public health establishment wants to know the answer.
There was a report on the BBC website in August 2020 about a welsh company developing a T-cell test for SARS-CoV-2, but the company’s website makes no mention of it. The FDA in the USA have given emergency use authorisation for a T-cell test from adaptive biotechnologies in conjunction with Microsoft.
Isn’t there a t-cell test for SARS-COV-1? If so, presumably it should be possible to get one for its younger sibling.
Bit what’s striking is how the public health establishment apparently don’t want to know if COV-2 was here in late 2019 – perhaps because it would mean a lot more people are immune than they like to suppose, and perhaps because it would invalidate the models they were using in March 2020
Quite. They don’t want any observations that conflict with the dogma.
Presumably it could be a benign virus, which doesn’t make us ill, and which thus we might not notice unless specifically looking for it.
“My guess is that it takes more than one factor to trigger the virus into taking off”
It’s not a guess – it’s a certainty that has been known for over a year.
I didn’t know that was accepted as ‘the science’ now. Has anyone proposed what the factors are?
‘The Science’ ????
It’s certainly been around for a long time, and was explored by ??? ( Name currently escapes me – Nobel Prize winner mathematician) who was interviewed on Unherd. One thing he noted was the relative insignificance of NPIs.
But – think it through and it’s very unlikely that single variables are responsible for complex phenomena such as viral infection and incidence, even though the precise factors and weightings are hard to pin down.
‘The Science’ ????
I know … I use that in the pejorative sense, in that we can’t depend on anything it says.
Yes, of course, it’s almost unfeasible that only one factor is involved, which leaves what is happening very hard to pin down, and which makes it very hard even to rule anything out.
There seems to have been an effect of Chinese workers returning early Feb. 2020 to Italy from Chinese New Year holidays (start 25 Jan 2020 for a week or so) with their families in China.
From there, ski resorts etc sequences discussed here:
‘A cascade of causes that led to the COVID-19 tragedy in Italy and in other European Union countries’ Journal of Global Health June 2020
There is also anecdotal evidence of severe Influenza Like Illnesses in North East England from Oct 2019 onwards with Chinese students returning from China to, for example, Leeds University, for the term start date of 30 Sept 2019.
https://www.yorkshireeveningpost.co.uk/education/50-children-sick-after-flu-virus-outbreak-leeds-school-1324904
An earlier outbreak in 2019 might explain why there is a fair bit of immunity about, not just here but particularly in Taiwan, Hong Kong, Japan etc.
In any case, the whole emotional manipulation etc by the NHS has been going on for some time. Covid 19 simply gave the public sector licence to go into behavioural manipulation overdrive, helped by a spineless, ‘totally fecking hopeless’ government:
https://www.youtube.com/watch?v=22nIySFKHLk
Don’t forget that there are a significant number of Chinese students in our university towns. There’s a suspicion that a group of student facing staff in my local university library had the virus in January 2020.
Remember also Chinese pupils flying back into English private schools after Christmas and half term holidays. Not huge numbers, but seeding.
I have an acquaintance who got what was probably Covid lateNov or early Dec, he thought from someone from Singapore, who passed it to others in December.
It may have started among the relatively young, fit, upper middle classes. That’s how it looks in London. It maybe took a while to move in quantity to the susceptible, which is when it was noticed.
It was brought back from the Apline ski-slopes in Italy in February half term – that happens to coincide with Chinese New Year – which is why it spread amongst the “chattering classes” first.
That got into media and politics and caused the panic.
If it had been poor single mums in Middlesborough that were dropping like flies first, then nobody would have noticed and nobody would have cared.
Yes, like Aids. Aids, or at least the fashionable fear of it, hit the chattering classes hard, particularly vocal people like actor luvvies. Hence the hysteria. It died down when it became obvious that the enormous majority of the population were not in danger.
The hysteria hasn’t died down this time because of the colossal efforts being made to obscure the obvious fact that, statistically, hardly anybody has sadlidied of covvie. Aids was never the sole item of government business, and nobody thought the country, nay the world, should be ground into the dust because if it.
This is exactly what happened to a friend of mine. Together with her daughter’s family, she went to a ski resort on the Austrian/ Italian border at this time. All tourists were ‘evacuated ‘ in the middle of the night. All the adults in her family returned with the bug. My friend, in her late 60’s and otherwise fit, ended up very sick, almost to death, in the local hospital.
This has my vote for one of the most fascinating articles to appear on LS.
What causes it to stop is the easier question. As Prof. Michael Levitt explained long ago, epidemics follow a Gompertz curve. Even at the start, as infections increase, the number of susceptible individuals reduces, and the sub-exponential increase is always declining as herd immunity becomes closer. There are smaller secondary waves or ripples when the virus reaches localities that saw relatively little infection in the first wave, and seasonality would have played a part in September.
It is clear that NPIs such as lockdowns, ‘social’ distancing and handwashing had negligible effect.
The December/January wave is linked to introduction of the experimental gene therapy shot in vulnerable, elderly people.
As for the late February explosion in infections, I suggest there were essentially two variants at this time. The typical, natural, mild flu – to be dubbed “Covid-19” – that was already circulating in November and December 2019. And the gain-of-function Covid-19 version 2.0, created at Fort Detrick or maybe the Israel Institute for Biological research (which is about ten miles from where lots of dead bats were discovered in March 2020).
The version 2.0 was created to be more infectious rather than more lethal, and released in Wuhan and Lombardy. The motive for releasing in Wuhan was to allow the gatekeeper “leaked from Wuhan Institute of Virology” story to take over if the “wet market” narrative began coming apart at the seams, and also served to pin the blame on China. Holidaymakers returning from Italy in late February would have helped to bring the version 2.0 into Britain.
Initially, mild and asymptomatic cases were not counted, to make the CFR look like ~1.0% (as in Ferguson’s models) rather than ~0.1%. And once people had been indoctrinated with the concept of Covid being a particularly ‘lethal’ disease, the fraud about deaths with Covid = deaths ‘from’ Covid could be performed. And this provided the perps with justification for lockdowns, face masks – and the injection of toxic spike proteins into members of the BBC watching public who exhibit little intellectual curiosity regarding the world around them.
“It is clear that NPIs such as lockdowns, ‘social’ distancing and handwashing had negligible effect.”
I think they may have had a significant effect – but in the opposite direction, by extending the impact of the virus and harming population immunity.
Meanwhile, back in the real world, while the muppets obsess about the last viral ‘war’, you know, the one that finished May 2020, here’s a taste, attached, of what lies in store this winter: another ‘wave’ like every other winter in living memory.
https://healthy-skeptic.com/2021/06/19/where-have-all-the-coronaviruses-gone/
I haven’t yet seen an explanation why the Delta/Indian variant has behaved the way it has in India. Rapid rise then rapid fall in cases. Around 300 million vaccinated out of 1.3 billion, so not vaccinations. Graph from Our world in data.
“I haven’t yet seen an explanation why the Delta/Indian variant has behaved the way it has in India. Rapid rise then rapid fall in cases.”
this is just what high infectious viruses do. run wild then run out of hosts
I don’t know if this could account for the entire peak and then steady drop but anecdotally, I believe India was widely using Ivermectin during last year but I’ve heard it said that there was great pressure exerted to cease it’s use in the run up to vaccination roll-out. It would seem that many regions saw a rapid reduction in cases when they resumed using it.
The combination of travel related to Chinese New Year and school holidays is a plausible explanation for why it erupted in Feb/March in Western Europe. Central and Eastern Europe was far less impacted but Covid in Spring 20, because of less contact with China? and differing school holiday practices?
But epidemics have many dynamics, most of which are not well understood. It is perhaps equally or more plausible, that just as with a normal flu, once the bug was in circulation, a surge in infections was inevitable, its timing simply dependent on when the virtual statistical certainty of several concurrent “superspreader” events would occur to ignite the infection wave. If this is so, then worrying about the precise ignitor of the infection wave is like worrying about which match lit the barbeque.
The infection surge is approximately 8 weeks start to finish. Feb 25-Apr20, Sep 21-Nov 16/23, 23- Jan 18.This is apparently typical for flu type epidemics, if so, it doesn’t really need any further explanation.
I believe February is when I got covid like many of my colleagues in the nhs. At the time I remember telling my boss the flu vaccine hadn’t worked but he pointed out the vaccine doesn’t work against all variants and my symptoms would have been worse. My symptoms were a cough and a bit under the weather, which persisted for around 10 days. I am a non smoker and don’t usually suffer from coughs,being more of a sneezer so I am sure it wasn’t flu.
The other thing I’d like to say using data from my city is the waves seem to rise for five weeks then plateau for a few days before declining. So last week I said to my wife infections will peak this week but then I saw the news that the government was ramping up vaccination. Knowing how this leads to infections rising I said to my wife on Monday infections will continue to rise for another 10 days peak and then decline. This will bring us into July when the government will declare how successful they were at defeating covid, not that they’ve ruined society and burden our children with massive debts. Lastly just like the flu vaccine the covid vaccine won’t stop you getting covid but may help if your elderly and in bad health.
“[vaccines] may help if your elderly and in bad health.”
… and may do just the opposite. Which is why one should refuse to support this travesty of a testing framework in support of proper science! An adequate framework reduces the uncertainty of ‘may’. This has no such safeguard – haphazard as-you-go observational data is not enough.
I’ve come to the conclusion that good quality data doesn’t matter. The alternative views of eminent scientists, medics and data analysts whether on paper or on air doesn’t matter. Real life data doesn’t matter. This ongoing campaign of control, fear and medical mafia type behaviour will only stop when we, the sensible British public, say so. Unfortunately I don’t think that will happen anytime soon.
Beyond broadly confirming seasonality, this graph merely highlights how little we understand the behaviour of seasonal respiratory viruses.
This should not be a surprise and we should not expect to be able to explain the movements of covid, because the hard reality is that we do not fully understand how other seasonal respiratories, in particular flu, behave, and we’ve been studying that disease for centuries. That puts the idiocy of taking costly and extreme panic action in response to supposed predictions by supposed experts in its correct perspective.
Consider this article from Virology Journal in 2008:
On the epidemiology of influenza
Consider the complexity and breadth of the issues they apply to understanding the behaviour of influenza, and contemplate their conclusion:
“Hence, we propose this modification of Hope-Simpson’s theory. We do not expect our revisions to prove invincible, nor do we delude ourselves that influenza is now comprehensible. Rather, we build on Hope-Simpson’s theory so that it “may be corroborated, corrected, or disproved.” (Hope-Simpson, 1992, p. 191)”
Now think about trying to explain the epidemiology of a new virus where there are complex and unknown levels of immunity from exposure to preexisting coronaviruses in circulation, on top of all the other issues.
Really enjoyed the link about Hope Simpson theory and vitamin D my mother came from Gibraltar so I’ve got olive skin. My mother about fifty years ago suffered from cracked skin on her feet which was treated with vitamin D supplements. She never seemed to suffer from respiratory illness and apart from smoking she was always fit and healthy. I got this cracked skin problem which I treated with steroid and Vaseline and later on with Halibut fish oil which contains vitamin A and D. Since then I’ve had the usual respiratory infections every year but never thought it had anything to do with vitamin D. Since covid I’ve taken vitamin D and get out in the sun as much as possible and never felt better. I also believe vitamin D as many other health benefits with 25 ug being the optimum amount taken,again depending on skin colour and Sun exposure may vary this amount.
Yes, I think the idea that vit D plays a very important role is pretty sound.
Pharma companies and their shills don’t seem to like it for some reason….
I eventually managed to get a vitamin D test on the NHS a few years back. The results took ages to return and it came back at 95, ie. pretty high. That was largely from going out in the sun, and probably fish.
Last year during the lockdown I had a secret walk up a hill to sit on a big rock and catch rays.
This year the weather’s not been so good and I am taking supplements – D3 in oil based capsules, to be on the safe side. It’s essentially a hormone rather than a vitamin and takes part in many processes. Probably a good idea to also take K2 (or lots of cheese) and avoid statins.
My immune system suddenly sprang into life 16 years ago when I switched to a low carb high fat/paleo/keto diet. Lots of meat, poultry, game, fish and a wide range of vegetables including a lot of local and seasonal stuff and avoiding wheat and industrially produced omega 6 seed oils, Also grass-fed butter and cheese and coconut and olive oil. The exact opposite of what most dieticians tell you to eat. Probably because it works and they don’t like that..
I think I had covid at Christmas 2019, and there seems to be more and more evidence like this that it was going around at that time.
I had a very nasty dry debilitating cough that lasted for two weeks, and months later I was still feeling the effects with occasional coughing, and generally feeling ‘off’. I remember at the time thinking this was a really unusual cold, and I’d had experienced nothing quite like it before. I almost went to the doctors as it wasn’t clearing up, but didn’t bother in the end (even before covid it was tricky getting a timely appointment).
Bear in mind that though I’m in my early 50’s I’m pretty fit (I do a lot of running) so it’s unusual for a bug to knock me for six like that.
I do wonder if the flu vaccine I had a few weeks before might have made me more susceptible though.
Thanks Will for a very interesting article. But having checked also the article describing the React study for the first wave there are some lingering questions. In this second article they seem to have grouped together the two articles with the amazing graph above for the whole pandemic. The big study started in June 2020 but how reliable are the self-reported symptoms date from before March 2020? There is a considerable time lapse between the study and claiming symptoms going back a half year. This does not detract the plausibility of many infections pre detection of the pandemic but more doubts that you could quantify it like they have done in the graph.
Is there a similar dataset for Sweden? Seems to me comparing the trends would potentially shed some light on some of the issues around npis.
Flew back from Cyprus at the end of Feb 20. Gradually felt more more ache on the drive from Gatwick up to North Yorkshire. Could not even drink a coffee at halfway point. Then had two weeks of (almost continues) diarrhoea that no amount of Imodium could stop entirely. Never had this before or since. [understand this is now a Covid 19 symptom]
Name something that is not a ‘Covid symptom’
Measles rash
A couple of points :
Certainly, the lockdown dates fit with the diagnosis of lockdowns as purely reactive political theatre.
?
What I said. The rise in mortality is coincident with the introduction of vaccines, and a surge in the vulnerable being affected.
Rick,
One problem I have with the vaccines mostly causing the second winter 20/21 peak is the regional data. In total, for the UK, sure, it looks like high correlation. But if you look at the regional data (excess mortality being the only honest proxy), then Yorks & Humber (for example) only shows the smallest of blips during the second winter surge. On the other hand, London and the south east show very material peaks as part of that second surge.
But the vaccination program took off fairly evenly across the regions. Hence, I can’t see vaccines being the answer for the (national) second peak. At least not materially, I’m happy (simply on all the evidence) to accept that it caused some level of death but not the heavy lifting of the second winter spike.
London and the south east missed the 1st winter surge almost completely. Hence, maybe the first and second surges were really just all one surge, but running later in the south than in the north. The north and south are sometimes quite different climatically? I don’t know (obviously), it’s just a thought?
The rises in infection according to the graph above were in October and in December, both surely before any significant numbers of vaccinations were around?
When was the flu vaccine rolled out? That may be a factor, if your immune system is busy making antibodies for flu strains which you might not get, it won’t be dealing with infections you already have or might get, such as covid.
Not sure they did much flu vaccination last year did they?
My family are convinced we had it over Christmas / New Year 2019-20. We live in a place which gets lots of tourists & we had plenty of Chinese and Italian ones up to the end of Jan 20.
The one thing I’ve never understood is how we & other people could have the virus, prior to when it ‘took off’ in the Feb / Mar 2020, but this article goes some way to explaining that puzzle. Thank you Will for addressing it.
Anecdotally, having spoken to other people since the winter of 19/20, we are not the only ones, believing we had the virus then.
Thanks Will.
So, they did several antibody testing campaigns after spring 2020, and made the curve based on the onset of symptoms of those who tested positive.
According to the graph, it was about 10x less in the winter 2019/20 than during the very peak of 2020. But if sars-cov-2 is responsible for excess deaths, it should have shown as a smaller (but significant) broader peak of excess deaths in Q4, 2019 and winter of 2019/20 in Europe and UK, but, it was one of the mildest winters in terms of excess deaths.
But more importantly during Q4, 2019 and winter 2019/20 there was no explosion of the virus spread, exponential growth, or anything like that.
All the lockdown response was based on this idea of virus spreading like wildfire as soon as it arrives (just one person could be a spark).
And it also puts another argument against modeling since modeling was based on this idea that as soon as the virus arrives, it starts its exponential growth, and they took the start date of virus arrival much later than Q4, 2019 – winter 2019/20. The virus just apparently lingered at a more-or-less constant levels for months before (more about this later).
Getting back to the graph, I guess the covidmania point of view would say that the people were wrong that they had symptoms in winter 2019/20 or that it was something else than c19, but then the same argument of human subjectivity can be used other way around. People were panicked about c19 with fearmongering all the time. So, the majority of people reported symptoms in spring 2020 when they think they should have had them (and btw, it could have also been something else than c19).
In any case, important point with antibody studies is that a lot of people have a very mild c19 illness, develop very little antibodies that fade soon or don’t make them at all. Doesn’t mean they are not immune, there are long-lived memory B and T cells (biology 101: https://www.britannica.com/science/lymphocyte). But it means that antibody studies miss a lot of people who already had it: https://medicalxpress.com/news/2020-11-covid-antibody-surveys-underestimate-infections.html.
If they were doing their React study of checking for antibodies in summer 2020 and later, then they would have missed a lot of people who had mild form of c19 in Q4, 2019 and winter 2019/20. So the low levels in Nov-Dec, 2019, Jan-Feb 2020 on the graph might be misleading and in reality levels might be much larger in this period. And still, very mild winter 2019/20 in terms of excess deaths, meaning c19 is almost nothing.
The patients I saw were young (for the NHS this is anyone under 65), in their 40’s and 50’s. Symptoms seem to be worse in those with diabetes or asthma. Don’t forget that the median age of death from/with CoViD19 was 82.
My hypothesis, for what it’s worth, is
the virus was present in hospitals in early 2020, in a relatively benign form. Between mid March and mid April several thousand older people, who were considered medically fit, were discharged back into care homes, some with DNAR. If a cohort of these patients were discharged into the same home and lockdown happens then one variant of the virus will predominate as they’re known to do in closed environments, this could be a more virulent variant. If they became ill then ambulances were sometimes refusing to take them to hospital due to the DNAR. See Malcolm Kendrick blog for details.
Yes, but possible if Covid entered mainly among the young and fit.
it also puts another argument against modeling since modeling was based on this idea that as soon as the virus arrives, it starts its exponential growth, and they took the start date of virus arrival much later than Q4, 2019 – winter 2019/20. The virus just apparently lingered at a more-or-less constant levels for months before
As I recall when, March-April 2020, I played around with the figures and equations in a simple excel spreadsheet, there is indeed a long tail from the seed infection(s) to the point where that massive steep spike appears. I’d have to check my figures, but I recall it being a couple of months or more.
(I’m not saying this is definitive – I was only messing around in excel.)
Taking UK as an example, they were trying to explain sudden rise in deaths in March, 2020 assuming first infectious people appeared sometime around February, 2020, maybe Jan 2020, but definetly not before. The first official case in UK known at the time was at the end of Feb, 2020.
The above graph shows it was present since Nov, 2019. But it stops there, it could have been present earlier. Studies in other countries point to Sepetember, 2019 or maybe even before.
In any case, taking their assumption of 2 months from seeding to noticable nad large growth of deaths, then we should have seen large rise in deaths in Dec, 2019 – Jan, 2020 in UK, or earlier.
When were hospital patients moved in large numbers from hospital to care homes many of whom weren’t tested?
Yes. See my recent reply to Milos.
Also note that children could have been infected in autumn 2019, but it would have been written off as a nasty viral infection (which of course it was). This would also explain why children appeared not be affected in March/April/May 2020.
Of course the big question is what are the ramifications if this virus predates by a significant time the declaration of a pandemic and the response to it? 18 months of unnecessary measures, lockdown, isolation, mental ill health, children missing school, an unnecessary vaccine programme.
The political fallout should be massive, but it’ll be put down as another conspiracy theory from covidiots.
Thread – A list of Sars-Cov-2 detection timeline:
1. March 2019 Spain
2. Sept 2019 Italy
3. Nov 2019 Brazil
4. Dec 2019 France
5. Nov 2019 England
6. Dec 2019 U.S.A
https://mobile.twitter.com/JavRoJav/status/1335555824215879680
What is the standardised testing graph? – This may help understand the waves in the above graph.
The issue with the REACT study is that it is using IgG as a proxy for infection, which is all well and good if the infection is sufficient to trigger an IgG response. The period of the first peak is actually reflected in a rise and small peak in the excess deaths data for England as shown in the attached graph. This pales into insignificance compared with the massive peak a few weeks later, but there is a definite change that appears to correspond to the IgG rise in the REACT study. Could this have been a particular virulent but relatively short lived variant? Or could it have been the same variant that produced the massive spike in excess deaths which could have been due to the discharge of infected but untested patients?
Does the delay in the excess deaths data reflect, in part at least, the typical three weeks (longer?) or so gap between infection and death?
Could be, but I was looking at the first foray into positive excess deaths, which coincides with the antibody peak, if there’s a peak in antibodies then that would suggest a more serious illness, possibly in younger people.
The large peak could be due to a number of factors not associated with the antibody testing.
The real problem is that ‘we’ attempt to identify cause and effect from the data from the REACT study, which is not available to the general public because of governance issues (according to their website). The people likely to be recruited for REACT are unlikely to be the elderly in care homes! Also the excess deaths aren’t all covid related, but due to the reluctance of people to attend the ED because of fear of becoming infected and instead succumbing to stroke or cardiorespiratory issues.
Yes, much of the data we are trying to use is quicksand. A plot of ICU admissions for viral respiratory ailments, September 2019 to date, would be interesting – the ICU data probably being the most reliable we are likely to get concerning the prevalence of covid.
Of course, because it’s mainly vulnerable (i.e. older) people who end up in ICU, it wouldn’t allow for differing demographic infection rates – but is there any reason why different age groups should have greatly different infection rates at different times? (Vaccine roll-out aside of course, but that’s a different story.)
I believe that this data is indicates that this pattern of infection supports the Robert Edgar Hope Simpson hypothesis for seaonal flu transmission. An intial infection phase and then a seasonal rapid viral triggering. This is also supported by the ONS regional excess death data where deaths for all 10 regions for England and Wales start at week 12, peak at week 16 and tail of in the same manner indicating triggering within four days of one another. This would explain the useless nature of lockdowns, track and trace and many other pheomena seen in this pandemic. If anyone wants more supporting data please email me: steveandrews@talktalk.net
Around 12th February 2020, thousands of kids and adults from all over the UK decended on Bormio in the Italian Alps for the English Alpine Championships. Bars and restaurants were packed and lots of mixing going on.
My son had a serious accident in a race and ended up in Sondalo Hospital. Over the course of those 2 weeks he wasn’t the only one.
The Hospital was in chaos. Not with ski related injuries but ambulances lined up bringing in most elderly people with breathing difficulties.
At that time the main hotspots were said to be around 100 miles further south. Looking back in our return it is clear Covid was much more prevent in that area than was being reported.
It is my view that many Brits returning from the Italian Alps were bringing Covid back with them.
It’s all explained in Hope Simpson’s book on Influenza…except the mechanism that triggers the virus which is described as extra terrestrial on account of its dependence on the seasons.