Throughout the pandemic, commentators have relied on ‘COVID-19 deaths per million people’ as a measure of the disease’s lethality. While this is not unreasonable for making comparisons within Europe, it is less justifiable for other parts of the world, where there has been substantial underreporting of COVID-19 deaths.
A better measure to use is excess mortality, i.e., the number of deaths in excess of what you’d expect based on previous years. This measure does not vary with factors like testing infrastructure or the criteria for assigning cause of death. (Though the best measure is age-adjusted excess mortality.)
In an unpublished study, the researchers Ariel Karlinsky and Dmitry Kobak have compiled all the available data on excess mortality. Their database – which they’ve termed the ‘World Mortality Dataset’ – allows us to make more meaningful comparisons across countries.
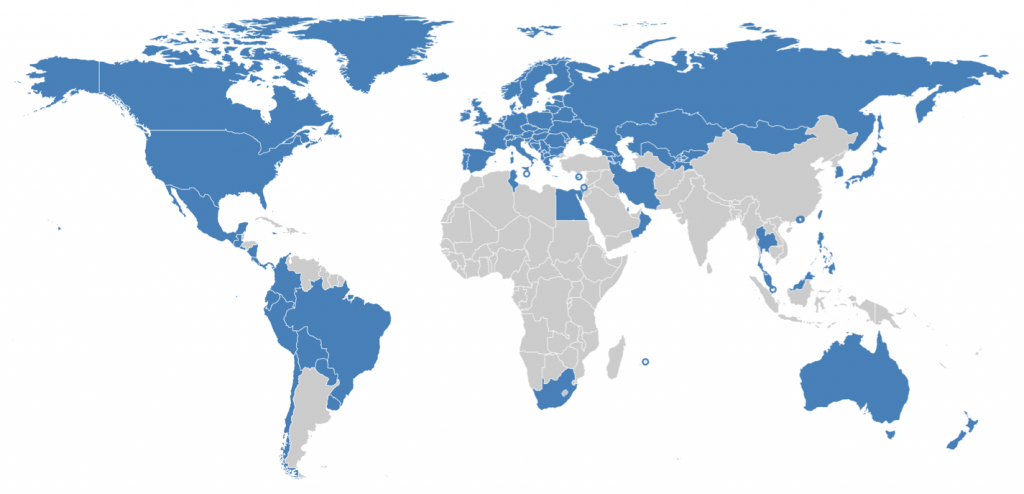
Unfortunately, data are not yet available for most of the countries in Sub-Saharan Africa, Asia and the Middle East. However, the database does encompass Europe, much of Central Asia and the Americas, and parts of East Asia. Countries with available data are shown in blue in the map below:

Note that Karlinsky and Kobak did not take the usual approach of using the average of the last five years as the baseline. Rather, they took the superior approach of using a linear trend over the last five years. If deaths have been increasing year-on-year, their approach will yield a higher baseline, compared to using the five-year average. (See here for a visual explanation.)
The authors’ results are shown in the chart below. Note that red shading corresponds to excess mortality in 2020; purple shading corresponds to excess mortality in 2021; and the % value in the lower right-hand corner of each plot is the percentage excess mortality.

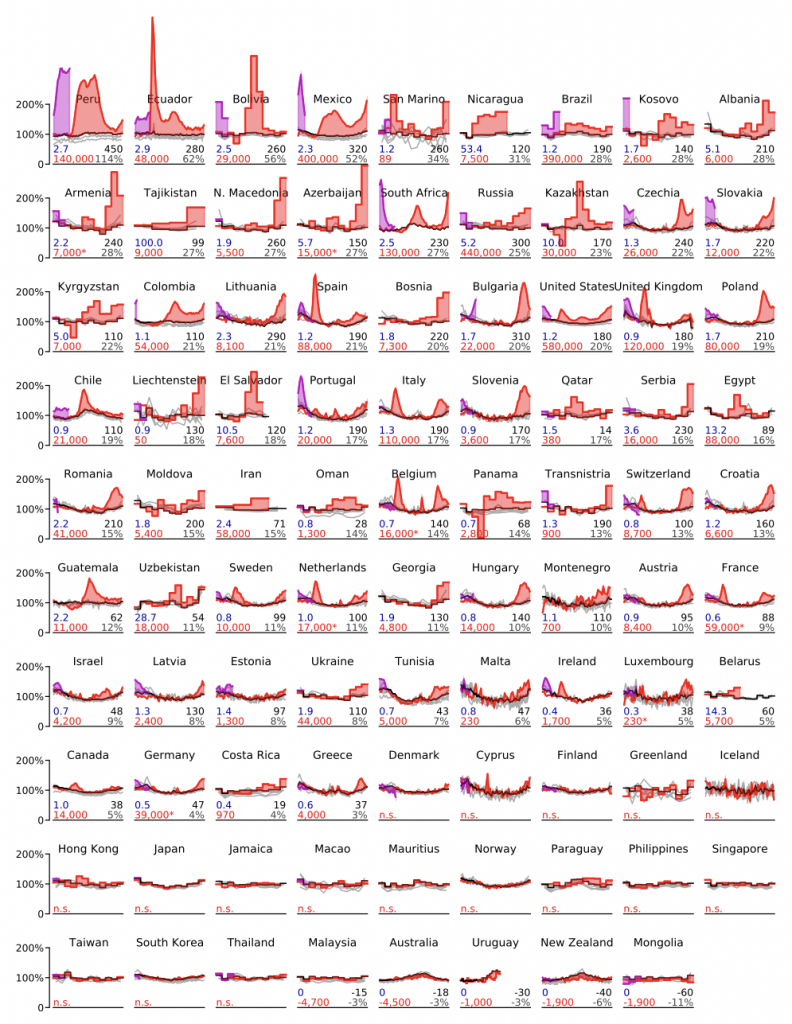
There are some clear patterns in the results. Countries in Latin America have by far the highest levels of excess mortality. Six of the top seven are in Latin America; and the fifth – San Marino – is a very small country, so it’s high level of excess morality may be partly due to chance.
Central Asian countries and South Africa have the next highest levels of excess mortality. (The authors subtracted deaths in the recent war between Azerbaijan and Armenia from those two countries’ figures.)
European countries, Middle Eastern countries and the United States have the next highest levels. Finally, geographically peripheral countries and East Asian countries have the lowest levels – close to zero in most cases. Germany has somewhat lower excess mortality than you’d expect, given its size and connectedness.
Two Latin American countries – Paraguay and Uruguay – appear among those that have zero excess mortality. However, the data for these two countries stops before the beginning of 2021, when both experienced a rise in COVID-19 deaths (a dramatic rise in the case of Uruguay). It’s therefore likely they would be somewhat closer to the top if the latest data were available.
Particularly notable is that every country in East and South East Asia has zero excess mortality. (Though bear in mind that several haven’t yet reported data for 2021.) All the others with zero excess mortality are either islands (e.g., Jamaica, Mauritius) or otherwise geographically peripheral (e.g., Norway, Finland).
To what extent has policy shaped these clear regional disparities? With the exception of border controls in geographically peripheral countries, it’s difficult to see how it could have been a major contributor. Indeed, there is substantial overlap between the strictness of lockdown measures in different regions of the world.
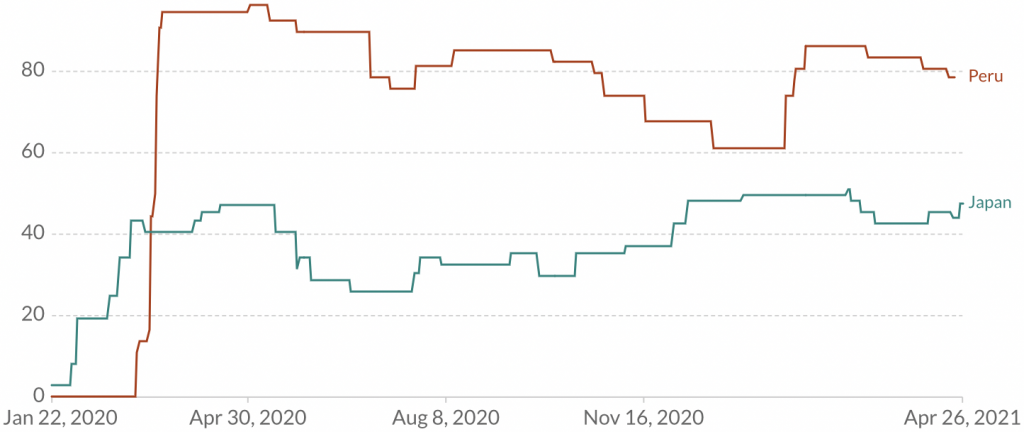
As I’ve noted before, Japan saw a minor epidemic last winter, but it retreated without any real lockdown measures being imposed. On the other hand, Peru went into lockdown on March 16th, but has seen the highest level of excess morality in the world. In fact, Japan has consistently had a low score on the Blavatnik School’s Stringency Index, whereas Peru has consistently had a high score, as shown in the chart below:

Overall, there is strong regional clustering of excess mortality: the level is high in Latin America, moderate in Europe, and low in East Asia. Unsurprisingly, it is also low in island nations like Jamaica and Mauritius, which leveraged their geographic isolation to prevent the virus getting a foothold.
This pattern of results suggests that geography is more important than policy (i.e., lockdowns) in explaining variation in COVID-19’s lethality across countries. Which exact geographic factors are involved is not yet clear, though the level of prior immunity is one obvious candidate.
To join in with the discussion please make a donation to The Daily Sceptic.
Profanity and abuse will be removed and may lead to a permanent ban.
Ah!, a map of the British Empire
Look at all the pink bits
Those were the days
They wouldn’t have done this covid shite then
Actually the draconian Contagious Diseases Act used for lockdowns in India was brought in by the British imperial power.
“excess mortality …. they took the superior approach of using a linear trend over the last five years”
Crap data remains crap data. The use of a ‘linear trend’ isn’t ‘superior’ – it’s a modelling exercise based on the demonstrably false assumptions that (a) mortality naturally follows a linear trend and (b) that a prediction from such an equation represents some natural baseline.
It should be properly adjusted for age and population, although using a linear trend as a baseline is still a modest step up from using a flat n-year average, which is what the lockdown advocates like to do to make 2020 excess mortality look as bad as possible for countries like the US and UK, both of which have had steadily rising raw death counts for a decade or more.
I suggest you read the CEBM’s analysis of how different forms of regression affect the massively variable concept of ‘excess deaths’:
https://www.cebm.net/covid-19/thoughts-on-estimating-excess-mortality-from-covid-19/
Simply – you can’t do better in terms of context than showing your target data against a historically representative period and forgetting foggy and misleading ideas like ‘excess’.
P.S. : I don’t disagree about the fundamental issue of the importance of geographical variables.
You only have to look at the small UK graph to see how this concept of ‘excess’ distorts reality, where the January peak appears as higher than the April one.
Thanks for the link to the paper but I don’t think it justifies your conclusion about “foggy and misleading ideas like ‘excess’” . Yes there are different methods of measuring expected deaths and therefore of measuring excess deaths. But that doesn’t mean they are all useless. In particular regression plus harmonic takes into account both the rather strong downward trend in death rates and the seasonality from flu deaths. A comparison of your target data against a “historically representative period” is very prone to error. How do you select the period? A bad flu year like 2017 or a good one like 2019 – or perhaps something from about 2010 when death rates were generally higher? A proper statistical approach takes into account a wide range of years and makes a systematic and justified estimate of what deaths would have been without an abnormal intervention.
“there are different methods of measuring expected deaths and therefore of measuring excess deaths.”
You’ve inadvertently confirmed my point. in that sentence. ‘Excess deaths’ is a term which is no more than a deviation from a modelled prediction. Think of Fergusson/Imperial’s predictions – and you should get my point.
I do predictions, too – but make it plain that is what they are. The one I did in October(?) to follow up on Vallances mad SAGE predictions of 4000 deaths a day happened to be many orders more accurate than his. But it was a prediction.
To use a prediction as a baseline of ‘what ought to be’ is flawed in so many ways in a non-linear situation such as mortality.
And I think you misunderstood what I was saying about an alternative, which was to abandon the term ‘excess deaths’, which inaccurately implies a fixed future norm, thus confusing description with prediction. Just settle for a comparison with a historically meaningful baseline, and simply describe your target period in those terms.
You are right that the comparison period has to involve judgment and choice – but that’s OK – it is explicit rather than hidden behind the falsity of the term ‘excess’. I totally agree with you that the usual 2-5 year recent moving average provides no sensible comparative baseline; I tend to use c. 25 years as a balance between relevance and historical redundancy.
But I never describe deviations from the central/max/min values as ‘excess’ or otherwise – just as what they are in terms of the chosen context. That is very different from a description in terms of a prediction.
P.S. One further thought. Perhaps my objection to this inaccurate terminology comes from an irritation with the lack of rigour that seems to permeate aspects of epidemiology, and which has allowed assumptions to be presented as facts.
sadly “science” is full of assumptions presented ad facts. Education too.
RickH
This could turn into a rather lengthy and technical discussion!
First prediction versus description versus conclusion (prediction is the wrong word – there are no predictions taking place, it all took place in the past). What is the point of just describing e.g. 2017 deaths and 2020 deaths without drawing any inferences? You might as show a Jackson Pollock painting. It would be aesthetically more pleasing. You don’t compare them because you like the look – if you are going to do anything useful you are going to say things like – “total deaths in 2020 were no higher than 2017 if you look at the year as a whole” (if that is true) with the implication that Covid does not cause any more deaths than a bad flu year. But as soon as you try to draw any conclusions from the comparison have used a model – in this case that 2020 would have been like 2017 if 2020 had been a bad flu year.
People associate models with complicated computer programmes with hundreds of assumptions and complex calculations. These are really tricky – above all it is very hard to determine sensitivity to the assumptions. But models can be as simple as you like. Incorporating harmonics into an excess deaths estimate is actually dead simple and can be done by hand – just average out the death for that time of year over the last n years. Regression is a little harder but if you stick to linear regression you can do it by hand. We had no option when I was learning stats.
So which is the better model – 2020 would have been like 2017 or 2020 would have been like the average over the last 20 years allowing for season and trend?
All the figures are rubbish anyway.
How many times….!
South East and East Asian countries do not use the same ACE inhibitors as the west. As now even the covidistas are saying the spike binds to the S protein on the ACE2 receptor in the lung then gets inside the blood stream and replicates on the cells of the capillaries and veins. The ACE inhibitors used by the west encourage this by deadening the defences of the immune system at the ACE2 receptor.
Unfortunately these inhibitors are so widely used and the body becomes so dependant on them that this information has been ruthlessly supressed for over 14 months. S Korea scientists reported on it in Feb 2020.
The medical profession has been continuing to prescribe drugs that enhance the chance of severe illness and death from SARS2.
That is the main reason for so-called geographic differences. No doubt its also been partially affected by lifestyles, less fatness , diabetes, heart problems, but these are amongst the symptoms for which these inhibitors are prescribed.
Now of course the ‘vaccines’ are creating spike factories in the very cells that SARS2 affects. The immune system will attack and cause blood clots and/or excessive internal bleeding. The mRNA vaccines covered in ‘mush’ are disguised from the immune system until they start replicating in the best areas of the body, primarily the brain. The more jabs you have the more chance of irrecoverable damage.
Its been bloody obvious for over a year, and yet time and time again anyone who talks about this is silenced. Many scietists/doctors who spoke over 12 months ago about this are now no longer visible, they appear to have been ‘disappeared’ from any public life.
“San Marino – is a very small country, so it’s high level of excess morality may be partly due to chance.”
Excess morality??? Too much of a good thing perhaps
‘….the level of prior immunity is one obvious candidate.’
So, just say, if that was the correct explanation, you would expect the immunosuppressed, the elderly, the obese and those with co-morbidities for which the medication suppresses the immune system, to be the most vulnerable………
‘The data coming out of China seems to indicate that it’s those with the co-morbidity are most at risk. For the seasonal influenza that’s also what we find. It’s the people with the co-morbidity that have the increase mortality rate.’
‘At this stage it’s a really bad cold which can cause problems in people. People are talking about the “lethal virus” but seasonal influenza can cause deaths in elderly but we don’t call that “the lethal influenza”
06 Feb. 2020 Prof John Nicholls, a noted Coronavirus expert, in China at the time of the outbreak
But why would we have listened to an internationally renowned Coronavirus expert who was present on the ground at the time of the outbreak when we could, instead, listen to our own by that time already hopelessly discredited modellers………….
And now we have another really bright idea….let’s have an enquiry that concentrates on why we locked down ‘too late’ despite overwhelming evidence from all over the world that lockdowns, masks, are entirely pointless
Maybe the enquiry could, instead, focus on government policy interventions and the contribution they made to overall all cause mortality, without which deaths in this country might very well have been of a level entirely consistent with a bad flu year…….?
Probably that inquiry might be quick and cheap, since the work has already been done:
‘The UK government, national agencies, and local-level bodies have taken decisions and adopted policies during the COVID-19 pandemic that have directly violated the human rights of older residents of care homes in England—notably their right to life, their right to health, and their right to non-discrimination.6 These decisions and policies have also impacted the rights of care home residents to private and family life, and may have violated their right not to be subjected to inhuman or degrading treatment’
‘Via its Department of Health and Social Care (DHSC), the government in mid-March adopted a policy, executed by NHS England and NHS Improvement, that led to 25,000 patients, including those infected or possibly infected with COVID-19 who had not been tested, being discharged from hospital into care homes between 17 March and 15 April—exponentially increasing the risk of transmission to the very population most at risk of severe illness and death from the disease. With no access to testing, severe shortages of PPE, insufficient staff, and limited guidance, care homes were overwhelmed. Although care home deaths were not even being counted in daily official figures of COVID-19 deaths until 29 April, some 4,300 care home deaths were reported in a single fortnight during this period.’
https://www.amnesty.org.uk/files/2020-10/Care%20Homes%20Report.pdf
Lethal, quite possibly criminal, socialist fascism……….
Ahem!…..
‘According to World Health Organization data, each year, two-thirds of global deaths are not registered with local authorities. That’s a total of 38 million annual deaths that aren’t part of any permanent record. Not only are the numbers not part of any global death tally, but the cause of death is also not recorded — leaving policymakers without critical information about population trends and health.
Now, that vast undercount of deaths might be changing — thanks to the virus. It’s pushed the science of death-counting into the international spotlight, highlighting the importance of strong and developed death registries.’
https://www.npr.org/sections/goatsandsoda/2020/09/25/914073217/why-the-pandemic-could-change-the-way-we-record-deaths?t=1620061584653
‘At the other extreme, 81 countries collect data of very low quality or do not register deaths at all. All low-income countries and two-thirds of lower-middle-income countries fall in this category.’
https://www.who.int/gho/mortality_burden_disease/registered_deaths/text/en/
Seek etc etc
Yes, the data really is junk……but you already knew that………
I’m surprised that no one on LS has commented on this, but the main susceptibility to Covid appears to be genetic, depending on the prevalence of Neanderthal genes:
https://www.biorxiv.org/content/10.1101/2020.07.03.186296v1.full.pdf
There’s a lot of genetic vulnerability in South Asia and Europe, much less in East Asia and almost none in Africa.
If you check out the map at the end of the article, it shows where the “Neandertal core haplotype” that confers Covid vulnerability is most prevalent and also where it’s completely absent.
Now, given the discussion around whether this thing “leaked” from a lab, isn’t it time we asked why the virus only affects people outside the Chinese empire (the Chinese basically own most of Africa)? If this virus is the product of gain-of-function research into vaccines, then why were the Chinese researching a vaccine for a virus they weren’t susceptible to?
Are we not asking these important questions because our globalist governments would actually quite like us to be more like China?
Food for thought.
It is interesting but this study was quoted as a reason not to do mass vaccinations in Sweden(an opinion article signed by 28 doctors)
https://onedrive.live.com/?authkey=%21AOdrODp%5F7wONU0U&cid=3BC4C3F6FB825253&id=3BC4C3F6FB825253%21129518&parId=3BC4C3F6FB825253%21118656&o=OneUp
Can the author please do a mathematical correlation between COVID cases/deaths vs region/latitude/longitute per country, and then compare that with a similar correlation between COVID cases/deaths vs lockdown stringency per country? Would be interesting to see what predicts COVID cases/deaths more accurately.
Nicaragua has officially only 182 C-19 deaths but figures high in excess mortality above.Could that be that they don’t test for C-19 as none are reported? This left leaning country has consistently not accepted any LD.
Therefore publish another map below.Percengtage of population over 65 died of C-19 according to data.There you see no excess in Nicaragua due to not using test.But other countries using test om a mssive scale give the following “geriatric” picture with again Latin America on top.Africa has low proportion of over 65 but this map shows deaths as proportion.South Africa only high.Interestingly Iran high. The white area again East asia and Africa.Previous cross immunity and similar bat species?
Hello!
Has SARS COV2 been purified and isolated not using poisoned, decaying cell cultures?
No!
There is a further complication when looking at crude numbers over foxed timescales; you may not be comparing like with like. The onset of the major peak in April 2020 was much later in the year than any of the peaks for previous epidemics or pandemics, such as the two major flu pandemics of 1968 and 2009-10. So it would be interesting, sensible even, to match peak to peak for those three and see whether there was any difference in the excess compared to previous evidence.