The ONS announced today that there were 45,567 deaths registered in England in March, which is 18% less than in February, though still 1.5% more than the five-year average. (Note that deaths decreased throughout the month, so that by the week ending March 26th, the number of deaths was in fact below the five-year average.)
However, the best overall measure of mortality isn’t the number of deaths, or even the death rate (i.e., deaths divided by total population), but rather the age-standardised mortality rate. This takes into account the ages of those who died, as well as the age-structure of the overall population.
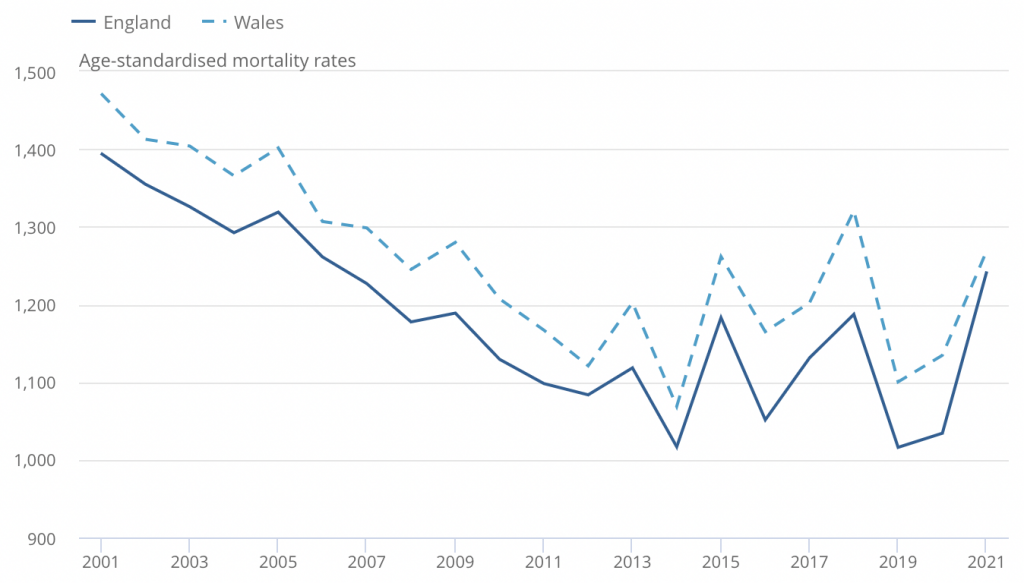
In March, the age-standardised mortality rate was 26% lower than in February, and 5.5% lower than the five-year average. This chart from the ONS shows the age-standardised mortality rate for the first three months of the year, each year, going back to 2001:

It indicates that 2021 has seen the highest level of mortality in the first three months of the year in England since 2006. However, it’s worth noting that the figure for 2021 is only 5% higher than the figure for 2018. And in Wales, the level of mortality in the first three months of the year was actually lower than in 2018.
January saw a much lower peak than April of last year, and today’s figures confirm that the mortality rate has fallen substantially further since then.


To join in with the discussion please make a donation to The Daily Sceptic.
Profanity and abuse will be removed and may lead to a permanent ban.
So, clearly lockdowns work then. I will be writing to my MP to vote for more lockdowns, harder, tougher, longer. I feel so much safer. In fact, I’ll volunteer for voluntary euthanasia to be sure that I’m protecting my friends and loved ones.
Where’s my happy pills……..
Witty says you can only euthanase as long as it more than 28 days after your last positive covid test.
How long before you can claim Long Euthanasia ?
Forever?
Many a true word spoken in jest,Winston.
Are deaths in March 2021 being compared to the average for 15 to 19, or, as they should be, 16 to 20?
Doesn’t matter Ossettian, lockdowns work, our Prime Minister and the leader of the opposition said so.
Don’t let data or facts get in way dogma , it’s true I tell you.
“still 1.5% more than the five-year average”
The 5-year average is a meaningless baseline, covering an anomalous period of low mortality. You need a much longer baseline for meaningful interpretation.
“ the best overall measure of mortality isn’t the number of deaths, or even the death rate (i.e., deaths divided by total population), but rather the age-standardised mortality rate.”
Nope. It confuses modelling with simple description. It’s theoretical, not factual, since the relationship between age and mortality isn’t fixed. It introduces speculative explanation into the calculation. Of course, some professionals love it : it makes things look sophisticated and kicks Occam in the teeth.. Don’t be fooled – simple population standardization is a better real-world comparative measure. Age-standardization should be presented alongside, not as a substitute.
Finally – short period comparisons of three months can be interesting – but not significant, given that mortality tends to vary significantly over years, not months (thus the importance of the ‘dry tinder’ effect).
Would not an even more relevant measure be the life-years lost?
Wait until the bow wave of untreated cancer and other diseases hits. The we won’t have low age standardised mortality.
Yes. And how many of those will die within 28 days of a positive test result? Lockdown, here we come, because lockdowns work obviously (except in California, and Belgium, and…)
What you need is an actuarial perspective, such as: https://www.actuaries.org.uk/system/files/documents/pdf/longevitybulletin03201205.pdf No doubt the Treasury has got it’s eye on it, along with pension schemes etc.