I’m a doctor at University Hospitals Leicester NHS Trust. We have about 2000 inpatient beds across three main sites and serve roughly 1 million people in Leicester city, Leicestershire county and Rutland. Leicester is a multi-cultural city and 36% of our 16,000 health care workers are from BAME backgrounds.
Many of my colleagues are angry and confused about what is happening nationally and particularly in Leicester and Leicestershire. We are reminded daily that we are not allowed to speak to journalists or on social media, which is why I am stringently anonymous and more vague than I’d like to be here. I love being a doctor, and I risk suspension for speaking out.
I’m going to use Public Health England’s own numbers for this analysis (found here) and I’m going to explain why I think the conclusions they (and the politicians) have drawn are wrong.
The Leicester and Leicestershire experience of COVID-19 echoes the majority of cities in England, with the exception of Birmingham and London, whose peaks were harder and faster. In early March, we could see the COVID-19 crisis coming. We weren’t ready, it’s fair to say. We rapidly wrote guidelines, trained staff and fought over who needed the little PPE that was available. Every day brought new guidance from Public Health England. Each day, the guidance was different to the day before and it was incredibly stressful.
We already run at maximum capacity the vast majority of the time and with the standard shortages of doctors at middle grade “registrar” level, we were terrified about how we would manage. Suddenly, on March 16th, shielding was announced along with stringent social distancing for pregnant women. We had to protect our staff. We lost 15% of our department, who could no longer provide face-to-face care.
In Leicester Hospitals, we rapidly increased our numbers of inpatients and patients on ITU with COVID-19 in the last two weeks of March. It was a distressing time for staff, particularly due to the lack of equipment and the daily changing guidance. We were petrified for our families and ourselves and many were also juggling negotiating key worker school places (not automatic), trying to buy food around odd shift patterns and worried about how much worse it was going to get.
By April, we got access to PPE via the Army and the guidelines started changing weekly instead of daily. Everybody calmed down. We were going to manage. We encouraged social distancing among staff, but not rigidly. We wore masks, plastic aprons and gloves for patient care outside of theatres and ITU and still didn’t seem to catch COVID-19. Nothing seemed as bad as had been described elsewhere. Oddly, colleagues in other large English cities were also reporting fewer cases than they had expected. Our younger children were in schools or nursery and despite no social distancing at all and full mixing with all those risky key workers, nobody’s children were ill. We heard about and worried about deaths of health care workers across the UK, but locally, relatively few colleagues were ill and the vast majority recovered without needing hospital admission. The early deaths data appeared from the ONS showing that security guards and chefs had the highest risk of death, not health workers.
By May, positive cases averaged around 10 a day and deaths were continuing to fall. In late May, we started swabbing every single admission to the hospitals, and this is where things get interesting. I work in a department that isn’t respiratory medicine. This means that the patients who are in our area are there for other health issues that are not caused by COVID-19 (think surgery or mental health). Of those we swabbed, just 1% tested positive and all of them were asymptomatic. That rate has been steady since May 23rd. I believe that our patients are representative of the rate in the UK population and, for what it’s worth, it’s the same story in Manchester, Leeds and Guildford, where I’ve been comparing notes with colleagues. Unpublished data shared on an open forum from Leeds, Manchester, Sussex also confirms this – 1%, all asymptomatic when testing positive. These patients have, almost without exception, not developed any symptoms, although some have had household members with a cough.
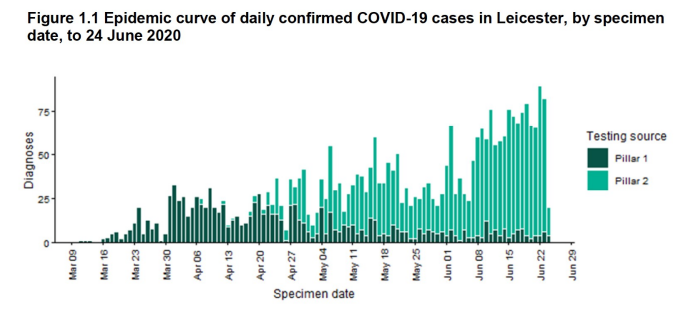
By June we were down to between three and eight positive cases a day in UHL (also known as Pillar 1 testing, shown as dark green on the graph). This has remained unchanged throughout the whole of June.

The point of “Lockdown” has always been to ‘flatten the curve’ in order to ‘Protect the NHS’. Given we were coping on March 31st, when we had nearly ten times the number of positive cases in hospitals, with relatively little access to testing, we are certainly coping now. The issue and alleged cause of the “Local Lockdown” is our Pillar 2 numbers, which are the lighter green ones on the graph. These are the community tests outsourced to private companies. There is no guarantee that these tests are all taken from different people (unlike the Pillar 1 data, which is cross checked against a unique patient identifier). In fact, the Government accepts that the number of Pillar 2 cases is not the same as the number of people with COVID-19 because Pillar 2 data includes people who’ve been tested more than once – often because they have to re-test before they’re allowed back to work.
We have also brought in two mobile testing stations into these areas, just so we can find all of these people with the virus, which, as I say, are almost certainly no more than 1% of the population. So lets get this really clear: we have locked down based on unreliable test results which may contain multiple positives for one person, all accompanied by a falling rate of hospital admissions and deaths.
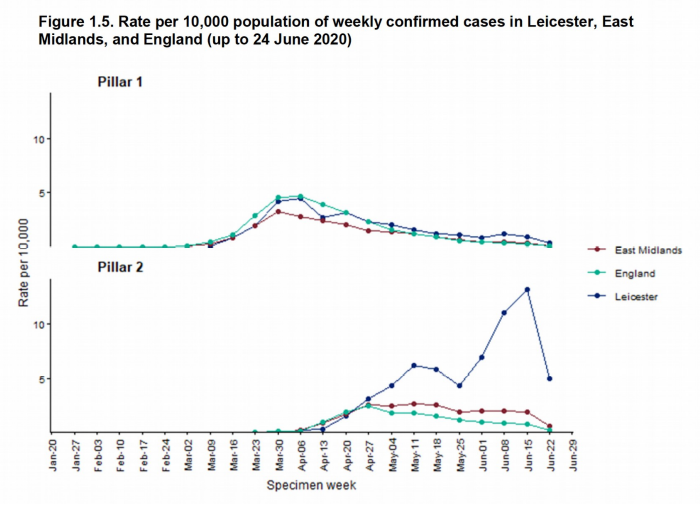
Some might say that these community rates are really serious and that all these people could be admitted to hospital in two weeks. However, these rates have been high since mid-May, and our Pillar 1 hospital numbers remain unchanged – so there’s little evidence they’re being admitted to hospital. The other key thing to note is that our Pillar 2 positive numbers have already fallen as shown by the blue line on the Public Health England graph below. Note that there’s no data about what community rates looked like when we had our actual peak of COVID-19 – they weren’t doing Pillar 2 testing then.

The final reason we don’t need to worry about the risk of overwhelming the hospital is the age of the people affected. The median age of those with a positive community test is 39. The risk of a 39 year-old dying from COVID-19 is less than that of them drowning (based on the ONS data). Thirty-nine year-olds are out at work, particularly 39 year-olds who live in North Evington, the worst affected area in Leicester city. Over 95% cases are in under-65 year-olds, again at substantially decreased risk. North Evington has a higher than average population who were not born in the UK, and have fewer qualifications and work in manual jobs. They live in smaller houses with less outside space. This means that they have not had a middle class luxury lockdown with working from home and sitting in their garden.
They are out working in the garment factories, which never closed and are poorly ventilated, in our hospitals and in food production. They are crucial to our country, and it is inevitable that some will now be carrying the virus. They are now crucial to our COVID-19 response too. They are the people, along with all the other exposed key workers, that could bring Leicester to our crucial 20% infection rate to give us the herd immunity that we need to get our vulnerable people back out of their homes.
The most criminal thing about the whole of this investigation is that they have only managed to track-and-trace 11 cases. That is, they’ve only managed to trace the contacts of 11 out of approximately 900 new cases in the past two weeks. You won’t be shocked to hear that they found no links between those 11 cases – statistically they wouldn’t.
The only other thing I want to address is the myth of Covid and children. We had one child with COVID-19 in our hospitals back in May and none since. Public Health England say in their report “that the number of children with positive tests remains relatively static”. We absolutely do not need to worry about our children or teachers under the age of 65. The research worldwide is clear. However, they have shut our schools again. Education is the best long-term route out of poverty, the best thing we can do for vulnerable children and we are punishing them for a disease that isn’t even making our population ill.
Local Lockdown in Leicester is purely a tool of control. It’s a threat to make us behave. We weren’t actually misbehaving for the record – our protests have had lower numbers and less violence than the national average, we haven’t been going to any beaches – there aren’t any – and the vast majority of the population have taken the random rules of lockdown very seriously. Be warned. Given our cases have already started falling, they will be able to call this a success in two weeks. By then it might be your turn.
Dr Q


Donate
We depend on your donations to keep this site going. Please give what you can.
Donate TodayComment on this Article
You’ll need to set up an account to comment if you don’t already have one. We ask for a minimum donation of £5 if you'd like to make a comment or post in our Forums.
Sign UpLatest News
Next PostLatest News