
The ONS announced last week that there were 43,435 deaths registered in England in October, which is about 1,000 less than in September, and 7.1% more than the five-year average.
This is a marked change from last month, when total deaths were 19.4% above the five-year average. Looking at the breakdown by leading cause of death, it is also quite different from September’s:
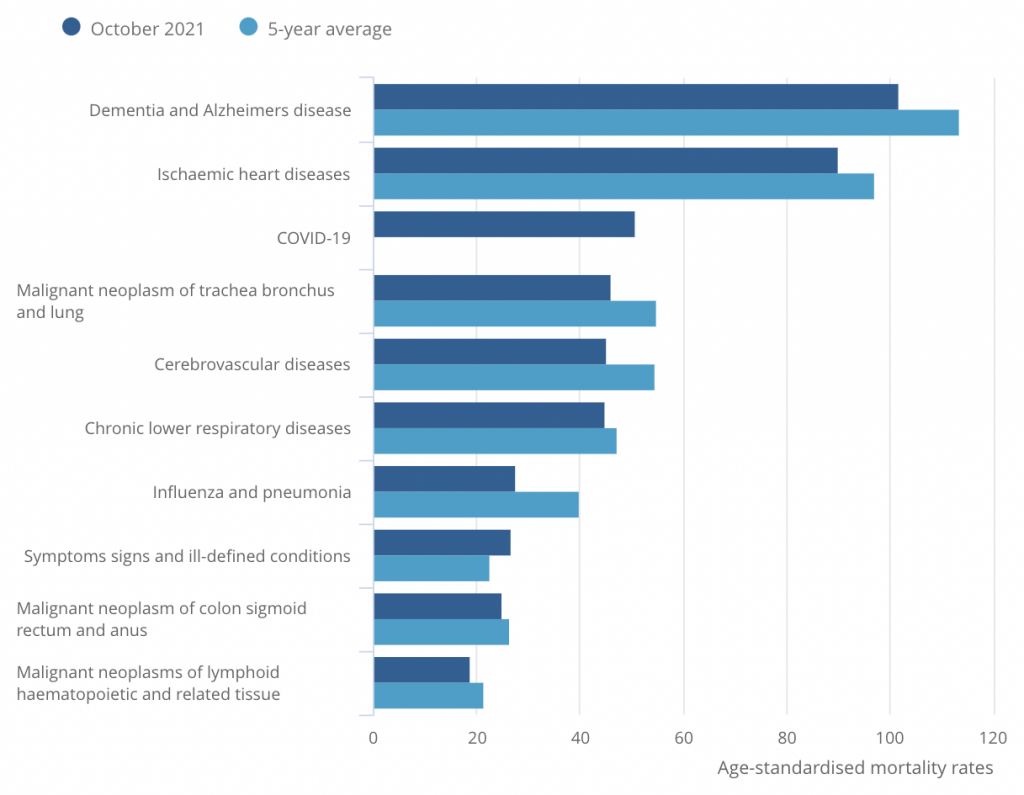
Last month, several non-Covid causes of death were above their five-year averages, notably dementia and Alzheimer’s, as well as ischemic heart disease. In October, by contrast, all non-Covid causes other than “Symptoms signs and ill-defined conditions” are below their five-year averages.
This suggests that my concerns about the delayed impact of lockdown on mortality may have been misplaced. In other words: last month’s elevated rates of death from non-Covid causes may have been a blip, rather than the start of trend toward rising mortality.
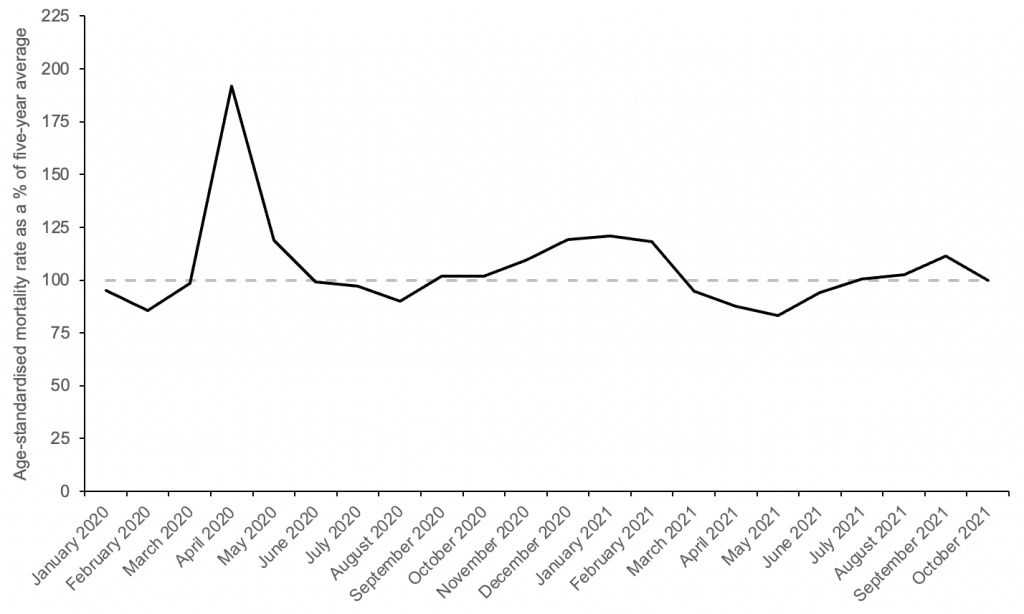
October’s overall age-standardised mortality rate was approximately equal to the five-year average – 0.1% lower, in fact. Again, this is a marked change from last month, when the age-standardised mortality rate was 11.2% higher than the five-year average.
Since age-adjusted excess mortality is the best gauge of how mortality is changing, the fact that October’s value is about equal to the five-year average indicates that any impact of lockdown on mortality must be relatively small. Here’s my updated chart of excess mortality in England since January of 2020:
Various newspapers have reported a large excess of non-Covid deaths in England over the past four months. However, these claims appear to be based on absolute excess deaths, rather than age-adjusted excess mortality.
In October, there were more than 2,000 non-Covid deaths in excess of the five-year average. Yet as I already mentioned, age-adjusted excess mortality was approximately zero – and that includes the Covid deaths. This means that the most of the ‘excess’ non-Covid deaths we’ve seen recently are due to population ageing over the last two years.
All in all, October’s figures are more encouraging than September’s, giving no indication that mortality is unusually high. Let’s just hope it stays that way.


To join in with the discussion please make a donation to The Daily Sceptic.
Profanity and abuse will be removed and may lead to a permanent ban.
Isn’t it still too early to say that? Cancers not caught early enough may well not have caused death yet, among other factors.
Yes this will play out slowly not quickly, and the biggest impact will be on the third world not the UK.
Isn’t it clear from the graph that they’ve just created a new category – COVID – and deaths that were previously in other categories are not in the COVID category?
Or said in another way, they have created the perfect method for laundering the deaths they cause through their jabs and other measures.
Noah still banging on with duff analysis, using Narrative constructs like ‘Covid deaths’ and ‘excess deaths’, coupled with ignorance of the flaws of age-adjusted figures.
Do you honestly simply accept that deaths from Covid rank third in this hierarchy of common fatal disease, given its low incidence and therefore minute incidence of fatality? Pull the other one.
OK – there is a bit of a message to be gleaned from one month’s dodgy figures – but it’s very limited and to be treated with caution.
What can be said is that the continuing panic scenario is blown out of the water.
A slow learner!
Perhaps you could explain what you mean. What is duff by using widely accepted metrics? What do you mean by “narrative constructs”? I looked that up and am still none the wiser. The only thing I can think of is that you mean “Covid deaths” cover a much wider range of causes of which Covid is often just part of the story. I have asked for clarification of that from the author.
Which month’s dodgy figures? They are all questionable, but in this case to you mean last month’s high or this month’s lower ones?
Why do you feel the need to make judgements abot Noah’s character?
“What is duff by using widely accepted metrics?”
Oh – nothing at all. Listen to the BBC and Stephen Powis any day for the accepted metrics.
The flawed use of recent short term averages as a baseline has been extensively discussed, as they inflate the exceptionality of 2020-21. ‘Narrative construct’ – a meme produced by the official narrative.
Look – if you haven’t sussed the total unreliability of (a) the use of the term ‘Covid’ and (b) the highly questionable nature of the term ‘Covid deaths’, then you really need to go back to basics. Anyone who does not have difficulty in keeping up would immediately know that the proper meaning of ‘Covid death’ is a death caused specifically by ‘Covid’ – a secondary pulmonary disease. They would further know that the data on this is an unknown.
I’m not judging Noah’s ‘character’ – I don’t know the person. I’m commenting on a run of flawed analysis.
Hard Data Shows the Covid Vaccines Don’t Work
https://www.americanthinker.com/articles/2021/11/hard_data_shows_the_covid_vaccines_dont_work.html
From the front line this weekend I can report it is all quiet . After three months of unusually high levels of respiratory patients it is as though summer has returned. I can also report that many trusts are today cancelling routine surgery booked for December ” just in case ” . This performance will go on as long as the Mousetrap .
Thanks. Always informative to read your updates from the front line.
Thank you for your very apt analogy. This is no more than a theatrical performance; one of incompetent acting and atrocious direction
Not sure I’m following the logic in this piece – 7.1% increase does not equal equal in my book. But I agree, it is heartening that there has been an improvement vs the month before.
However, I can’t help noticing in the bar chart of age-standardised mortality broken down by cause that October 21 mortality is reduced relative to 5yr average by ~5-20% for all causes except “Covid-19” and “Symptoms, signs and ill-defined conditions”. Dry tinder effect? Missattribution? <Insert preferred conspiracy theory here>?
It’s either misattribution, or Covid is managing to magically reduce the usual causes of death at old age. I wonder which is most likely?
The latter, obviously, and also the Chinese Virus cures influenza.
Actually, nothing magical there, if you are old and die from Covid, you cannot die from another disease as well. If we started culling old people, the other old-age diseases would also “magically” go away. People tend to only die once, you see.
Or, viewed another way, neglect and unavailability of health care has culled all that it’s going to cull, for now. We’ve levelled down to a steady state.
Seems to confirm my suspicions about why GP Practices* are only “commissioned” to boost vax the over 75s. Are they being given some special booster jab denied to the rest of the boost seeking community?
Segregation by location meaning that jabbers don’t have to make decisions on the spot about who to give the ‘special vax’ to and who not.
I would previously have laughed out loud at the suggestion of a ‘boost to kill/cull’ policy but these days, who knows?
* Which is the case at my large GP Practice which lists about 10 Drs. as Partners and a further 20 or more Salaried.
Just to be clear, do we assume that the Covid deaths are the usual “within 28 days” tripe?
No reason why not plus the usual attributed to Covid behind closed doors if it is still usual practice that Covid deaths only require a single signature on the death certificate and other reductions in time consuming paperwork which was the case during Lockdown One.
I can feel myself turning into an A+ conspiracy theorist as time goes by which was never previously the case.
Only A+? come on! You must try harder! There is the A+++ with tin foil hat level to aim for
That’s what happens when governments and formerly-trustworthy(ish!) professions demonstrably lie and mislead over and over again, and keep on lying even when basic logic shows what they are doing.
Age standardised mortality can be a good measure, but it does hide what is happening here unless you use it carefully.
There are a number of reasons that deaths are still running high at the moment but ASM would appear to be back in a relatively normal range
The abnormal numbers of people dying in the 15-44 and 45-64 age groups (and that’s per million in the group so adjusted for both age and population roughly speaking) doesn’t get reflected in ASM in a way that can be seen. For example 15-44 is about a 3% component of ASM and so a say 10% increased in mortality in that age group would have only a 0.3% affect on ASM which wouldn’t be noticed. And the age 45-64 group is only about a 11% component of ASM so again higher mortality in that age group doesn’t really show up in a noticeable way.
So really ASM just tells you about the 65+ age groups. What is happening there is that there are less vulnerable people in those age groups currently than there have been in say a 5 year Autumn period on which a compare is made. It may be that increased mortality in those older groups is balanced by this less ‘dry tinder’ affect. This is not to be confused with the dry tinder effect say immediately after Spring 2020 when the pandemic occurred and pretty much ended (bar the disastrous response), and where the pandemic brought forward by months the dates of deaths of those at end of life.
Let’s also remember that ASM is dependant on the population numbers you assume in each age group. We know ONS are still basing things on the 2011 census so there is potential for errors in the age standardising calculation to have significant affects also.
And here is a chart for the 45-64 age group looking at mortality (per million in group) since 2010.
Mortality is still running high in the 45-64 age group. But that won’t be visible in the ASM figure as mentioned.
Clearly from this there should be ongoing concerns about the impacts of lack of access to healthcare and vaccine related deaths.
Now look at the oldest upper banded age group for which ONS publish good data, ages 75-84.
Can you see deaths per million for 2021 for that age group from the merge of all the different years? Much less so than the 45-64 age group in the radial chart and not at all for the cumulative chart.
But it’s that sort of age group (75-84) that is driving the thinking when we talk of ASM and come to conclusions about overall mortality.
How dare you present data which does not fit the “sceptics'” message? That’s not very sceptical at all!
“Age standardised mortality can be a good measure”
Yes – in the appropriate context of differently structured populations etc. But it is often introducing speculative modelling into a situation that doesn’t require it. Often, population size standardisation is all that is needed, and is clearer. The KISS principle is important in statistical analysis before getting into more complex manipulation.
P.S. This is not about looking at differing mortality between age groups.
Just as predicted here and elswhere 12-18 months ago.
The final tally of non Covid excess deaths caused by lockdown and consequential failings within the NHS will take decades be fully realised.
The last being the final cause of death of babies damaged by understaffing of maternity units and curtailment of home visits by midwives during Lockdown 1.
By which time those responsible will be enjoying a comfortably funded retirement with gongs and medals on the sideboard to admire.
October deaths in England and Wales have been 46,000 for the last three years. I’ve been banging on about this to normies. The October 2020 deaths figure differed from October 2019 by 44. That’s not a misprint. 46,238 versus 46.282. This in a month where we supposedly had thousands of “covid deaths”. It’s all a pack of lies.
We have had a very mild October.
The big freeze of the last 2 weeks of November will hit the vulnerable hard as is always the case.
I’m sure we can blame omnicon or covid-19 or something though so not to worry when the deaths from November jump again.
Totally agree that the excess deaths in the younger age groups are entirely hidden in the stats with age adjusted mortality. Overall deaths in the young make up a tiny proportion of all deaths so even if you doubled these deaths, they’d have little impact on overall death figures.
This suggests that my concerns about the delayed impact of lockdown on mortality may have been misplaced.
Kudos to Noah for intellectual honesty. (The data also show that vaccines have had no discernible effect on mortality)
So no discernible mortality effect in the 15-19 age group? (see attached chart). The male version of the graph looks worse than this.
Is the onus on the vaccine manufacturers to prove they are safe or is the onus on others to prove they are dangerous. I’d suggest the former.
I don’t claim that the chart in any way proves that the vaccines caused those deaths in the 15-19 age groups. However there is a very worrying signal in that data that needs looking into. What were the causes of death for example? Or do we just ignore it and declare no discernible effect?
“The data also show that vaccines have had no discernible effect on mortality”
Conclusion still : the jabs don’t work.
So you’re discounting those that were culled in the roll out last winter?
Here is an idea that a few might find hard to accept.
It would be hard to argue that at a basic level our health care helps and saves people’s lives. For example, when accidents happen, particularly to younger healthy people, then the healthcare system is a real life saver.
However, beyond that, I reckon the NHS does more harm than good. At best it extends life a bit for some people. It probably also shortens a fair few lives through botched operations, frail people catching infections in hospitals and trying to treat people that are so hopelessly compromised.
Maybe, just maybe, people staying away from hospitals and doctors for almost 2 years is having a net positive effect on health.
I think that’s a very fair point, and it’s something I’ve been giving some thought to as well.
Far too simplistic. Of course, there are botches and mistakes and wrong prescription, but I’m not atypical in having my life considerably extended by the interventions of health care system.
The return on a maternity department, and of healthcare for infants, is probably very high in terms of life years saved, just because infants typically have a long life ahead of them if they survive the first few years. Also a lot of what needs doing in a maternity department is relatively cheap and low-tech.
On the other hand there are lots of people on take-these-pills-daily-for-the-rest-of-your-life regimens who probably shouldn’t be, for example many diabetics who might do better to change their diet.
“October’s Age-Standardised Mortality Rate Was Equal to the Five-Year Average”
So… this is all about depopulation… right?
Hospitals in USA and in first world countries are refusing life-saving Ivermectin treatment even with court orders. Big Pharma doing everything they can to jab us no matter what, while alternative COVID cures EXIST! There happens to be heavy censorship who are looking for these treatments. The Research Is Clear: Ivermectin Is a Safe, Effective Treatment for COVID. Get your Ivermectin today while you still can! https://ivmpharmacy.com
Isn’t your chart labelled wrongly based upon comments below -ie you say dementia deaths above 5yr av yet 5yr av line is longer. Isn’t it the reverse? Just trying to help.