After a year of damaging revelations about the state of the Met Office’s temperature measuring network, the Green Blob-funded ‘fact-checker’ Science Feedback has sprung to the defence of the state-funded U.K. weather service. It has published a long ‘fact check’ seeking to exonerate practices that have recently come to light including the locating of stations with huge heat corrupted ‘uncertainties’ and the publication of invented data from 103 non-existent sites. Inept is a word that springs to mind. At one point, Science Feedback justifies the estimation of data at the non-existent stations by referring to the hastily changed Met Office explanation for station/location long-term averages. The original and now deleted Met Office webpage referenced station names and provided single location coordinates including one improbable siting next to the sea on Dover beach. This would appear to be a new low in the world of so-called fact-checking – designating copy as ‘misleading’ based on an explanation changed after the article was published.
The first Daily Sceptic article reporting on the existence of 103 non-existent stations can be read here. The second appeared last month here and detailed the unannounced web changes and the obvious cover-up intended to deflect criticism from the invented station data.
Under the verdict “misleading” Science Feedback claims that the average data going back 60 years for stations is not “fabricated” but estimated using “well-correlated related neighbouring stations”. This is said to be a scientific method that is published in peer-reviewed literature. The Met Office discloses it has “relatively few” stations with 30-year data from which long-term averages can be calculated. The distinction between estimated and fabricated is moot. A pundit calling the winner of a sports match before it has taken place is an estimation of the result, and the opinion is no less a fabrication or invention however distinguished the pundit and however well-regarded any peers signalling agreement might be.
Let us examine the claim of “well-correlated neighbouring stations” by taking an example from the Met Office’s now renamed “location-specific long-term averages” climate database. Cawood in the West Riding of Yorkshire is a pristine Class 1 site designated by the World Meteorological Organisation (WMO) as providing uncorrupted data over a large surrounding area. It also has an immaculate record of temperature recordings from the same site stretching back to 1959. But no rolling 30-year average for Cawood is provided. Instead the Met Office flags data for five other sites between two and 27 miles distant. Unlike Cawood, all of these have average data despite the fact that four no longer exist and the fifth, High Mowthorpe, is 27 miles away and at a 163 metres higher elevation.
Again we are obliged to the super sleuthing of Ray Sanders for bringing the Cawood data to light. He is not inclined to be charitable and notes:
The Met Office has opted not to perform a simple long-term averaging representation from just one Class 1 site’s readings (with no other inputs required) and in preference has supplied no fewer than five alternative much inferior sites with all manner of adjusted, amended, modified and likely corrupted so-called ‘data’ to confuse the public. The term ’smoke and mirrors’ comes to mind.
Why is the Met Office not showing the data for the long-running Class 1 Cawood site, he asks, adding: “What are you trying to hide?”
The Science Feedback puff for the Met Office takes aim at both the investigative work conducted by the Daily Sceptic and Ray Sanders who publishes on the Tallbloke’s Talkshop blog. It has all the hallmarks of being written in collaboration with the Met Office since its long and detailed explanations have mostly come from the latter.
Science Feedback is a partner with Meta where it acts to “verify the credibility of viral content” on Facebook and Instagram. In 2020 it was given seed funding from the Google News Initiative, “to build a database of fact-checked content, allowing to identify sources that repeatedly spread misinformation”. Regular readers will recall that Google has past form in trying to disadvantage inconvenient temperature information on the internet. In 2022, Dr. Roy Spencer’s page detailing accurate satellite temperature data, showing less long-term warming than that claimed by surface measurements, was kicked off Google AdSense for publishing “unreliable and harmful claims”. The decision looks more stupid by the day with Spencer’s UAH measurements confirming the recent short-lived spike in the global temperature. Regular readers will also recall that at a 2022 World Economic Forum ‘disinformation’ seminar, the UN’s global communication chief Melissa Fleming noted that her organisation had partnered with Google to ensure that only UN-approved climate research results appeared at the top of search inquiries. “We are becoming more proactive, we own the science and we think the world should know it,” she boasted.
Last March, the Daily Sceptic shocked the climate science world by revealing via a Freedom of Information (FOI) request that nearly eight in 10 Met Office sites across the U.K. were so poorly sited in junk Class 4 and super junk Class 5 that they had WMO ‘uncertainties’ of 2°C and 5°C respectively. Yet these measurements, used to calculate data to one hundredth of a degree centigrade, are a key climate indication backing the Net Zero fantasy.
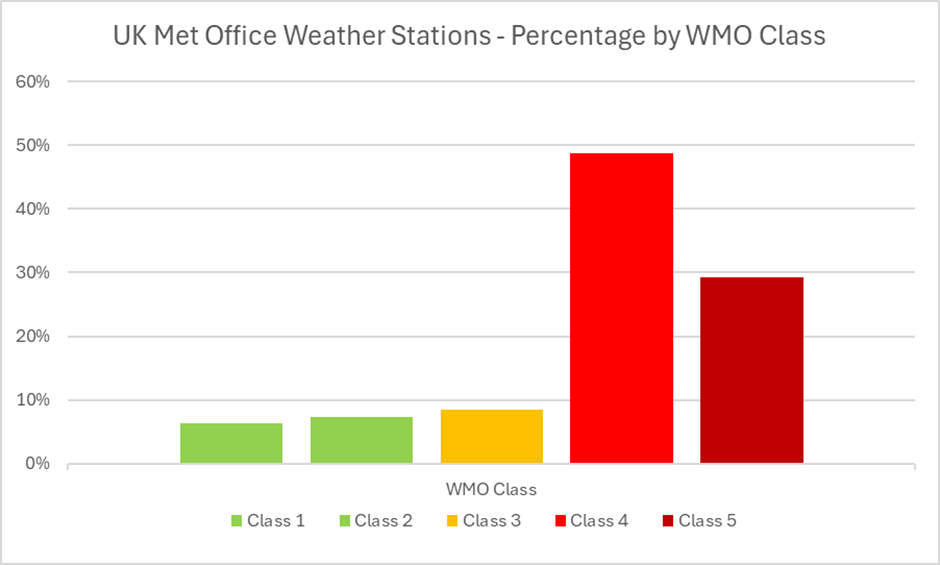
Science Feedback states that the Met Office “clearly explains” on its website that many of its stations are of higher classes 3 and 4. Looking at the block graph above, a more accurate and clearer explanation would be that most, indeed almost all, of its stations are in Classes 4 and 5. The Met Office notes that WMO guidelines do not state that Class 5 sites cannot be used for climate reporting. In fact the WMO guidance states that a Class 1 location can be considered as a reference site, while a Class 5 site is a “inappropriate environment for a meteorological measurement that is intended to be representative of a wide area”. What this means is that ‘record’ temperatures collected besides airport runways swept by jet exhaust are useful for pilots operating in the immediate environment but are a bit of an ask when it comes to pumping the Net Zero climate emergency narrative.
As explained to Science Feedback by a Met Office spokesman, continued the curious fact check, “data will only be quoted in climate records if the weather station it comes from meets inspection standards”. Well it seems that that this depends on who is conducting the “inspections” – not the WMO, that is for sure. According to information released under a FOI request to Paul Homewood, the Met Office states it will only quote records from classes 1 to 4. Data from Class 5 “will be flagged and not quoted in national records”, it adds.
In reality, the Met Office barely pauses for breath in its rush to declare recent Class 5 site records. These include the highest daily maximum temperature in Northern Ireland set in 2021 at Castlederg. The highest January monthly temperature was set last year at Achfary and this Class 5 site also holds the record set in December 2019. Three U.K. area records have also been set at Class 5 locations including England NW, East Anglia and England SE and Central S. This latter record was provided by St. James’s Park, which was one of five sites that were said to top 40°C on July 19th, 2022. This particular event was lauded at the time by the Met Office as a “milestone in climate history”. The record 40.3°C was a 60-second spike of 0.6°C recorded around the same time as three Typhoon jets were landing at RAF Coningsby, while another 40°C site was Northolt airport, also designated Class 5. In total, all but two claimed records since 2000 arise from Class 4 and 5 locations.
The Met Office explains to Science Feedback that it continues to use its higher class stations because it has its own “long-standing inspections standards”. In other words, it marks its own homework as the block graph below, again the result of an FOI request, shows.
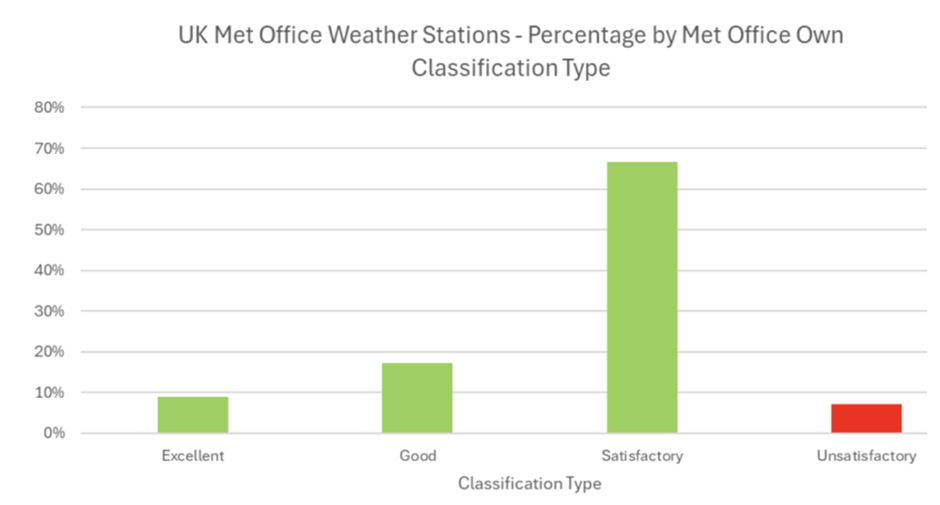
Clearly a big improvement since the Met Offices rates over nine out of 10 of its stations as ‘Excellent’, ‘Good’ and ‘Satisfactory’. Those of a cynical nature might riff on the warning from an earlier age that self-regulation, like self-stimulation, leads to blindness. Just 27 ‘Unsatisfactory’ stations, presumably real shockers, are to be found on the naughty step. The in-house inspections are said to “ensure data quality and minimise uncertainty”. If a site falls below the acceptable inspection standards it will be either closed or its measurements will not be used in climate records, promises the Met Office. Possibly an outbreak of extremely short sight explains why the highest recorded ‘record’ temperature in Wales was recorded at the ‘Unsatisfactory’ site of Hawarden Airport in 2022.
Chris Morrison is the Daily Sceptic’s Environment Editor.


To join in with the discussion please make a donation to The Daily Sceptic.
Profanity and abuse will be removed and may lead to a permanent ban.
First class report.
“Better to have questions without answers, than answers without questions,” as Professor Feynman used to say.
In more sceptical moments, I sometimes think old-school empirical science took a mortal hit around the time of the Feynman Lectures…
https://www.youtube.com/watch?v=EYPapE-3FRw
…Just as mainframe computers started to proliferate. Sixty years later it’s been a digital hop, skip and jump to the “well-correlated neighbouring stations” cited in Chris Morrison’s latest excellent article showing up Met Office settled science for the feebleminded yarn it actually is.
Thanks also for the educational diligence of Paul Homewood and other citizen scientists probing away behind the scenes.
“well-correlated neighbouring stations”
It is a fundamental principle in scientific investigation that if multiple measuring instruments are to be used and their data combined, they must all be calibrated against the same, standard reference instrument whose accuracy is known. Then the error of each is the same and known and allowance made, and not compounded.
There is no common reference instrument against which the temperature instruments around the World used for “the global temperature record” are calibrated. Combining – correlating (!) – their data has an unknown, incalculable compounded margin of error.
Averaging data introduces a margin of error. Average global temperature (there isn’t one) or temperatures is meaningless particularly when claims of warming in small fractions of tenths or hundredths of a degree are made.
The truth is nobody knows with any accuracy how much global warming there has been “since records began” (1860 as the Little Ice Age ended) or in fact how much the climate system is currently warming in the context of the last 10 000 years, other than in general terms, slowly and small, irregular increments.
The only true “climate scientists” are geologists, because climate is part of the Earth’s history which can only sensibly be analysed retrospectively over long periods, and geologists are the Earth’s historians who carry out this analysis.
Understood (and far better explicitly stated than my hand-waving).
I wonder if “well correlated” means the same time? If so the wind speed across the distance must be accurately know, because this causes a correlation time delay. See my other comment, the whole process has huge error bands (uncertainty). More useless alleged data!
Thanks for the Feynman link. I winced when he mentioned ‘computers that can churn out new guesses’ – exactly the ‘science’ of models used as ‘proof’ which we’re being subjected to.
There’s a huge difference between someone who thinks scientifically and someone who can learn a bunch of scientific detail. The first has humility and conducts an ongoing quest for truth. The second arrogantly believes they’ve learned all there is to know.
Cue another quote from 60 years ago (same goes for Profs):
“It is important that students bring a certain ragamuffin, barefoot irreverence to their studies; they are not here to worship what is known, but to question it.”
Jacob Bronowski (1908-1974)
An excellent quote, demolishing that whole bogus concept of “settled science”. Real science can never be “settled”. New discoveries challenge old assumptions, and at some point everything we now believe to be true has to be re-evaluated. Do we still believe the Earth is flat? Do we still believe that all matter is a combination of fire, air, water, earth and aether? But it takes a great deal of determination to push against the inertia of accepted ideas.
The MET office is as usual mathematically inept, probably deliberately. The only scenario where intermediate data can be derived between two points is where the exact function (this may be a curve or straight line but must be both a continuous function and have a continuous second derivative) is known. As temperature with wind movements is not a function like this, the intermediate temperature profile cannot be estimated and any data is worthless. Not even class 5, worthless! I can suppose that a straight line is used, so as to not tax the brains in the MET office too much! Worthless!
More excellent work by Chris. Thank you.
The whole argument of generating ‘assumed data’ for between datapoints does strike me as a bit mad
If my house was worth £500k, but ten miles away there is a house worth £1m, does that make houses five miles away worth £750k.? Data is only as reliable as the assumptions that you make about it.
A datum is a fact assumed from direct observation. Triangulation and extrapolating/averaging from data points is not direct observation and does not produce data, it produces numbers, as does computer modelling.
When the numbers produced from this jiggery-pokery are presented with a degree of accuracy greater than the actual input data, which is the case in climate “science”, we are in the realm of the absurd and make-believe.
Consider that in some countries ‘gridding’ can be done over the distance from London to Edinburgh.
Yes JXB, but it is much worse than that, see my other comments. The gridding process is mathematically so flawed that it can only produce nonsense. I suppose if you are willing to average everything over a long time period the errors might be smaller, but as maximum temperature probably only lasts for a very short period, this is useless too!
So the MO own the science do they? Presumably this proprietory climate science is different from the science that is accessible to the rest of the world.
Well yes, we know it is different because it is not based on old-fashioned measurements but on the new, improved, presumably AI enhanced, climate modeling.
It’s based on smugness, delusion, self importance and make believe
Brilliant reporting Chris and from your sources too.
Can we please get the torpedoes in the water and sink these rusting hulks of climate measuring organisations?
Perhaps we could hack into their weather stations and recalibrate them.
I think ‘smoke’ and ‘mirrors’ is being kind the criminal ecoactivists and the Met Office – ‘bull’ and ‘shit’ might be more accurate.
Those with long memories may recall that prior to the Typhoon Record the MetO were overjoyed when a non-MetO weather station as Cambridge Botanic Gardens claimed a new record. They tried to restrain the eagerness and said they needed to check the equipment first. Note equipment and not site. And of course the equipment was fine so pop the champagne corks. Then the ordinary honest folk got to work and came up with a site rating of WMO 3 to 5.
It is interesting that they transitioned from an idea of an impending ice age to one of the planet being burned up. I remember at school it was all about the impending ice age. It is interesting how you can flip the narrative 180 degrees as if no one notices.
Another thing that seems to go unmentioned and which is yet self-evidently extremely important is the decline in insect numbers over the last few years. Virtually no one notices. That doesn’t mean that it isn’t happening. It is very dramatic and doesn’t presage well for larger creatures. Open your eyes this stuff isn’t brain surgery. Painful to look at but you have to look.
I’ve noticed it too.
True but there are enormous uncertainty as to why. With Bees it is probably disease, with butterflies it might be very wet weather. However, saying that this is due to anthropogenic climate change is ridiculous! With more greening of the Earth there ought to be more flowers and thus more flying insects, a degree of temperature change has not done this before, so why now? It might well be our mild winters have failed to kill of preditors, or allowed disease to flourish in less hardy stock. Farmers love hard winters, they kill lots of pests.
You have to tune into nature properly and listen to its woes and you can do that anywhere. You can choose not to listen but then you will bring about a constipation of the world spirit. Forget all the worldly human nonsense and have some respect for attentiveness. This makes a big difference.
All these estimates and fakery also extends to the Energy Performance Certificates or EPCs demanded when a house is sold. According to this research the consumption is overestimated and most properties are about C rating. https://www.sciencedirect.com/science/article/pii/S0378778823002542
The EPC software is far from fit for purpose, It is designed not to work properly, for example a heat pump gives extra good points!
Well done Mr Morrison.
The Met Office: Making Estimated Twaddle.