Like buses, you wait over six months for Office for National Statistics (ONS) data and then two publications come along within weeks. On February 21st 2023 it released its deaths by vaccination status data set and on Wednesday it looked at ‘COVID-19 vaccine effectiveness estimated using Census 2021 variables, England: March 31st 2021 to March 20th 2022’.
There has been lots of analysis of the February publication so today I will look at the latest ‘vaccine effectiveness’ data.
But to give you a heads-up, it’s good news – take as many jabs as you can and your life will be extended! We are witnessing the results of a miracle cure. Squirt some in the eyes of a blind man and I wouldn’t be surprised if he could see again.
According to the latest data, vaccine effectiveness against hospitalisation for Covid was 52.2% for one dose, 55.7% for a second dose and 77.6% after your booster.
Vaccine effectiveness against COVID-19 mortality was 58.7% for a first dose, 88.6% for a second dose and 93.2% for a third dose.
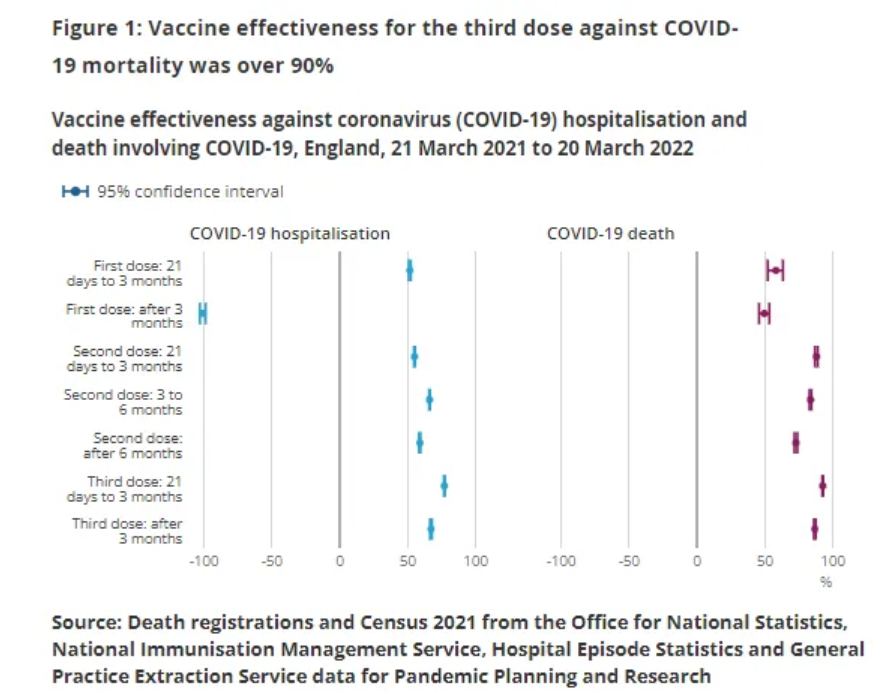
One question that isn’t addressed properly in the ONS’s publication is why are you 100% more likely to be hospitalised with Covid three months after your first dose? An obvious answer to this is that someone who didn’t go on to get his or her second dose was probably too ill to do so and so perhaps was in and out of hospital anyway. He or she may have caught Covid in hospital or the test produced a false positive. Either way, the ONS just says that this may be due to not all confounding from differences in health being taken into account. I think it should have looked at this further.
But now on to the interesting part that shows that any of its vaccine effectiveness statistics are nonsense – non-Covid mortality.
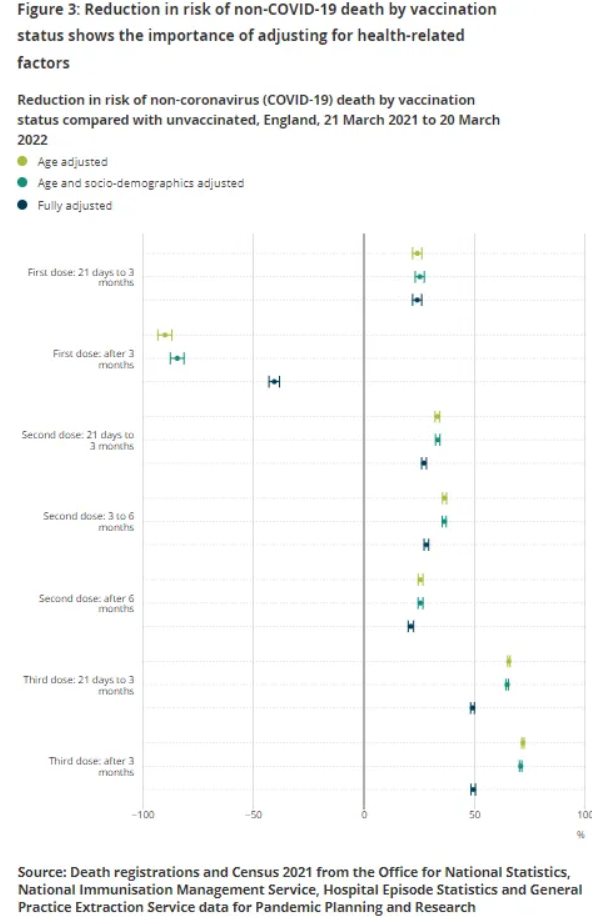
As you can see, apart from the “First dose: after three months” category, if you had a Covid vaccine you are less likely to die than those pesky unvaccinated individuals. Each group is adjusted three times. firstly by age (light green), then by age and socio-demographics (light blue) and then fully (dark blue).
The fully adjusted data show that if you have had three or more shots you are 50% less likely to die of anything than an unvaccinated person! It really is a miracle.
To be fair to the ONS, it admits as much itself. It says:
As coronavirus vaccination should not provide protection against non-COVID-19 mortality, we can use non-COVID-19 mortality as a control outcome to assess the amount of confounding left in our model. The risk of death would not be expected to differ between vaccination status groups if all confounding factors were accounted for, the vaccine has no effect on non-Covid mortality and all deaths caused by COVID-19 were accurately classified as deaths involving COVID-19… This indicated the presence of residual confounding, despite taking into account recent socio-demographic factors and different sources of health data.
The confounding factors the ONS used to adjust the data were:
- age on Census Day (March 21st 2021)
- sex
- self-reported ethnic group
- religious affiliation
- region of residence
- index of multiple deprivation
- level of highest qualification
- English language proficiency
- National Statistics Socio-economic classification (NS-SEC)
- key worker status, derived from Standard Occupational Classification (SOC) 2020
- classification
- care home residency
- long-term health problem or disability
- self-reported general health
- body mass index (BMI)
- number of comorbidities as defined in the QCOVID model
- frailty
- hospitalisation within the last 21 days
But still, even after all those adjustments, the data show the boosted are 50% less likely to die of anything, which is clearly wrong. This shows how inaccurate its data on vaccine effectiveness against Covid must be.
In the publication, the ONS also says that “given instances of adverse events are rare, we can assume that the non-COVID-19 risk of death should be similar to, or close to, zero if there is no residual confounding”.
I wouldn’t assume anything, ONS, that’s not good sciencing. You should be open to the possibility that perhaps adverse events aren’t rare and the non-Covid risk of death isn’t similar.
And finally, a little trick which we’ve all come to know and love that completely muddies the water.
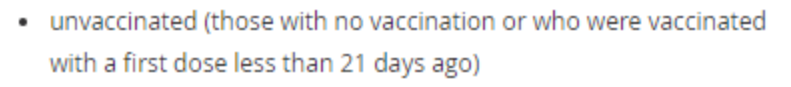
The unvaccinated group includes anyone who had a first dose less than 21 days ago. So for three weeks you count as unvaccinated even though you clearly are not. And the ONS are scratching their heads as to why the figures don’t add up!
Again, to be fair to the ONS, it has been clear that the unvaccinated group includes the under-21 days first dosers and, according to the ONS, this doesn’t apply to its February mortality statistics.
And finally, why do the data stop in March 2022 – a whole year ago? The ONS has the data up to December 2022 because it used it in its February publication. As a sceptic I would look at the excess deaths rising from April 2022 last year and wonder whether there is any connection. I have asked the Head of Mortality Analysis at the ONS, Sarah Caul, as to the reason why, so will update with the answer if she responds.
So to conclude, either we have witnessed the invention of a wonder drug that reduces your risk of dying by 50% or the stats are wrong. And if these stats are wrong, how many of the other stats are wrong? And if these stats, a year later, are wrong, how many of the stats from a year ago were wrong? You know, the ones that were used to sack people from their jobs, stop them from participating in society or travelling to other countries.
This post first appeared on the Naked Emperor’s Substack page. Subscribe here.


To join in with the discussion please make a donation to The Daily Sceptic.
Profanity and abuse will be removed and may lead to a permanent ban.
Well here’s somebody who can attest to just how ”safe and effective” the death jabs are. And wasn’t this the guy that ended up going AWOL when he got facial paralysis/GBS?
”SACRAMENTO – Gov. Gavin Newsom has tested positive for COVID-19 for the second time in less than a year, his office announced Wednesday night.
The governor has been fully vaccinated against COVID-19 and has received at least two booster shots.”
Put that in your pipe and smoke it, ONS!
https://www.cbsnews.com/sanfrancisco/news/gov-gavin-newsom-covid-19-positive-for-2nd-time/
The alleged infection effectiveness was established fraudulently. As everyone will also have experienced by now. https://www.lewrockwell.com/2023/03/joseph-mercola/how-pfizers-trials-were-fraudulent/
Pfizer Created an ‘Illusion’ of Effectiveness
In November 2020, Pfizer claimed its COVID-19 shot was 95% effective against COVID-19, but this was highly misleading and based on flawed methodology. One trick used to get this misleadingly high efficacy figure is to ignore people who got COVID-19 within 14 days after their first shot.
In Pfizer’s trial, 37.2% of those who were tested for COVID-19 within 13 days of their first shot were positive — but not counted as such.
Vs: …during any two-week period from December 28, 2020, to May 19, 2021, the COVID-19 infection rate was about 0.8%, compared to 37.2% among those tested within two weeks of their first shot.
“If people were tested every two weeks then we could reasonably conclude the vaccinated were getting infected — within two weeks of their first jab — at a rate that was almost 50 times greater than the general rate for this population,” but “if you don’t look for covid, by not testing for it, or by ignoring the test results you won’t find it.”
There is another explanation beyond ‘residual confounding’.
It might simply be that their assumptions that the entire analysis is based upon are incorrect.
For example, it might be that their population estimates are wrong. Given the high proportions vaccinated in the population for those aged 40+ even relatively low undercounting of the population can lead to very large errors in any estimates of pretty much anything in the unvaccinated population.
I note that they assume that the census is correct, while I’d suggest that lots of people don’t fill in the census forms correctly (or at all), even though there’s ‘a fine’ (for the 2021 census the number of people fined for non compliance appears to be ‘zero’; it was about 250 for 2011, so still not many).
I’d go so far as to suggest an entirely different use of this analysis.
They could ‘assume that vaccination doesn’t make non-covid risks worse’* (given correction for morbidity, age, etc), and then apply their analysis to work out what the population of the UK actually is. This would actually be a useful output for them, as population estimates appear to be a particularly difficult problem for them.
*I’m not sure that this is true, but it is probably going to be difficult to get the ONS to accept more than one inconvenient fact at a time.
I remember being a bit skint in 1971 and wangling a part time job for the census. We were given a fair amount of training. Strict instructions that on Census Day, nowhere that anyone might be sleeping was to be left unchecked. Even potting sheds and garages had to be looked at for signs of habitation. Every door knocked on and a quick check that the Census form had been correctly completed.
Compare and contrast with 2021, where people were going around boasting that they would not complete the ‘racist’ form.
It is well known that the huge variance between the Census results and those registered with the NHS makes the former numbers of very limited use.
Illegal immigrants are far more likely to want free medical treatment (and free accommodation) than to want to (or be able to) complete a census form.
And, guess what, our Beloved Leaders don’t really want them to fill them in!
Who knew?
‘And finally, why do the data stop in March 2022 – a whole year ago? The ONS has the data up to December 2022 because it used it in its February publication. As a sceptic I would look at the excess deaths rising from April 2022 last year and wonder whether there is any connection. I have asked the Head of Mortality Analysis at the ONS, Sarah Caul, as to the reason why, so will update with the answer if she responds.’
Good luck with that one!
At Christmas/New year 20/21, when the grim jabbers first started work on the most covid vulnerable members of our society (the age-frail and chronically ill; remember 2 million jabs to freedom?), spates of sudden deaths occurred in care homes all over England right after the jabbers had been in. The local papers and local TV-news programmes briefly headlined these deaths, and then – silence.
The Pfizer1 jab was quietly pulled from the upfront vaccine rollout.
Ms Caul’s UK-Deaths figures for the next 10 weeks showed 25,000 excess deaths, a massacre entirely of old and chronically ill people which shadowed the movements of the vaccineers. Yet with scrupulous diligence, the vaccination status of the deceased was omitted from death certificates.
Just take it in for a moment. News reports of adverse events were stifled. Monitoring the vaccination status of the deceased was made impossible, in an apparent official determination to suppress news of vaccine harms.
In February 2021, Dr Clare Craig and I sent an FOI to Ms Caul asking for the vaccination status data on the then recent excess deceased. Ms Caul replied that the necessary cross-referencing between the death-certificates database and the just-vaccinated database was too challenging for her staff.
Ms Caul was later awarded an MBE for all her hard work at this time.
“With four parameters I can fit an elephant, and with five I can make him wiggle his trunk”
-John Von Neumann
Apart from the conjuring of statistical epicycles and cherry picking of flawed data that would make the most brazen climatologist blush, why when the conclusions are plain wrong – even by their own admission – would the ONS publish it? I guess the answer is plain, and it paints a darker picture of dishonesty and arse-covering in favour of getting to the truth than people would imagine.
“Again, to be fair to the ONS, it has been clear that the unvaccinated group includes the under-21 days first dosers and, according to the ONS, this doesn’t apply to its February mortality statistics.”
But does it apply to its February mortality statistics?
“This doesn’t apply to its February mortality statistics”
and
“according to the ONS, this doesn’t apply to its February mortality statistics”
are not necessarily the same thing.
Given all their mistakes and flaws up to now, are we expected just to take their word for it, or has this claim been checked by any independent statisticians outside of the ONS?
The start point now must always be: they are lying.
The adjustments and allowances for that list of confounders must produce a margin of error large enough to sail, if still afloat, the Titanic through – sideways.
In other words… it’s all garbage. I wouldn’t believe ONS data or data from any ‘official source’ if it said there are sixty seconds in a minute without independent corroboration.
When the raw data is taken, a rate per million calculated, vaccinated do worst on all counts, and the more boosted the worse it gets.
“Lies, damned lies and statistics”