
Recent headlines would have us believe that 2022 was an unusually deadly year. “1,000 excess deaths each week as the NHS buckles,” boomed the Times. “Excess deaths in 2022 among worst in 50 years,” thundered the BBC. “Britain’s excess death rate is at a disastrous high,” bellowed the Guardian.
The Times article is particularly illustrative. “Excluding the pandemic years, 2022 brought the highest excess deaths total since 1951,” it claims. What’s more, “Covid accounts only for a minority of recent extra deaths” which means “the crisis in the NHS is killing hundreds of people a week”.
None of this is true. Or if it is, it’s highly misleading.
The error stems, as I’ve mentioned numerous times both here and elsewhere, from ignoring age-structure – from using the absolute number of deaths, rather than the age-standardised mortality rate. It’s the same error the media has been making all the way through the pandemic.
Like most developed countries, Britain has an ageing population. The percentage of people in older age-groups is increasing. This means the percentage of people at high-risk of dying is increasing. And when the percentage of people at high-risk of dying goes up, the absolute number of deaths rises too.
If we don’t adjust for population ageing when estimating the level of mortality, we’ll erroneously conclude that the current year was more deadly than previous years. To quote an article I wrote back in January of 2021:
Demographers typically use age-adjusted measures when comparing mortality rates over time or across countries. Simply adjusting for total population is insufficient. For example, Mexico and Japan have approximately the same total population. Although the risk of dying at any age is lower in Japan — as reflected by its higher life expectancy — there are actually fewer deaths each year in Mexico (at least ordinarily) because of its younger population.
So what happens if we look at the age-standardised mortality rate? The latest numbers for England and Wales were just published by the ONS:
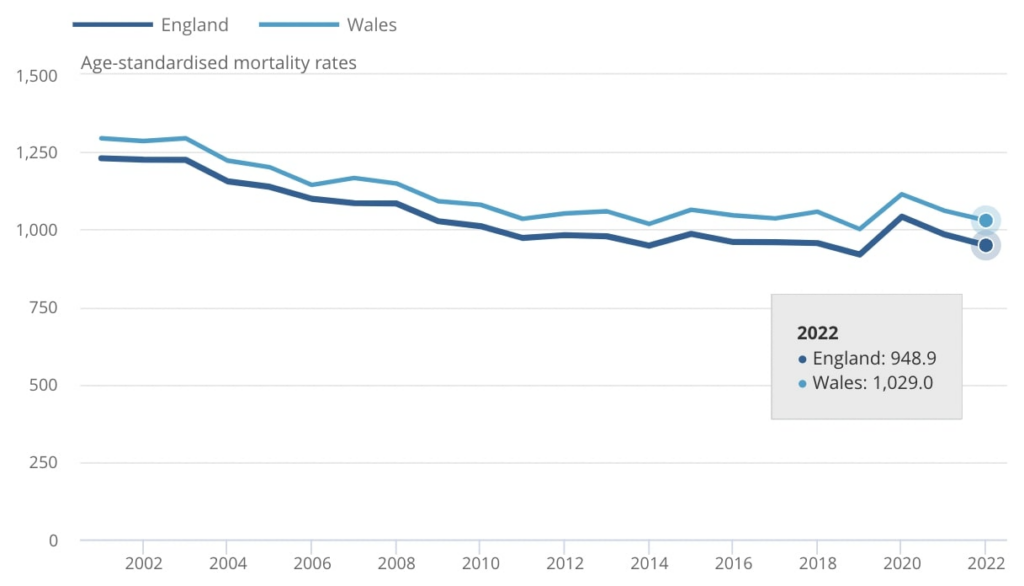
The population-weighted age-standardised mortality rate in England and Wales was 953 per 100,000. While this was higher than in 2019, it was lower than in 2021, 2020, 2018, 2017, 2016, 2015, 2013 and every year before that. In other words, 2022 was the third least-deadly year ever.
2022 doesn’t do quite as well on excess mortality – age-adjusted excess mortality to be specific. But the level recoded was far from unprecedented. Going back to 2006 (which isn’t particularly far), it had the fourth-highest excess mortality after 2020, 2021 and 2015.
Remember what the Times claimed? “Excluding the pandemic years, 2022 brought the highest excess deaths total since 1951.” We can now write our own version: excluding the pandemic years, 2020 brought the highest age-adjusted excess mortality level since… 2015.
It’s also worth noting that even though 2022 had the fourth-highest excess mortality since 2006, it was still negative: last year’s age-standardised mortality rate was lower than the five-year average from 2015–2019. Hardly cause for panic.
I don’t doubt there are problems in the NHS, but claiming it’s in “crisis” because of elevated excess deaths, when 2022 was the third least-deadly year ever, doesn’t make a whole lot of sense.
Stop Press: The Kraken isn’t all its cracked up to be. According to the ONS, the number of people infected in England and Wales declined by a third if you compare the week ending January 10th with the previous week. MailOnline has more.


To join in with the discussion please make a donation to The Daily Sceptic.
Profanity and abuse will be removed and may lead to a permanent ban.
Billy won’t be happy with this. A few people are going to be in for a rocket.
Fishy, Chunt, Witless and Vailant are up for the wagging finger. At least.
Like most stuff made in China, the virus turned out to be a load of cr*p. It takes a US/German pharma conglomerate to really fk things up.
That was quite some ‘pandemic’…….or not really.
The chart would be even more interesting if it featured the ‘pantsdown man’ predictions.
No deaths from the Jabs then ?? I’m confused 😵💫
Something unusual has been causing an unusually high number of excess deaths since June.
The jabs kill people, just not in very big numbers. Nothing big enough to be noticed in whole population stats.
They cause other damages in much bigger numbers.
How much is a matter to be investigated. All treatments and medications cause harm. Every single one. The question is how much.
Personally I couldn’t care less if covid jabs cause death or injury anymore than I care if statins or ibuprofen do. Just don’t force me or coerce me to have one.
I want to make sure they’re not pushing the Covid vaccines into my grandchildren.
Yeah, when I say I just don’t want them to force me, I really mean, I don’t want anyone to be forced, not just me. 🙂
Oh, there is plenty of that!
This article by Noah Carl is misleading because it does not mention the fact that since June there have been an exceptionally high number of excess deaths. That’s what’s worrying. A year doesn’t have to start in January. If there continue to be a higher than average number of excess deaths for the next five months, then the 12-month period from June 2022 to May 2023 will be alarmingly high.
Since June, the age-standardised mortality rate has been 5% above the five-year average. That is not “exceptionally high”, and could just be due to mortality displacement. (During the first six months of the year, it was 6% below the five-year average.) But I agree that “if there continue to be a higher than average number of excess deaths for the next five months”, then it would make sense to talk about unusually high mortality.
This is what I mean by mortality displacement.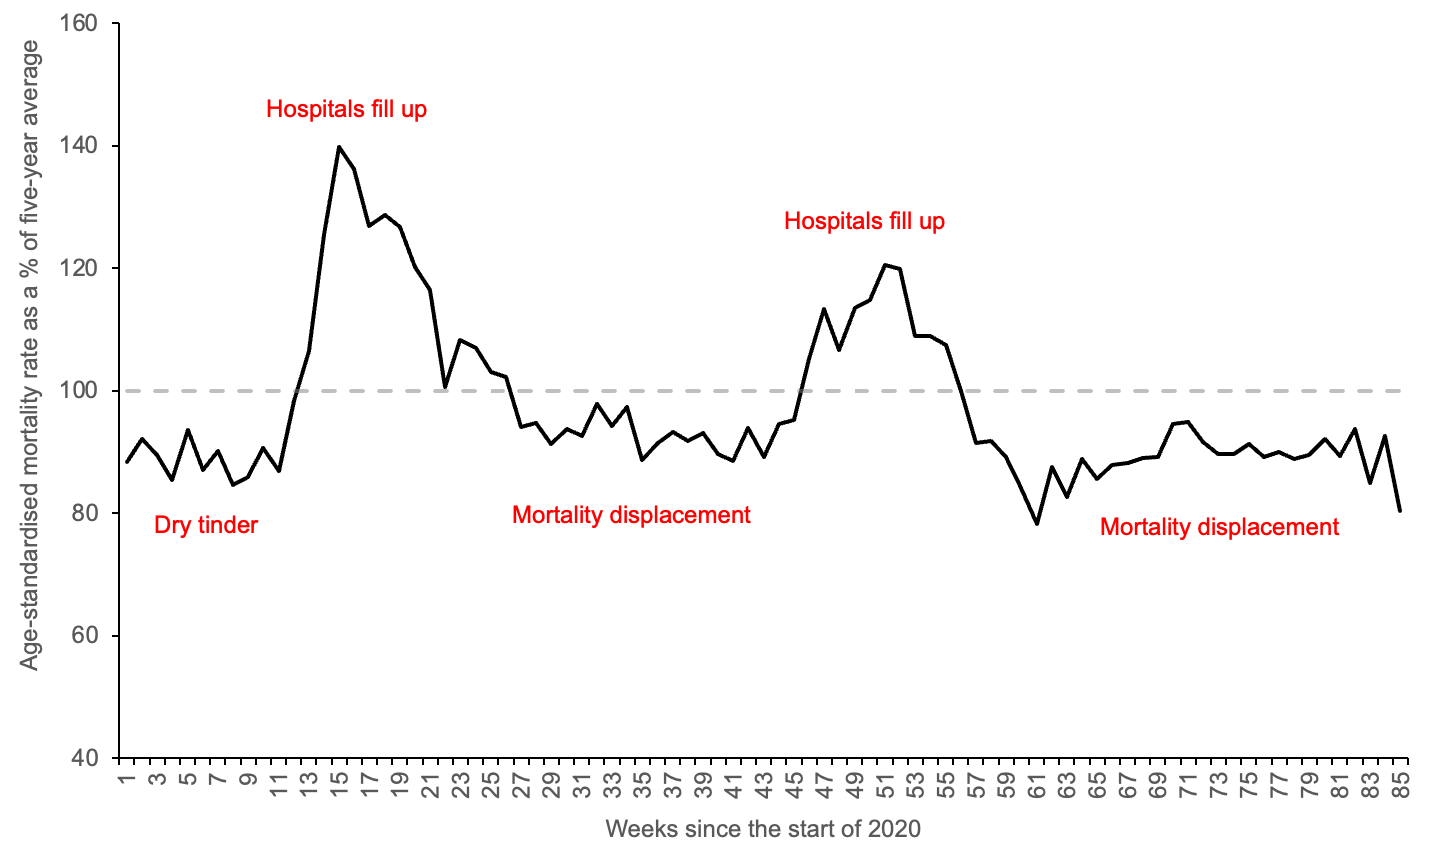
In the context of a new infectious disease 5% above average for a period of six months might not be excessively high. However, in the context of medical interventions both pharmaceutical and non-pharmaceutical that are supposed to save lives, I would argue that 5% above average is excessively high. This number represents thousands of avoidable deaths and where the cause is the injections there will be deaths that were the result of coercion and deception.
2015 had higher excess mortality than 2022, and there was no pandemic.
I guess 2015 was a bad flu year? I don’t think that applies to 2022. But even if it did, the injections might contribute to higher deaths from flu as a result of damage to immune systems. What is needed to settle this debate is all-cause mortality and other data by injection status. Governments must have this data, but they’re not publishing it (apart from New South Wales and they’ve stopped).
‘Since June, the age-standardised mortality rate has been 5% above the five-year average. That is not “exceptionally high”’
How often has the age-standardised mortality rate been 5% above the five-year average over a 6-month period?
How far above the five-year average has the age-standardised mortality rate been for people under the age of 60 since last June?
Are you saying we have nothing to worry about jab wise? And why do we keep on seeing charts on UK Column News with loads of excess deaths, are you saying they don’t exist? Sorry very confused now.
I agree with your point but we need to understand what baseline the excess is measured against. ONS provide a simplified baseline (so journalists don’t get confused) based on 5 year averages. This has worked reasonably well in the past but fails badly when we get unusually high (or low) mortality in a year. 2019 was an unusually low year. As soon as we include it in a 5-year average it magnifies anything we compare against it. ONS have made an attempt to exclude 2020 from the averages because it was unusually high but have included 2019 even though it was unusually low.
In my opinion, the only credible baseline to compare against is the recent trend(s) – say, over the last decade. If we compare 2019-2022 with the 2011-2018 trend we find that the peak in 2020 is almost balanced out by the trough in 2019. We had built up a subset of the population which we might have expected to die before the damn bug surfaced.
(The trend in ASMR prior to 2011 would reach zero deaths in England in 2047 and in Wales in 2050. Clearly, it could not continue).
If the vaccines were so deadly that they made a significant increase in the annual mortality rates people in authority would have noticed sooner. What we have is vaccines that may ‘save’ some people but do harm and kill others. Under these circumstances it is immoral to pressure people into taking the vaccine, especially children via their parents.
Excess deaths is typically calculated against an average of the previous 5 years. Why 5 years, because that’s what a bunch of stat nerds and bureaucrats have settled on.
As far as I’m concerned it’s a totally useless stat that does more to conceal than reveal, or even worse give a false sense of being informed.
Even the name is misleading. Excess deaths. As if there were a correct amount.
Mike, you make an excellent comment. I assume you are aware of the work done by Prof Norman Fenton. He has also discussed the problems of excess deaths because it is based on expected deaths and there doesn’t seem to be any satisfactory way of defining this. Now it is a problem because deaths have not been scrutinised in such detail before. Prof Fenton prefers to stick with the mortality rate but there is a problem with the total population number which he has also discussed.
When I looked at the ONS data the very low mortality rate in the years before covid stood out and I wasn’t aware of this. But why wasn’t there any analysis to find out why there was a low death rate. Did something relevant happen to cause it?
Fascinating article. I have made sure to share it on VKontakte and Odnoklassniki.
Fruitcake alert or comedy alert, hard to tell these days.
Fruitcake alert.
Those are Russian social media apps. Not fruitcakes!
Indeed they are, and the Daily Sceptic seems to be fond of them.
Actually Joel Smalley writes about this here, with a handy dandy graph to illustrate;
“The first observation from this analysis is that non-respiratory deaths show no signal in terms of excess
I’ve said it many times that the potential impact of the COVID “vaccine” to exacerbate COVID mortality (or respiratory mortality in general) is substantially more material than the other fatal adverse reactions to the jab.
Naturally, I’m not denying that these deaths exist, nor that they are very important, just that they do not manifest (yet) at the population level in terms of excess. It may be that because they affect younger people, they are being swamped by the respiratory deaths of the older ones. I haven’t checked this but there is age-stratification in the data so anyone else can take a look if they like.”
https://metatron.substack.com/p/what-does-endemic-covid-look-like
Interesting that the rest of the world is reporting excess deaths as well. Are they all making the same mistakes in reporting deaths or is the UK exempt from these trends? How many people moved into the “elderly” age range in 2021 and 2022 as compared to how many olds died prematurely in 2020 and 2021? Shouldn’t there be fewer olds than expected? And isn’t the real problem that young adults and those in their prime earning years are dying earlier than expected? Governments seemingly should worry about less potential tax revenue.
Quite. To put it as an example:
Year 1: 5% excess deaths due to an increase in mortality in 80+ year olds.
Year 2: 0% excess deaths, but triple the number of under 50s die than in Year 1.
Which year had worse mortality?
Excess deaths explains nothing.
I like to think of people being like cats in having 9 lives. At any one time there are people with 9,8… down to 1 life left.
What happened in 2020 is that covid and the response to covid in Spring 2020 (e.g. discharge to care homes and neglect of the vulnerable) and then the vaccines in 2021 caused people to all lose say one of their nine lives.
In 2022 there are still now the same proportion of people there with one life left, in particular the oldest and most vulnerable, and so death rates in those highest age groups haven’t been that high. But that doesn’t mean the vaccines haven’t caused harm.
While it’s not quite as simple as losing one life at a time; some people killed by the vaccine lost a lot of lives all at once, it does illustrate the general principle.
“And isn’t the real problem that young adults and those in their prime earning years are dying earlier than expected?”
That’s a very important point. As the vast majority of people who die are elderly, excess deaths of people of working age can easily get hidden among total excess deaths if there is not a similar increase in excess deaths among elderly.
I agree some claims of excess mortality in 2022 have been exagerated. But at the same time Age Standardised Mortality (ASM) only really tells you about rates of death in the oldest age groups as that’s where most of the deaths are. If deaths of people in their 20s had doubled (they haven’t) you wouldn’t notice it in the ASM figures. And so ASM can be cyclical in nature in that some years there are more vulnerable in the population at the oldest ages than other years and so it’s hard to judge overall trends in mortality.
Much better to look at age banded data adjusted for population in that age band.
Here is what you see in the age 15-44 age group. This reflects mainly deaths in the late thirties early forties sa not many people at the lower ages in this band die. Still some confounding by age there but not too much.
2022 has been a bad year of mortality for this age group as you can see from this chart. Mortality in 2021 was quite bad and bad again in 2022, much worse than 2020. 2022 has been about the same as 2010 but worse than years between 2011 and 2019.
And mortality in the 45-64 year old age group mortality in 2022 has again been high
2022 mortality has been slightly lower than 2020, quite a bit lower than 2021, about the same as 2010, and worse than most years between 2011-2019.
But if we look at the oldest banded from both sides age group (age 75-84) that we have ONS data for you can see what is keeping the ASM down.
And similarly in the 90+ age group.
While that age group isn’t banded from the top, in calculating ASM from memory I believe ONS make no adjustment for what the average age of people over 90 is; that is they standardise to the European population with the top band being 90+ individuals.
Correction: chart is 85+
Do we not have actuary data from the UK? I think we’re all well aware of the stats Ed Dowd and Josh Sterling have been presenting over in the US, as well as the so-called “Great Resignation”, which is meant to be a cover for working age people actually dying or becoming sick/disabled as opposed to going off to ‘find themselves’. So what is the data from life insurance companies in the UK in comparison? One would expect it to be similar to the US if the jabs were truly to blame for people leaving the workforce.
I don’t personally know anyone who has died due to the Covid vaccines but I know three people who have been quite seriously and (so far) permanently damaged by the vaccines, which is a very high proportion of all the people I know well enough to know if they’ve been damaged by the vaccines or not.
My experience may not be representative, but it causes me to wonder.
Among the stats that I calculate are the cumulative deaths in 2022 since 1st April 2022. This is when the spring booster was rolled out. Overall, there is an 11.3% increase in deaths over the average, population-corrected, mortality for the same period in 2010-2019. This is not age-corrected.
How about looking at this age group by age group? It is consistently above average in most cases. Of course, the higher age groups contribute more towards the total, but one cannot deny the increase across the board.
I also show the extreme maximum above average figures for 2010-2019. I call these ‘extreme’ because they take the individual weekly maxima rather that the year total. I could do some fancy work averaging groups of weeks out, but ‘extreme’ maxima will do for the moment. Overall, the ‘extreme’ maximum is 7.4%. 2022’s maximum is 50% above the 10 year maxima. I regard that as signficant.
Note that, until the spring booster, deaths for 2022 were average. Because there was an upturn after this data, it prompted investigation. Using the complete year, it is 8.4% above average with a similarly consistent above average mortality in each age group. This would put 2022 on a par with the maxima of 2010-2019.
The trend is clear. The latter half of 2022 is worse than the latter half of 2021, which is worse that the latter half of 2020. And we all know what started in 2021. Furthermore, things are getting worse recently. Whereas we have had many early adverse reactions, we may now be seeing the mid- and long-term reactions kicking in. Whether this is definitely due to the jab may be difficult to prove. However, the net result of all counter-measures to this hoax pandemic has been disastrous to the nation’s health.
I would be interested to hear Dr’s Heneghan and Jefferson’s views on this.
‘Age standardised mortality’ doesn’t mean what many people think it means.
People, for some reason, think it is a compound measure of death rates that takes into account the age of those that die.
It isn’t. It simply adjusts the death rates so that they’d be what you’d get if you had a population with a ‘standard’ age profile.
As the majority of deaths occur in the elderly then the ‘age standardised mortality’ will be mainly defined by deaths in the elderly. This ends up masking what might be important changes in mortality rates in younger age groups.
To give an indication of the scale of this masking effect, you could increase the death rate in those aged under 40 by tenfold and it would barely be noticeable on the age standardised mortality figures.
This makes age-standardised mortality fairly useless as a measure of the ‘healthiness’ of a country’s population — indeed, I don’t really know why it is discussed at all (other than in scientific/medical conferences, etc).
Exactly – and my table above demonstates this. ONS and other government agencies have a track record of masking or obfuscating data around this so-called ‘pandemic’. They have an agenda.
Anyone on DailySceptic quoting data manipulated by government as presenting the truth of a situation are just setting themselves up as an aunt Sally here.
I can’t believe N Carl is unaware of this. What’s he playing at!
I am a total ignoramus on statistics but what Noah is saying seems completely at variance with what an awful lot of very well-qualified people are saying, eg Dr Malhotra on GB News in a link at the end of the News Roundup links in today’s DS email.
John Beaudoin Sr has been looking into deaths in Massachusetts by going to the source data of death certificates, looking at the cause of death & then identifying a VAERS entry. What he has found from the raw source data is that the cause of death has changed since the introduction of the bioweapon injection. Prior to its introduction the majority of deaths in 2020 were respiratory. Post introduction the majority of deaths changed to disorders of the blood. This is hard, irrefutable data which is unrelated to age demographics.
John’s work can be perused at his substack & a presentation on this found on rumble
https://coquindechien.substack.com/
https://rumble.com/v1uhm0w-john-beaudoin.html
Very confused article here going against the well established data from across the world showing excess deaths linked to vaccine roll out. Is the author trying to say that the mRNA injections are safe now?
The article ignores the hugely elevated mortality/injury claims against ‘Death In Service Benefits’ policies as announced by many insurance companies in USA and Europe. Typically these policies cover in-work individuals in the 18-60yrs age group. Mortality rates in this age group are generally significantly below the general. In 2021 they were very significantly greater and the indications are that 2022 will be similar. Back to the drawing board, Noah?
Dr Clare Craig does’t agree either….
If it was an aging population that was resulting in this excess there would be excess diseases of old age e.g. Alzheimers and Parkinsons.
There aren’t.
The deaths are all cardiovascular and are also too high in the young.
It isn’t just the media, Dame Sarah Gilbert did the same thing in the Richard Dimbleby lecture she gave saying something like the deaths were higher than at any time in the last century. Not a specific reference to the Spanish flu epidemic but we got the message. Of she was right when using the total deaths because of the increasing population, but wrong when deaths are normalised. Not one of the supposedly intelligent audience correct her. It was deliberately done to generate fear and sell vaccines.