
Whisper it quietly, but Arctic ice is making a comeback. The coverage is now very close to the 1991-2020 average, well above a 2012 low point and higher than 2020. According to the latest report from Copernicus, the EU’s Earth observation programme, the 2021 March sea ice extent was just 3% below the 30 year average. March is the annual maximum extent of sea ice in the Arctic.
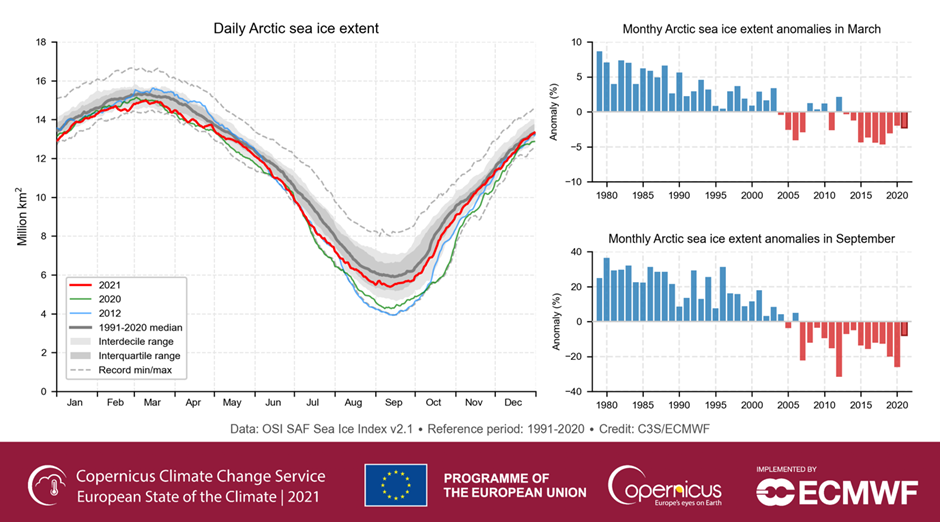
The red line on the graph on the left plots the 2021 record and it can be seen that it is an improvement on recent years. Deviations from the average in March and September shown on the right have both eased in recent years. Of course in historical and geological terms these changes are insignificant, but they are likely to put a dampener on the generally hysterical tone about polar weather encountered in most climate change debate. This tone was set back in 2009 when former US vice president Al Gore reported there was a high chance that the North Pole would be summer ice free by 2013. So far as climate catastrophism is concerned, the Arctic is the gift that keeps on giving. Discussing a crackpot scheme to ‘save the Arctic ice’ by sprinkling it with glass, the BBC Future Planet site noted in 2020 that the area was in a “self-destructive feedback loop”. Much of the ice was said to be “rapidly vanishing”.
Back in less feverish times, the president of the British Royal Society reported to the Admiralty in November 1817 as follows:
It will without doubt have come to your Lordship’s knowledge that a considerable change of climate, inexplicable at present to us, must have taken place in the Circumpolar Regions, by which the severity of the cold that has for centuries past enclosed the seas in high northern latitudes in an impenetrable barrier of ice has been during the last two years, greatly abated … This affords ample proof that new sources of warmth have been opened and give us leave to hope that the Arctic Seas may at this time be more accessible than they have been for centuries past.
The geological record shows that the Earth has often been ice free, but present day alarmists concentrate on the rate of change. However, the historical record suggests similar rates of change were not unknown in the near past. The Royal Society president went on to report:
Mr Scoresby, a very intelligent young man who commands a whaling vessel from Whitby observed last year that 2,000 square leagues [a league is three miles] of ice with which the Greenland Seas between latitudes of 74° and 80°N have been hitherto covered, has in the last two years entirely disappeared.
Around the turn of the 19th century there was a great deal of trade, fishing and scientific observation around the Arctic. Britain’s expanding empire was looking for new sea routes. Attempts were started to find a Northwest Arctic passage. As a result of all this activity, we have evidence of substantial melting of Arctic ice before and after 1817. There are suggestions that the ice returned in later years, only to retreat again.
This pattern seems to have been confirmed by a group of Canadian scientists who complied over 25,000 records from the early 1800s for east Newfoundland and the Gulf of St Lawrence.
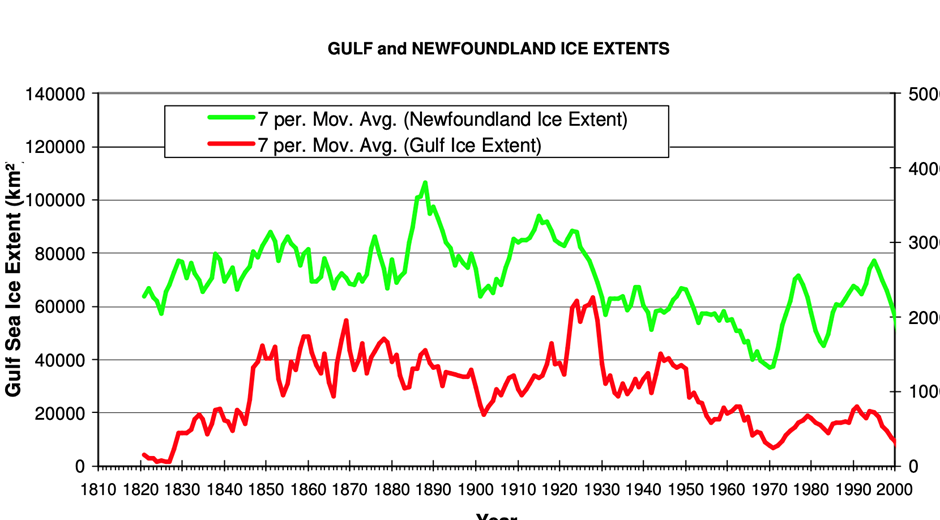
The graph above shows the low extent of sea ice in the early 1800s, suggesting that the observations reported at the time to the Admiralty in London represented conditions in the wider Arctic area. The subsequent increases are also confirmed by the graph. Lighter amounts of ice seem to have been a feature since the 1930s, a process that started before the onset of mass industrialisation and increased use of fossil fuel.
In February, the Daily Sceptic published an article entitled “The climate fairytales Boris was told at his Net Zero re-education briefing“. The schooling was headed by the Government’s Chief Scientific Adviser Sir Patrick Vallance and took place in January 2020. It featured a number of extreme weather scares and junk science cherry picking, while a short record of Arctic sea ice was headed a “tipping point”. The meeting seems to have converted the Prime Minister to the green activist Net Zero agenda. By the end of 2021, he was telling the COP26 meeting that there was just “one minute to midnight” on the doomsday clock.
Back in the real world, Emeritus Professor Ole Humlum in his recent GWPF climate report noted: “The trend towards stable or higher ice extent at both poles probably began in 2018 and has since strengthened”. GWPF director Dr. Benny Peiser added that it was extraordinary that anyone should think there is a climate crisis. Little has changed over the last 30 years. “The habitual climate alarmism is mainly driven by scientists’ computer modelling rather than observational evidence,” he added.
Make that 200 years for Arctic ice. Sometimes there is a lot of it, sometimes much less. About 20,000 years ago, thick ice covered much of Europe. It’s called coming out of an Ice Age.
Chris Morrison is the Daily Sceptic’s Environment Editor.
Postscript: This article has been fact-checked by Reuters, who quote several climate scientists disputing its claims. You can read that fact check here and Chris Morrison’s response here.


To join in with the discussion please make a donation to The Daily Sceptic.
Profanity and abuse will be removed and may lead to a permanent ban.
Naturally this will be headline news on the biased been bee see
Fake news. It will have to be fact checked and filed under ‘inconvenient truth. We can’t let direct observation contradict the model.
No!
Historical data should not be used, we all know history is full of racism.
It is clearly due to lockdowns, and people not breathing out their carbon due to face masks being worn over the last two years!
Stupid article, full of facts I disagree with, get a grip!
*This announcement was sponsored by XR and HM government/WEF, no penguins were harmed in the making of this statement (that you know of)
You are correct, ice is definitely racist as it is white and anything white is inherently racist.
No!
I’ve just checked on Facebook fact check and it says your statement is false!
Ice can’t be racist, because it’s gender neutral and it mixes well with coke!
But snowmen are racist bigots, and you are a homophobe Facist!
*This announcement was sponsored by XR, HM government/WEF, and the Coca-Cola company™ no Mongolian nose flute players were harmed in the making of this statement.
Was the snowPERSON pregnant?
Anyway, I thought that snow was a thing of the past and only existed on Christmas cards.
I slipped on some black ice once!
Ha, clearly reparation for stepping on it!
Did it hurt your white privilege?
Nazi!
*This announcement was sponsored by BLM, HM government/WEF, and Apple™ (Naz-i is a registered trademark)
A clear example of White Fragility.
Arrggghhh! You can’t say that!
Actually, due to lots of belching chimneys in various countries, ice has become increasingly darker in colour. It’s what causes more of it to melt for a given level of incoming radiation – the black box theory of heating.
OMG. Not that old bullshit again.
There are no penguins in the Arctic which is why none were harmed.
Love these posts Chris! Thanks to you and the DS for supplying them. Facts to fight off the fairy-tales are very useful.
Apparently the HadCRUT team have a lucrative new sideline erasing people’s incriminating Twitter timelines after Musk’s takeover. Their tagline is ‘making inconvenient historical data disappear for over 20 years’
Climategate.
It must be caused by the reduction in ice cube usage when they closed down all the pubs because a few people got a cold. Now they’re back open the ice will quickly reduce again. We need a climate crisis lockdown.
Ok, yes, but this is hardly the point surely. Snow and ice are white. Do you see the problem?
Arctic ice is not “rapidly vanishing.” The truth is.
Surely, “An(other) Inconvenient Truth” …. maybe Al Gore can update his documentary – I’m sure he’d be keen.
The climate goon Wadham’s assured us it would all be gone by
2012,2013,2016…..SQUIRREL!!!!!!The news is now modelled by the MSM.
Is Vallance an expert on every scientific endeavour? One year he is an expert on coronavirus’s, then he is an expert on climate science/studies.
He must be the most qualified scientist on the planet having spent years at universities studying medicine, immunology, geology, astrology, computer science, and presumably he also spent several years at veterinary school.
You missed Mythology in mystic megs class
He got a BShit 2.2
Currently reading – Waffle.
Theatre for the Gullible
The West End run of ‘I May Be a Lying Twat But I am The Prime Minister’ came to an abrupt end despite rave revues
The theatre is now showing the Mail’s new adaptation of ‘Show Me Your Clodge’
Equally popular plays at the moment are ‘Porn in the Commons’ and ‘Anonymous Allegations’
Then again I suppose those who own the theatre decide what the plebs get to see
They are behaving like children. It’s humiliating.
My best mate travelled from Australia last week and after he was here for a week said to me “fuck me mate, we thought our Aussie pollies were bad, your lot take the biscuit though”.
What people should understand is that the density of sea ice to be included is just 15% – ie 85% open water. As such it is subject to the vaguaries of the prevailing wind. So wind from the south will compact sea ice and wind from the north will push it out into the Pacific and Atlantic, and severe storms will break it up.
Similarly when the ice refreezes the sea and wind conditions determine how densely the ice packs and thus how quickly it will thaw in springs.
The quoted extent has pretty well nothing to do with global temperatures that vary by hundredths of a degree each year.
It’s it odd that even the sceptics start their graphs from a known ice maximum?
And compress the axis so an inch looks like ten feet.
With respect to the first part of this article. The Copernicus chart makes it quite hard to see the trend in Artic sea ice extent. I think this one makes it clearer which can be found here. Of course sea ice extent is not the only factor in the amount of sea ice – thickness is just as important but much harder to measure.
An interative graph of historical sea ice extent can be found here alowing you to compare sea ice extent since 1979.
https://nsidc.org/arcticseaicenews/charctic-interactive-sea-ice-graph/
I came across that chart when looking up the one I displayed. It is very clever but I found it hard to use it to illustrate the trend over time.
Translation:
“I couldn’t get that chart to show the world is going to end so I dragged out a 10 year old paper to convince people I have a clue what I’m talking about.
You are a complete loser.
Having dribbled on about sea ice extent for the last 50 years, suddenly thickness becomes an issue when you’re proven to be congenital idiots once again.
Every single time evidence is brought to refute your continual nonsense, you concoct something else out the blue to wring your hands over.
If sea ice thickness is more difficult to measure then how do you know it’s even an issue?
From your useless article of more than 10 years ago, if you check the data, sea surface ice was in decline – slightly, therefore sea ice thickness could reasonably be expected to be affected.
Now sea ice is once again expanding because – it’s colder!!!!……Sea ice thickness could be reasonably be expected to increase as well.
You really are a pathetic specimen.
I am getting a bit tired of being abused. But one more try ….
Having dribbled on about sea ice extent for the last 50 years, suddenly thickness becomes an issue when you’re proven to be congenital idiots once again.
Thickness has always been an issue- why wouldn’t it be? Volume = area * depth. Surely you are not sceptical about that calculation?
If sea ice thickness is more difficult to measure then how do you know it’s even an issue?
Of course it is an issue for just the reason that volume = area * depth. Just because you can’t measure it doesn’t mean it doesn’t matter.
From your useless article of more than 10 years ago,
Presumably you are referring to one of the articles referenced in the link I gave on sea ice thickness. There were five articles:
(Rothrock et al. 1999).
(Kwok and Rothrock 2009).
(Laxon et al. 2013)
(Ricker et al. 2014)
(Kwok and Cunningham 2015)
The last three are all less than 10 years old so I am guessing you meant Kwok and Rothrock. I wonder how you know it is useless? Have you read it?
if you check the data, sea surface ice was in decline – slightly, therefore sea ice thickness could reasonably be expected to be affected.
Extent and thickness are not necessarily related. Thickness develops over years, extent is an annual phenomenon.
Now sea ice is once again expanding because – it’s colder!!!!……Sea ice thickness could be reasonably be expected to increase as well.
That is not at all obvious.
Neither sea ice thickness nor sea ice extent can be used as a proxy for global temperatures (can anything). They are both influenced by a range of other factors including prevailing winds, storms and cloud levels.
It rather depends what you mean by a proxy. You can’t work out the global temperature by measuring the Artic ice extent. But, while there plenty of other factors affecting ice extent, temperature obviously has to be a significant factor. So decreasing ice extent is evidence for warming.
Actually I think even the temperature records (surface and satellite) are best conceived as particularly strong evidence of global warming rather than definitive measurements. There are whole raft of different lines of evidence (e.g. sea ice, changes in timing of seasons, various surface temperature measurements, the two satellite lower troposphere measurements, cooling of stratosphere) which, while each one may disputable to some extent, together amount to an overwhelming case.
Cheers
I will concede that satellite temperature are probably the most reliable and consistent. Surface measurements are all subject to sparsity of siting, creeping urbanisation and regular adjustment and are generally only relevant to the N hemisphere, mainly Europe and N America. Temperatures measured at airports are particularly misleading.
The process of calculating “global temperatures” by gridding(1200km square grids) is IMHO fraudulent. All the other effects you mention are anecodotal or influenced by many other factors than temperature.
So going back to satellite measurements, they have started to trend downwards.
Well this debate could go on for ever.
This link:
https://www.carbonbrief.org/explainer-how-surface-and-satellite-temperature-records-compare
explains the many problems associated with the satellite record and I go with the conclusion:
Arguments over which is most reliable – the surface or satellite record – is perhaps beside the point. Neither gives a complete picture of climate change, only a snapshot of one element of it.
Here is Spencer’s latest diagram of his version of the satellite record. You have to be pretty imaginative to call that trending downwards. I believe the RSS analysis of the satellite data will show even more of an upward trend but I can’t find it right now.
I can’t understand why gridding should be fraudulent. It is well established completely public process. Mistaken maybe, but fraudulent?
Anyhow, I know I am not going to persuade you so I will leave the topic.
Say it even more quietly, as the Arctic Sea Ice recovers, Antarctic Sea Ice starts retreating from historical maxima.
When will the world focus on total global sea ice (which is after all what matters)?
Antarctic sea ice has shown little change since 1980 (I don’t know what happened before) – sometimes up, sometimes down. However, Antarctic ice mass (remember much of it is land) has steadily decreased over the last 15 years (i.e. since we have been able to measure it).
Actually it is melting land ice that matters most – melting sea ice does not affect sea levels, melting land ice does.
Except that a NASA study from 2015 showed mass increasing https://www.nasa.gov/feature/goddard/nasa-study-mass-gains-of-antarctic-ice-sheet-greater-than-losses.
How confusing.
Have any of the climate zealots ever got a prediction right? We seem to have had now 50-60 years of utter nonsense. Maybe get a few right first and then we’ll have another look. How many zoos wasted money building polar bear santuaries?
In answer to your question. No.
Arctic ice and the Great Barrier Reef are really taking their fkn time about vanishing forever, aren’t they?
Burn more coal!
Oh wait, the Chinese and Indians that have scientists who aren’t in the least bit worried about the climate are doing just that.
US department of energy.
IPCC first report
And together
All their “truths” are “lies “.
What’s the difference between Snowmen and Snow-women?
Just as forty years of Climate Change propaganda convinced hundreds of millions of gullible half-wits to believe mankind has any significant impact upon global atmospheric temperatures, so it became easy to convince those same idiots of the existence of a deadly pandemic and that they should take useless dangerous fake ‘vaccines’.
Hilarious, really.
It’s beyond parody that Vallance is the Government’s Chief Scientific Adviser, An incompetent promoted to even higher levels of incompetence. Why would anyone listen to him after his disgraceful performance during the pandemic, I wonder who he really works for, it clearly isn’t the British government.
How much more evidence do we need to disprove the “global warming” nonsense? All the evidence against it adds up to confirm that it is driven by government policy derived from Boris’ globalist mates rather than real evidence.
We need rid of his corrupt government and its replacement by one comprised of true Brits. That needs to apply to the Civil Service as well as elected politicians.
We haven’t come out of an ice age, Chris, we’re actually still in it as the World has ice-caps. We are merely in a warm inter-glacial period which started about 11 – 12,000 years ago and may end in about 29,000 years or 87,000 years depending on which of the Milankovitch cycles is dominant.
”Fake invisible catastrophes and threats of doom” by Patrick Moore, someone who knows a lot about that of which he speaks. All we need to know in one easy and fascinating read.
Seconded. Along with RFK jnr’s “The Real Anthony Fauci”.
It amazes me the amount of ignorance in this community. If ice melts in a glass the level doesn’t change, and neither would sea levels change if the artic caps melt. Roughly 90% of ice is submerged and the remaining 10% remains above. The density of ice is relatively the same everywhere as it’s a crystalline structure and it only slightly varies based on temperature (0.00003 g/cm^3 per deg. C which is negligible).
While we are on this subject, the level of the ocean isn’t raising. Any honest civil engineer or geologist should recognize that most all soils compress over time. One method to prepare a site with poor soil for building is to surcharge it, which is add a pile of dirt to speed up the soil consolidation process. This simple principle explains why the ocean level appear to increase by different elevations depending on your location around the world (otherwise how do you explain this difference as gravity is constant and is the exact same everywhere at sea level.)
So, to be clear, it is reasonable to assume that nearly everywhere on the earth’s surface the soil is compressing albeit at different rates. There is no benchmark on land that is perfect and rather the best benchmark for elevation differences is probably the ocean level.
Now, enough with all the links to some “expert (idiot’s)” article who cherry picks statistics, ignores the data which disqualifies their hypothesis, and then publishes some B.S. Turn off the media, take a physics class, and try thinking for yourself!