

We’re publishing a guest post by a blogger calling himself “eugyppius” about the frantic attempts by the UKHSA to renounce its own data showing infection rates are higher in the vaccinated than they are in the unvaccinated. This post was originally published on eugyppius’s Substack account, which you can subscribe to here. Highly recommended.
Vaccinated vs. unvaccinated case rates in the United Kingdom, from the latest U.K. Health Security Agency vaccine surveillance report:
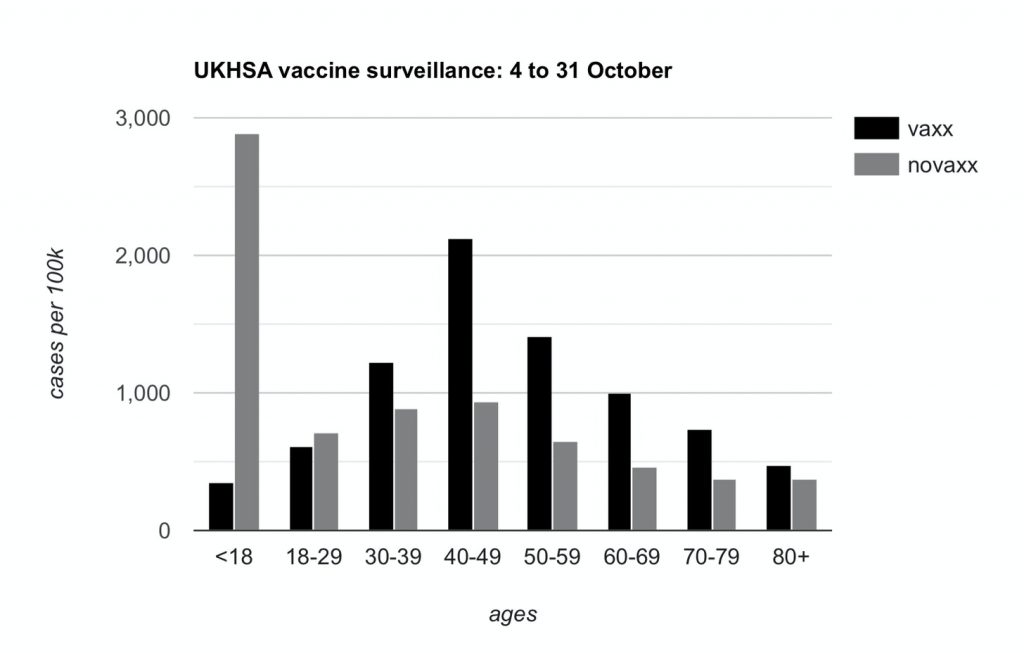
Yet again I had to draw this graph myself, and yet again, the U.K. Health Security Agency wants you to know that these rates are extremely, totally, absolutely unadjusted. They just don’t know precisely why or how.
As I noted on Twitter, it’s emerged that UKHSA inserted all of their ill-advised disclaimers after coming under fire from the Office of Statistics Regulation, a regulatory body which periodically complains about statistics published by the British Government.
OSR director Ed Humpherson met with UKHSA hours before they published their Week 43 report, demanding they do something about these awkward graphs. They responded by ditching the graphs altogether and calling every last number unadjusted. This failed to satisfy him, so in the days afterwards he issued this unbelievable open letter.
Dear Jenny,
COVID-19 vaccine surveillance statistics
Thank you for the constructive meeting on Thursday October 28th to discuss the UK Health Security Agency’s (UKHSA) COVID-19 vaccine surveillance statistics. We focused on the risk that the data presented on rates of positive cases for those who are vaccinated and those who are unvaccinated have the potential to mislead – and indeed we noted that these data have been used to argue that vaccines are ineffective.
We welcome the changes you have made to the Week 43 surveillance report, published on October 28th. It is also very good that you are working closely with my team and with the relevant teams in the Office for National Statistics (ONS).
The U.K. has backed itself into publishing some less-than-useful numbers. Now the office responsible for this publishing will have to work closely with a gaggle of political commissars, responsible for cleansing official discourse of anything that might be “used to argue that vaccines are ineffective”.
Because he appears to be a genuinely stupid man, Humpherson spells this point out explicitly:
It remains the case that the surveillance report includes rates per 100,000 which can be used to argue that vaccines are not effective. I know that this is not the intention of the surveillance report, but the potential for misuse remains. In publishing these data, you need to address more comprehensively the risk that it misleads people into thinking that it says something about vaccine effectiveness.
Emphasis mine. The next time somebody tells you that UKHSA reports show substantial protection against severe outcomes, draw their attention to Ed Humpherson’s letter. He thinks these numbers don’t tell you anything about anything. This is the first step towards not publishing them at all.
This is not just about the choice of denominator. It is about recognising that the comparison of case rates for vaccinated and unvaccinated groups is comparing datasets with known differences – including, potentially, the greater propensity of people who are vaccinated to come forward for tests. So the data reflect a behavioural phenomenon, not just a feature of how well vaccines work. I do not think your surveillance report goes far enough in explaining this crucial point.
Emphasis mine again. Humpherson has no idea what behavioural factors might be at issue. He is just throwing random ideas at the wall here. And notice how he slithers from what is “potentially” true to totally unqualified and unsupported assertions about is true (“the data reflect a behavioural phenomenon”). Maybe the higher unvaccinated death rates also “reflect a behavioural phenomenon“ and are “not just a feature of how well vaccines work”. As long as we are allowed to speculate baselessly, let’s do it in both directions.
He goes on to voice the old and tired complaint about the NIMS data. He wants UKHSA to use ONS population estimates instead. While the former might well understate the case rate among the unvaccinated, the latter is sure to overstate it, but Humpherson doesn’t care.
One possibility would be to only publish rates in the vaccinated population, which are known accurately, but I recognise your concern that you are already publishing rates for both groups.
Confirmation yet again of the obvious: They are only publishing these numbers because they locked themselves into doing so early on, when they looked good.
The alternative would be to use the ONS population estimates, which are used in the main coronavirus dashboard but which may be flawed for some age groups, as you have pointed out. … In the meantime, you should consider setting out these uncertainties more clearly, including by publishing the rates per 100,000 using both denominators, and making clear in the table, perhaps through formatting, that the column showing case rates in unvaccinated people is of particular concern.
That column is of particular concern because Humpherson doesn’t like the numbers in that column. He doesn’t care about the other columns because those numbers are neutral or pleasing to him.
And he closes with this:
I recognise that you want to maintain transparency and consistency, but these qualities should not be at the expense of informing the public appropriately.
Remember, always, that all Corona statistics are propaganda.
The UKHSA have issued a separate set of disclaimers on their website. Every line is fairly hilarious. And the Office of Statistical Regulation provides their own wall of text, where they show that if you understate the unvaccinated population with ONS numbers, indeed you can get the unvaccinated case rate to go up. Humpherson and his crack team of statistics regulators just love the ONS numbers, but UKHSA don’t like them so much. This is because UKHSA actually have to compile minimally plausible tables and for this they are unworkable. From p.15 of the Week 44 report:
When using ONS, vaccine coverage exceeds 100% of the population in some age groups, which would in turn lead to a negative denominator when calculating the size of the unvaccinated population.

Discussion
Comments
This week across the site:
To join in with the discussion please make a donation to the Daily Sceptic.
Profanity and abuse will be removed and may lead to a permanent ban.
One blogger said …
and who looked at the real statistics?
Yes, there are a few more cases, but this blogger modestly missed the fact that there are ten times fewer hospitalized. And there are also ten times fewer deaths.
Why be surprised that the virus spreads through vaccinated people? it’s a virus. Vaccination helps to protect against it, and does not become an impenetrable dome.
Listen less to some bloggers who, for the sake of hype, are ready to tear their ass off in order to give a shit in your brain as much as possible. Check all the data yourself.
Classic straw man. It is the overall (vaccinated plus unvaccinated) death rate that is important. Not the vaccinated vs unvaccinated infection rates. The vaccines are not sterilizing immunity vaccines and were designed to lower the impact of the disease. The death rate among the unvaccinated is much higher for the vulnerable population than among the vaccinated ( data online).
https://www.factcheck.org/2021/11/scicheck-why-its-easy-to-misinterpret-numbers-of-deaths-among-the-vaccinated/
“Consider the hypothetical world where absolutely everyone had received a less than perfect vaccine. Although the death rate would be low, everyone who died would have been fully vaccinated,…”
““As the number of people vaccinated in a population grows, we expect to see relatively more deaths in the vaccinated. This ‘base rate’ phenomenon can make it hard to interpret the data,” Natalie Dean, assistant professor in the Department of Biostatistics & Bioinformatics at the Emory University Rollins School of Public Health, told us via email. “It doesn’t mean the vaccines aren’t working well against deaths (they are) but just that the vast majority of vulnerable adults in the UK have been vaccinated.”
How can the death rate among the unvaccinated be higher than among the vaccinated in the USA if the above is correct ?
Doesn’t the comment contradict itself ?
No. It depends on the vaccination rate.
“As the number of people vaccinated in a population grows, …..”
In response to James’ comment that natural infection produces better immunity than vaccination, that it generally agreed (I do). Our local experience is, however, that a recent spike was generated by an event attended by almost universally vaccinated people – in a closed room, maskless and singing. In the absence of a proper strategy for identifying people with SARS-CoV-2 and treating them when they progress to Covid-19 I would like to reduce that risk of progression. Vaccination does not eliminate the risk, but the figures for hospitalisation and deaths do suggest that it reduces it a lot. Good enough for me.
I understand that. But the problem is vaccine-induced immunity wanes very quickly. Do we really want to inject people with mRNA every 5 months? There is growing evidence that such a policy could adversely affect immunity and have other detrimental effects. It is not a risk I would want to take.
But the regime wants to do this to us.
Do they have the resources to administer, overall, five jabs every 12 months to 68 million people? 340 million jabs per year, give or take a few million.
This may be as many as the number of repeat prescriptions, and possibly more than doubles GPs’ workload
https://www.bma.org.uk/advice-and-support/nhs-delivery-and-workforce/pressures/pressures-in-general-practice
Note: I have used the word ‘regime’. 10 Downing Street arguably isn’t a government. Democracies have governments. In the past places like Latin America, Asia and Africa had regimes.
Lord Sumption said that these laws are tyrannical and should not be obeyed. They are not the creation of a governmment.
“And if all others accepted the lie which the Party imposed — if all records told the same tale — then the lie passed into history and became truth.”
George Orwell
This excellent piece demonstrates the nonsense of basic decisions on statistics when the susceptibility of any individual of contracting any infection and the subsequent morbidity is so polyfactorial that it is only prospective controlled studies are useful.This journal has maintained the necessary skepticism to permit rational thought. As Lord Moynihan once opined / / – ever individual is their own unique experiment,
Our leaders are devoid the intellectual scientific education to permit them to understand even the simple basis of the infective process,
Where are the publications on vaccine morbidity is the US VARS data and our card system wrong!
Irrespective of the data on efficacy or should I say lack of efficacy of these vaccines, the fact is that other very serious illnesses are rising in the vaccinated. Dr Ryan Cole in the US talks about how he and many colleagues are seeing 20x more cancers and that is just for starters. And no not due to lack of healthcare during lockdowns because the incidence is higest in the vaccinated. I know of several whose cancers have now returned- since being jabbed- and I do not believe it is a coincidence. Drs (again in the US) have shown that these vaccines detrimentally affect the immune system. They have shown the blood test results and videos of what they are finding. So I just cannot fathom why anyone in their right mind would take an injection that has a decent chance of increasing a liklihood of what is a serious chronic illness v what is in reality a very a mild respiratory type illness for well over 99% and is in fact both treatable and preventable if you take the right steps. And we are only at the start of all this and have seen nothing yet… There is no… Read more »
I have never been able to understand how a vaccine prevents infection with a respiratory virus. A vaccine provokes the body into mounting a systemic immune response so that if a virus does get in, it will generate a better immune response than in an unvaccinated person. In other words, the virus gets in but is too rapidly neutralised to do anything nasty. So rather than being surprised that the infection rate is higher in vaccinated people we should look for a simple explanation – like vaccinated folk have decided they are now safe, so have dropped their guard with precautions, while the unvaccinated are maintaining theirs. Or some other explanation. But if you think that a vaccine somehow bounces a virus out of your mouth or nose when you inhale, or sits on the mucosal lining waiting to strike you need to take a lesson in medicine!
What does appear to be unchallenged is that vaccination reduces the risk of developing severe illness, which is the main object of the exercise.
…like vaccinated folk have decided they are now safe, so have dropped their guard with precautions, while the unvaccinated are maintaining theirs. The complete opposite is true in my experience. It is the frightened vaccinated who are continuing to wear masks and social distance, whereas those who have refused the vaccine have generally ignored the restrictive measures throughout this whole sorry saga. I suspect the true explanation is that the unvaccinated have better immunity – acquired naturally after exposure to the Sars-Cov-2 virus. The evidence is overwhelming that natural immunity is better than vaccine-induced immunity – even John Campbell, a voice of the medical establishment, admits as much.
Agree. i met my cousin for lunch at a local garden centre yesterday. mainly elderly clientele but quite a number of younger ones. I would guess the vast majority were vaccinated and probably in the case of the elderly boosted as well. Yet probably 75% or more still wearing face masks.
I do think though that the unjabbed are less likely to bother with tests. I almost certainly wouldn’t if i thought i had covid, might do a LFT out of interest but not report the results and certaintly wouldn’t do a PCR. My sister who is jabbed and recently got covid did a PCR test and when i asked her why (she was being harassed by the track and trace mob) she said she just thought it was ‘the responsible thing’ to do. Which is an interesting insight into how people have been brainwashed into believing what is ‘right’ in the new ‘we are all in this together’ (ha-ha) world.
For me, there have been two very notable statistical “smoking guns” over the course of the pandemic i.e. official data which blows a hole in the govt approach and caused me to sit up and listen.
The first is the excel spreadsheet on the NHS ENgland covid website which breaks down deaths by age and underlying condition, updated weekly. Shows that hardly any covid deaths are healthy people aged under 60.
The second are the Vaccine Surveillance Reports which, however way you choose to skin it, blow a hole in vaccine effectiveness against infection. The government knows this, of course, hence the push for (presumably endless) boosters.
Humpherson starts off by saying, reasonably, that the vaccinated and unvaccinated are distinct populations differing from each other in multiple ways. Then follows a sheer guess at a possible difference which might distort the relationship between case rates and vaccination status, phrased as if it was definite fact.
As an exercise in statistics as propaganda, this tactic would be completely routine in an exchange consisting of a dissenting newspaper opinion piece and a rapid rebuttal from officialdom drafted to manufacture the impression that dissent had been refuted.
What makes it remarkable is that Harries, just as much as Humpherson, regards statistics as the servant of policy and graphs as a method of forming educated public opinion. If that is how you see the matter, Henderson’s job – regulating government misuse of statistics – amounts to identifying propaganda failures and demanding the manufacture of more effective propaganda, not manufacturing it himself. We all know that Harries and Humpherson are part of the blob. This episode reveals that there is an Inner Blob, and that Humpherson is part of it and Harries is not.
While the MSM condemns the use of ivermectin, the most populated state in India just declared they are officially COVID free after promoting widespread use of the safe, proven medicine. In addition to this, Ivermectin attaches to covid spikes and prevents them from binding to ACE2. Get your Ivermectin today while you still can! https://ivmpharmacy.com
If you assume that Boris is doing his best to deal with a deadly pandemic then almost eveything he has done makes no sense.
If you assume Boris is a corrupt scum bag that has agreed to sell out th epopulation of the UK to the interests of big pharma and their vaccines everything he has done makes sense.
A warning to all of you in England. As you may know, in Scotland they have introduced vaccine passports for certain venues. As I predicted, now having been given this power, they are expanding their control and rule over us including hospitality venues and gyms. No evidence that gyms cause transmission but they don’t care. I suspect that they know may health conscious people use gyms who are therefore reluctant to take an experimental vaccination therefore we must be coerced even more. In England you must do all you can to resist these passports as they will claim its only few venues required and once in place will expand this as we are now seeing in Scotland.
They will also expand the number of jabs you have to have to keep the thing valid, pharma intends to have us like pin cushions.
Germany also has a melt down.
There is still no government as the various parties are in consultation to form one.
However, that are all in agreement on one thing.
There is a need to make new regulations to cope with what they see as a looming health crisis.
What is the melt down? The fact this particular issues is due to contain a surge that has been fueled by Germany’s relatively(what the article says is) a low rate of vaccination.
The article goes on to say
70% full vaccinated so they do need to restrict life to the same level as last year. That should be the end of conversation. This suggests it it not.
https://www.politico.eu/article/germany-coronavirus-government-coalition-social-democrats-liberal-free-democrats-fourth-wave/
No (mRNA/DNA) vaccines, no epidemicIndia, Bangladesh, Pakistan, and Indonesia collectively have 2 billion people… and essentially no access to advanced Covid vaccines.
https://alexberenson.substack.com/p/no-mrnadna-vaccines-no-epidemic?r=296gf&utm_campaign=post&utm_medium=web&utm_source=
“greater propensity of people who are vaccinated to come forward for tests”
“When in doubt, let’s just call black white” seems like a very popular technique in politics nowadays.
There’s been a lot of discussion about the UKHSA and ONS proportions unvccinted and how they difer.
So I thought I’d produce a chart to compare the proportions in each vaccination status (unvaccinated, one dose, two doses) by age group comparing the UKHSA data from NIMS (I used the week 40 spreadsheet that goes up to week 39) and the ONS data. Note that the UKHSA data is based on the vaccination status during each previous week of the population in NIMS at week 39. That’s not perfect but it’s good enough for my purposes here.
Here it is. There’s a good match until you zoom in at the end on the unvaccinated when you see the issue. The zoomed in chart is in my reply.
And here’s the close up showing the unvaccinated proportion is significantly different in the 60+ age groups. There is no real difference in the 10-59 age group at least when considering the age group as a whole, but there may still be dsicrepancies within that wide age band.
So how do we know that the UKHSA figures are most accurate? There are 2 strong bits of solid evidence that suggest that UKHSA are correct.
If you analyse the wider data in the ONS publication linked to above you see that based on the ONS proportions unvaccinated in each of the narrow age bands for which there is data (age 60-69, 70-79 and over 80), the all cause mortality (and non covid mortality) is implied to be much higher in the unvaccinated. However if you switch to the UKHSA proportions and rework the figures by adding in unvaccinated numbers up to the UKHSA proportions you suddenly see that mortality is implied to be around the same in both vaccinated and unvaccinated. The ‘ONS is right’ view is based on an unevidenced assertion that the NIMS system accurately records the number of vaccinations and so as the population is too high in NIMS then the error relates solely to an overstatement of the unvaccinated who are the difference between the population of NIMS and the vaccinated number. However a contractor who has worked on the NIMS database has reported on the reddit site that there are duplications of vaccination records… Read more »
Apologies I think the age 10-59 chart may be wrong.
I think this is the correct version.
It’s difficult to be certain this is correct as the data for the UKHSA line involves combining data across a range of ages and then adjusting around age 10 because UKHSA only has an under 12 category.
The problem with all this data diddling is that we tend to forget some of the basics – like the fact that SARS-CoV-2, in the first place, is no big deal or worthy of the expensive dog’s dinner that has been made of its supposed amelioration.
(Hark now at the cries of “But sooo many have sadleedide!”. – No they haven’t!)
You’ve got to admire the sheer determination to keep trying to push the vaccines, when the narrative is threadbare & falling apart. That or gasp at just idiotic our politicians really are, calling them idiots is letting them off easy.
The next time somebody tells you that UKHSA reports show substantial protection against severe outcomes, draw their attention to Ed Humpherson’s letter. He thinks these numbers don’t tell you anything about anything.
The vaccine surveillance reports include a section on vaccine effectiveness. It it just not the numbers that are being discussed. As Mary Ramsey says, these numbers are important to understand the implications of the pandemic to the NHS and to help understand where to prioritise vaccination delivery.
Humpherson has no idea what behavioural factors might be at issue.
Or possibly he doesn’t want to air his own hypotheses. In any case, just because he doesn’t know what the factors are, it doesn’t mean they don’t exist.
He wants UKHSA to use ONS population estimates instead.
No he doesn’t. He wants the UKHSA to publish rates based on both NIMS and ONS.
“In the meantime, you should consider setting out these uncertainties more clearly, including by publishing the rates per 100,000 using both denominators, ”
They are only publishing these numbers because they locked themselves into doing so early on, when they looked good.
Pure hypothesis and irrelevant. It doesn’t matter why they published them. What matters is what they tell us.
When using… Read more »
“Just because the ONS figures understate the population it doesn’t mean the NIMS figures are right.”
Correct. The NIMS figures could be underestimates.
“we have only a hazy idea of the size of the unvaccinated population in the age groups where vaccination levels are high.”
How can it be claimed that “vaccination levels are high” if we have only a hazy idea of the size of the unjabbed population?
I trust the supermarkets to have a better idea of the population of the UK. They have no incentive to lie.
The NIMS figures could be underestimates.
Possibly – but the main potential for error is duplicate registration or registration of people who have died or left the country.
How can it be claimed that “vaccination levels are high” if we have only a hazy idea of the size of the unjabbed population?
Although the ONS and NIMS estimates are subject to error they are not vastly different. However, in age groups where vaccination is high the calculation of the unvaccinated population is sensitive to small changes in the population estimate.
I trust the supermarkets to have a better idea of the population of the UK. They have no incentive to lie.
Do they issue population estimates?
We call it COVID-1984 for a good reason.
MiniTruth adjust misspeak, case rates among goodthink proles down from 1% to only 2%.
This is not new, only more serious. Please note my letter in BMJ on-line from December 2018 over the ONS hyping flu mortality by times 150 in order to get people to have the vaccines
https://www.bmj.com/content/361/bmj.k2795/rr-6
Government exaggerates flu mortality again: why cannot the public be trusted with the truth?I was perturbed and slighty astonished last week to see last winter’s excess mortality being largely attributed to the bad flu season, though it is well-established that this was not the case – the main culprit being on this occasion apparently the Office for National Statistics [ONS].
The BBC reported [1]:
“There were around 50,100 excess winter deaths in England and Wales in 2017-18 – the highest since the winter of 1975-76, figures from the Office for National Statistics show.
“The increase is thought to be down to the flu, the ineffectiveness of the flu vaccine in older people and spells of very cold weather last winter.”
The Daily Mail reported [2]:
“More than 50,000 excess deaths were recorded across England and Wales last winter, official figures show.
“Excess deaths refer to the amount of patients that died unexpectedly, calculated by comparing the mortality rate from winter months to the rest… Read more »
It’s almost as if vaccinologist Geert Vanden Bossche (ex GAVI and Bill and Melinda Gates Foundation) was right when he was so terrified months ago about mass jabbing in a pandemic. He was so concerned that he sent a short video to his buddies at the WHO but he was duly ignored. Now we are seeing immune escape, the jabbed are literally walking talking creators of new variants and shedders and spreaders of that not so lovely Spike protein! I caught covid from a double jabbed guy end of September and for me is was far less impactful than the flu I had as a child.NHS staff must all have the jab unless not face to face or have a medical exemption which you just know will be nigh impossible to get….all over a virus with a survival rate of 99.97%, average age of those dying from it is over 80 and they have at least 2 comorbidities….. it’s like living in an end of days movie isn’t it…..
“I caught covid from a double jabbed guy end of September”
How do you know it was ‘Covid’? When the PCR and LFT tests are not fit for purpose…
Every time someone says “I had Covid” they are extending this farce.
the horror!
https://coronavirus.data.gov.uk/details/deaths?areaType=ltla&areaName=Aylesbury%20Vale
i never really believe officials or their stats anyway
after the head of the NHS making that lie up about 14x more people in hospital now than this time last year – and no apology, I just assume anything said is the opposite of the truth
Clare Craig makes the following valid comment
https://twitter.com/ClareCraigPath/status/1457966571071094784
However, we look at it, it’s clear effectiveness against infection is pretty low.
makes you wonder about their claims of preventing hospital or death. they’ve lied about everything else
Early on in the vaccination campaign they chose to not vaccinate the most ill in each age cohort, because those individuals were considered to have a higher risk of death from vaccine related side effects and would be less likely to see a benefit from vaccination.
The effect of this is very visible in the deaths by vaccination status data released for the UK about a week ago.
By not vaccinating those closest to death they increased the average mortality rate of the unvaccinated group by a measurable amount, and the impact has been seen in all studies that have estimated the effectiveness of the vaccines and reducing hospitalisations/deaths.
I also assumed there would be some effect of very ill people or those unable to give consent not being vaccinated that would skew the figures
another ‘behavioural effect’ that makes all the data unreliable
in addition, unvacced groups tend towards poorer areas significantly. they tend to die of everything more and live 20 years less on average. another behavioral effect
I also see they have suddenly updated all their ‘confidence’ on vaccine efficacy in 1 week
https://assets.publishing.service.gov.uk/government/uploads/system/uploads/attachment_data/file/1031157/Vaccine-surveillance-report-week-44.pdf
page 9
compared to the week before
https://assets.publishing.service.gov.uk/government/uploads/system/uploads/attachment_data/file/1029606/Vaccine-surveillance-report-week-43.pdf
based on zero new evidence I expect – just after being bullied by the ONS
Yes, I noticed that too. Gone from ‘Low confidence’ to ‘high confidence’ in 7 days!
Here’s a chart I posted some days ago where I mentioned that this would create apparent efficacy of the vaccines where none existed
As you can see following the start of vaccinations in the 60-69 age group, covid labelled deaths in the unvaccinated go down but non-covid deaths in the unvaccinated go up for precisely the reason you say. The healthy get vaccinated leaving these most ill individuals to form a larger and larger proportion of the unvaccinated cohort.
The reason the covid deaths while going down in the unvaccinated, go down slightly less quickly in the unvaccinated than the vaccinated is not because of vaccine efficacy, it is because some of these unvaccinated people are most ill (the non-covid going up tells you that) but a proportion of them get their deaths labelled as covid.
It’s a huge effect.
https://www.youtube.com/watch?v=OvM5meOXk9o
Those claims are ALSO false according to Doshi.
Part of the problem is that they use a Test-Negative Case-Control methodology to calculate effectiveness — this is a great method to use when it works, but when it doesn’t it tends to give an overestimate of effectiveness.
All of these TNCC based estimates should be checked to see if there was any increased tendency in the vaccinated population to suffer from non-covid upper respiratory tract infections. This check should be done before TNCC is used, but it seems to be missing in every analysis I’ve seen.
I’d note that the Qatar paper on vaccine effectiveness includes both TNCC and multivariate analysis estimates (the other way to calculate this) — they give very different results, with multivariate showing significantly negative vaccine effectiveness. I’d say that this is a important indication that something is going wrong with the TNCC analysis and that an update is required urgently.
do you have a link to Qatar paper?
https://www.medrxiv.org/content/10.1101/2021.08.25.21262584v1.full.pdf
The authors don’t report a vaccine effectiveness below zero, i.e. negatives are reported as zero. However, the data enables one to calculate that actual figures. They hit -16% effectiveness after a few months.
Why is negative effectiveness i.e. immune harm reported as zero instead of the correct figure?
You’d have to ask the authors, but it is just a convention that they chose. If something gives you a disbenefit then it gives you ‘no benefit’, which they have chosen to report as zero rather than quantifying it as a disbenefit.
I have included below my annotated version of their graph showing the actual negative figures derived from their data (rather than having all negatives reported as zero.
The vaccine effectiveness wanes after only a month from second dose and then tanks spectacularly, not declining asymptotically to zero but going deeply negative.
Other studies show the same (e.g. large Swedish trial), which is certainly suggestive of why the rates of positive ‘cases’ in all adult age groups exceed the unvaccinated once a few months have elapsed from second dose.
Of course, this means that requiring care workers and NHS staff to be vaccinated is counterproductive because it will likely increase transmission. We are truly now in a pandemic of the vaccinated.
It would be easy to resolve this problem — just provide us with more data.
Tell us about the relative test rates of the unvaccinated vs the vaccinated (including the negative results) — it would be great to have that information. And give us information on cases/hospitalisations/deaths by morbidity and by age — so we can work out what’s going on ourselves. Give us up to date statistics on hospitalisations/deaths in the vaccinated by time since vaccination and by age, so we can see if there are negative effects of the vaccines — oh, and for covid and non-covid reasons — it would be stupid to not give this information, as that would only serve to hide any potential information in the data set. And please try harder to distinguish between with and from for the hospitalisations/deaths, and while you’re there let us know which individuals actually caught covid in hospital and which ones caught it in the community. Clearly all this information would be informative as to the actual situation with covid and it would mean that we’d not struggle to make sense of the morsels of data that are accidentally thrown out.
Oh? Don’t want to actually give… Read more »
or they could just do their bloody jobs so we don’t have to
The jobs we pay them to do
I’ve not seen much evidence that the government, or anyone else involved in this – “journalists”, “health”, “medical” and “scientific” communities – have any interest in finding out what is really happening. They cherry pick data to support their narrative.
“They cherry pick data to support their narrative.”
ie it has become political (if it ever wasn’t)
It may well always have been political for some of the actors in this. Possibly for others it became political soon after, once they realised the potential of covid to further their interests.
What a farce! It all represents another example of the three “Cs” in action – in this case cock-up, conspiracy and corruption.
In fairness to Humpybum, he’s probably correct that there are fundamental flaws within the data, and he’s absolutely correct that the behaviour of the vaxxed vs unvaxxed is different. I’d never dream of buying into any of this sh*t by reporting myself as a ‘case’, nor would I get tested in the first place.
So I can understand why there is a base for dispute on this data being used for actual comparing between the two camps.
However, when has that ever stopped them using similarly flawed data to push whatever narrative they want?
For example, the ‘cases’ figure is absolute rubbish and everyone knows it. It’s not based on test results (again, utterly rubbish) nor is it based on clinical observation. Dennis and Barbara from next door could have a heavy night of cider indulgence, then report a headache to 111 and get put in the case figures.
But this same, fundamentally flawed case count gets used to make decisions, often completely without question. So Humpybum can go sit in a bin if he doesn’t think this data will get used to fight against his tyranny.
It is not the questioning of data that is the issue. Any competent statistician knows that almost any data set has its potential pitfalls.
What is the issue is the wholly biased examination of such flaws – so solid criticisms that undermine the official narrative are waved aside, whilst an extraordinary effort is spent in trying to justify it by claiming black is white.
As a thoughtful suggestion: why don’t the UKHSA have a word with some climate ‘scientists’? I think you would find that these experts could give some very helpful pointers to adjustment of unsatisfactory data!
“Discard all ‘outliers’ that don’t confirm the settled, lucrative science.”
Settled like the snow we predicted would be a thing of the past.