by Howard Greene
Governments have imposed extreme policies to contain COVID-19 infections because of public perceptions that the mortality risk is high. As the collateral damage to education, careers, routine health care, and economies grows, and as infection rates decline, it is reasonable to assess to what degree the COVID-19 mortality risk justifies continued Government intervention in normal life.
It goes without saying that any unnatural death is a tragedy to be avoided. Nevertheless, in a free society, individuals make decisions every day that come with mortality risk: driving at high speeds on crowded interstate highways, or rock climbing, or ignoring the onset of serious obesity. In America, Government policy should reflect population mortality costs without trying to protect every citizen from the inevitability of death. Individuals should make decisions about risky behavior based on knowledge about their personal exposure to mortality risks.
Unfortunately, bad news sells better than good news, and politicians are driven to ‘do something’. As a result, the actual population cost and individual risk of dying from COVID-19 have been lost in a fog of tragic stories and fear mongering. This paper aims to cut through that fog by answering some basic questions:
- What is the individual risk of being infected with SARS-CoV-2?
- If an individual contracts COVID-19, what is his risk of dying?
- How does this mortality risk compare to the normal risks of modern living?
(A listing of abbreviations is included at the end of this paper.)
Average Individual Risk of Contracting COVID-19 Within the Next Year Is Less Than 5%
The average American’s risk of contracting COVID-19 during the period March 1 2020 through February 16 2021 was about 18%, i.e. one-in-five. This estimate is based on data from the Institute for Health Metrics and Evaluation (IHME), an independent global health research center at the University of Washington.
The CDC tabulates Daily New COVID-19 Cases (DNCC), but they do not capture infections which were not serious enough to require medical care. Daily New COVID-19 Infections (DNCI) estimates include both diagnosed and undiagnosed infections, and they are generated by epidemiological models using data from seroprevalence studies that test for antibodies to the virus and/or tracing programs that test for live virus in people who contacted infected individuals. IHME has developed such a model, and Figure 1 compares the CDC case numbers against IHME’s infection estimates.
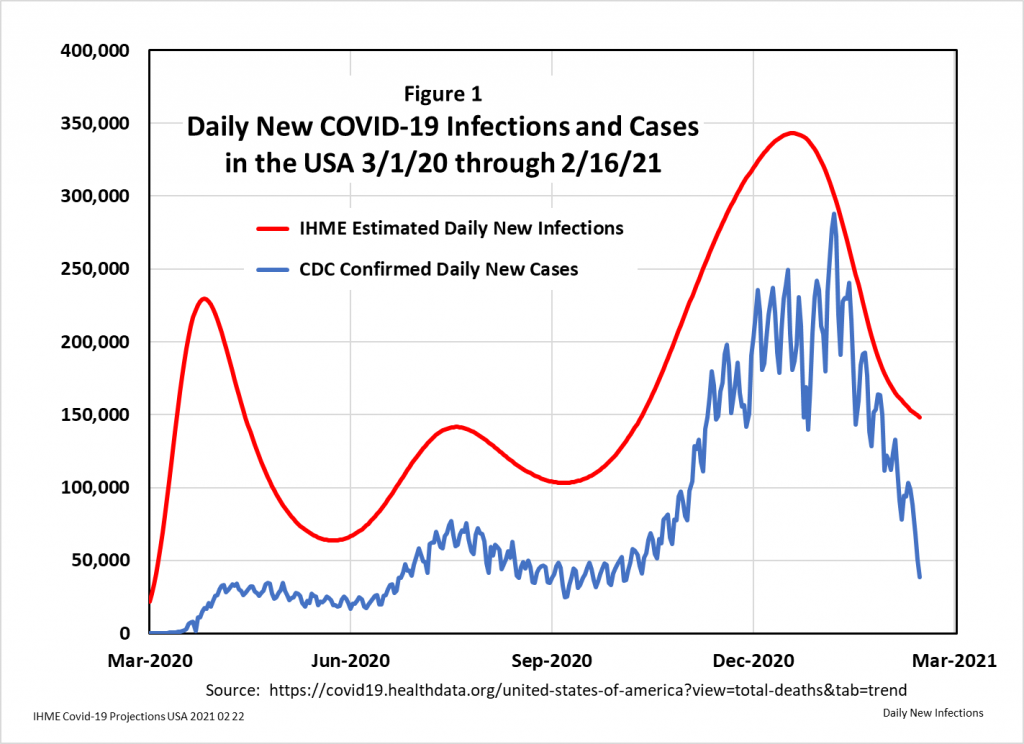
During the period March 1 2020 to February 16 2021, IHME estimates that slightly less than half (47%) of SARS-CoV-2 infected Americans were diagnosed as COVID-19 cases. Their estimate of cumulative total infections during that period is 27.6 million people, which is about 18% of the 328 million people living in America.
Dividing DNCI by the total population produces the average, population probability of having been infected in a 1-day time period. This Daily COVID-19 Infection Rate (DCIR) can be annualized using this formula: RA = 1 – (1 – RD)^365, where RA = Annual Rate and RD = Daily Rate. The Annual COVID-19 Infection Rate (ACIR) measures the probability of the average American contracting COVID-19 during the next 12 months, if the epidemiological parameters of the day in question were to remain constant for one year.
Figure 2 shows the daily ACIR for the period March 1 2020 to February 16 2021, along with IHME’s projection of ACIR to June 1 2021. As the chart indicates, the ACIR varied, with high points in April, August, and January, and low points in May and September.
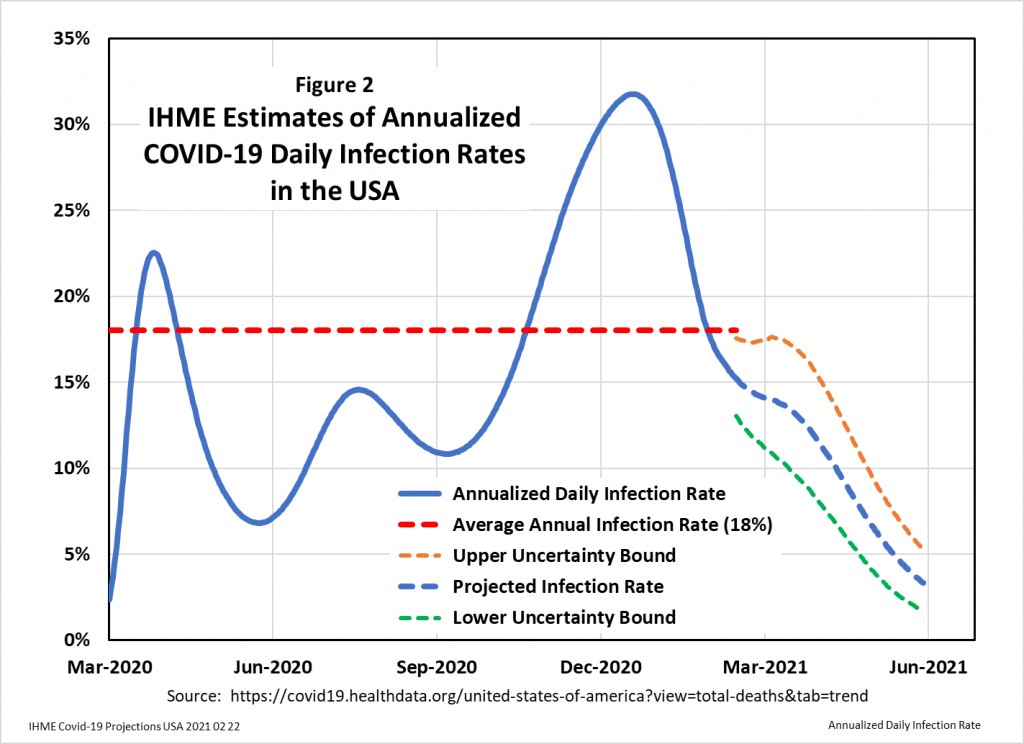
The implication of the IHME projection is that, by May 2021, the ACIR will drop below 5%. Thanks to the end of the virus season and the onset of herd immunity, the average American will face an annual risk of contracting COVID-19 of less than one-in-twenty. An individual American will be at higher or lower risk depending upon his relative exposure to infected subjects.
Nevertheless, COVID-19 will remain dangerous for people susceptible to the severe acute respiratory syndrome which can result in hospitalization and death. This danger is reflected in the COVID-19 Infection Fatality Rate (CIFR), which is a measure of the percentage of subjects infected with SARS-CoV-2 who die because of the infection.
The Risk of Dying from COVID-19 Is Strongly Age Dependent
CDC data indicate that the COVID-19 Case Fatality Rate (CCFR) varies dramatically with age: deaths among children are extremely rare, whereas the old and frail succumb in uncomfortably large numbers. This age dependency carries over to estimates of CIFR, which includes undiagnosed infections. Thus, an age specific CIFR would be a critical measure for determining public policy and individual risk mitigation.
An October 2020 paper in the European Journal of Epidemiology tackles the problem of estimating the age specific CIFR by using meta-regression of data from a systematic review of 27 CIFR studies in 28 geographical locations: Assessing the age specificity of infection fatality rates for COVID‑19: systematic review, meta‑analysis, and public policy implications.
Their work produced the CIFR relationship shown in Figure 3. The regression analysis yielded a coefficient of determination (R2) which indicated that 95% of the variation in CIFR rates can be explained by age. When they used this regression equation to predict CIFR rates for 16 countries and cities based on the age demographics of those populations, the R2 for the correlation between predicted and actual regional CIFRs was 0.87, validating their model.
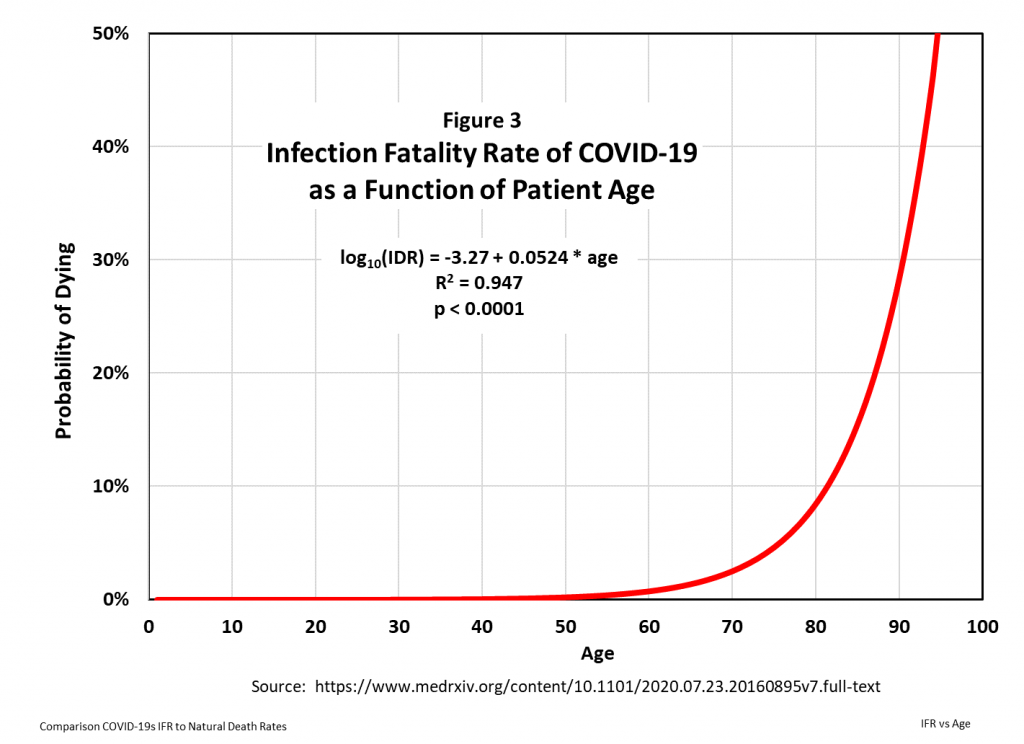
These correlations are excellent, so their model is a good basis for projecting the probability of dying from COVID-19 within the next twelve months as a function of age. This probability can then be compared to the mortality risks from all other causes of death.
Even For the Elderly, COVID-19 Is No Longer a Serious Mortality Risk
The Annual COVID-19 Mortality Risk (ACMR) for an average American is calculated as follows:
ACMR = ACIR * CIFR [i.e. (infection rate)*(fatality rate)]
In Figure 4 the ACMR is calculated for three levels of ACIR: 10%, 5%, and 2.5%.
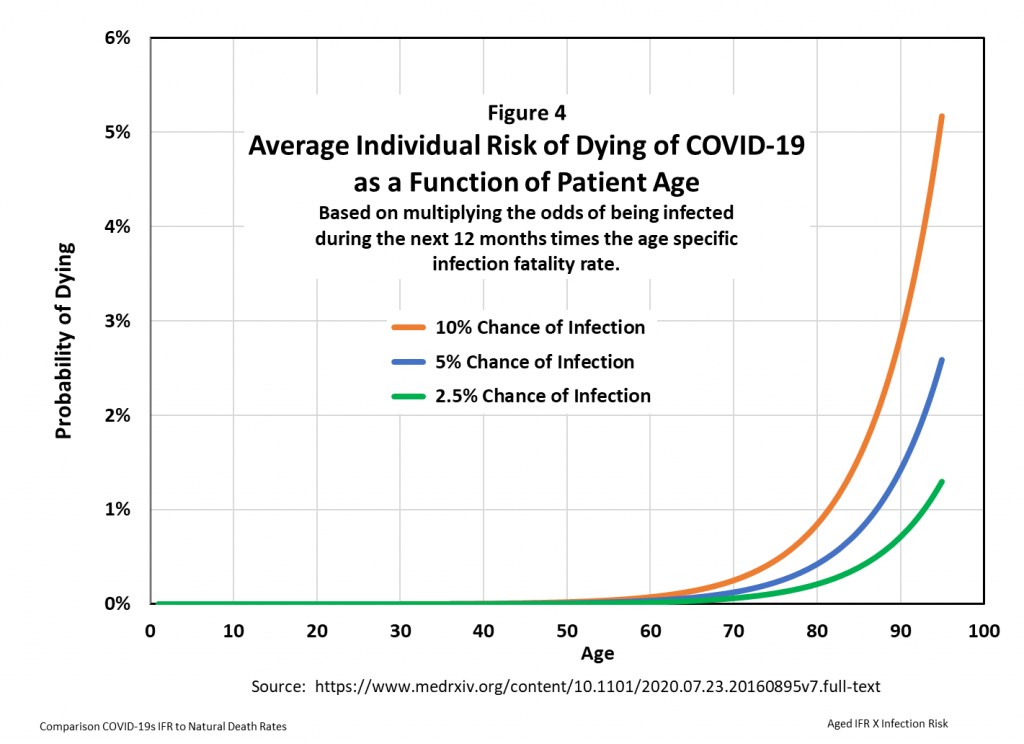
Below the age of 60, the ACMR is close to zero. But the curves rise sharply at higher ages. How worried should older people be about this risk?
This question can be answered by comparing the risk of dying because of COVID-19 to the natural risk of dying from all causes. Population mortality risk estimates are central to the life insurance industry, and the US Social Security Administration publishes an Actuarial Life Table that reports the probability of dying within one year from all causes – the Annual Actuarial Death Rate (AADR) – for all ages between 0 and 119 years.
Figure 5 compares the mortality risk from COVID-19 to that from all causes, i.e. the age specific actuarial risk vs. the age specific COVID-19 risk.
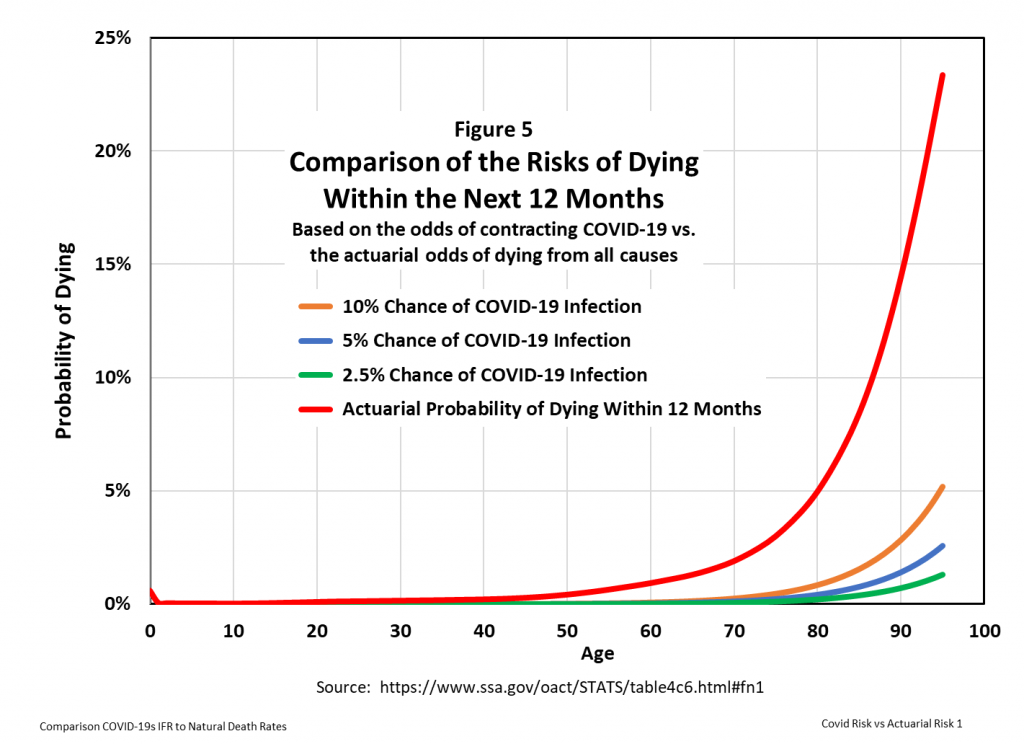
Because the curves lie close to zero and virtually on top of each other below age 50, a vertical log scale shows more clearly the relative mortality risks, as presented in Figure 6.
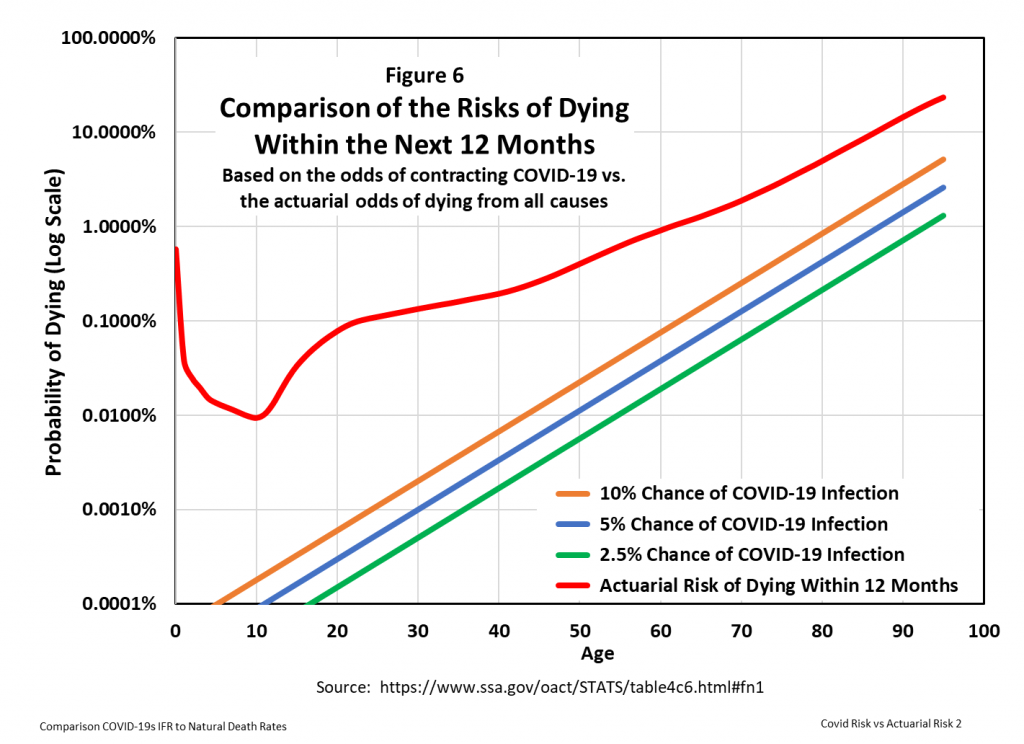
Figure 6 indicates that, at an ACIR of 5%, the probability of dying of COVID-19 within the next twelve months is at least one log factor less than the probability of dying from any cause for all ages up to about 90 years.
This difference can be measured as a hazard ratio, which in medicine is a comparison between the probability of events in a treatment group, compared to the probability of events in a control group. In Figure 7, the ‘treatment’ group measures the risk of dying from COVID-19, and the ‘control’ group measures the risk of dying from all causes excluding COVID-19. (This exclusion is strictly true, since the AADR data were developed prior to the onset of COVID-19, and therefore do not include the additional mortality risk from COVID-19.)
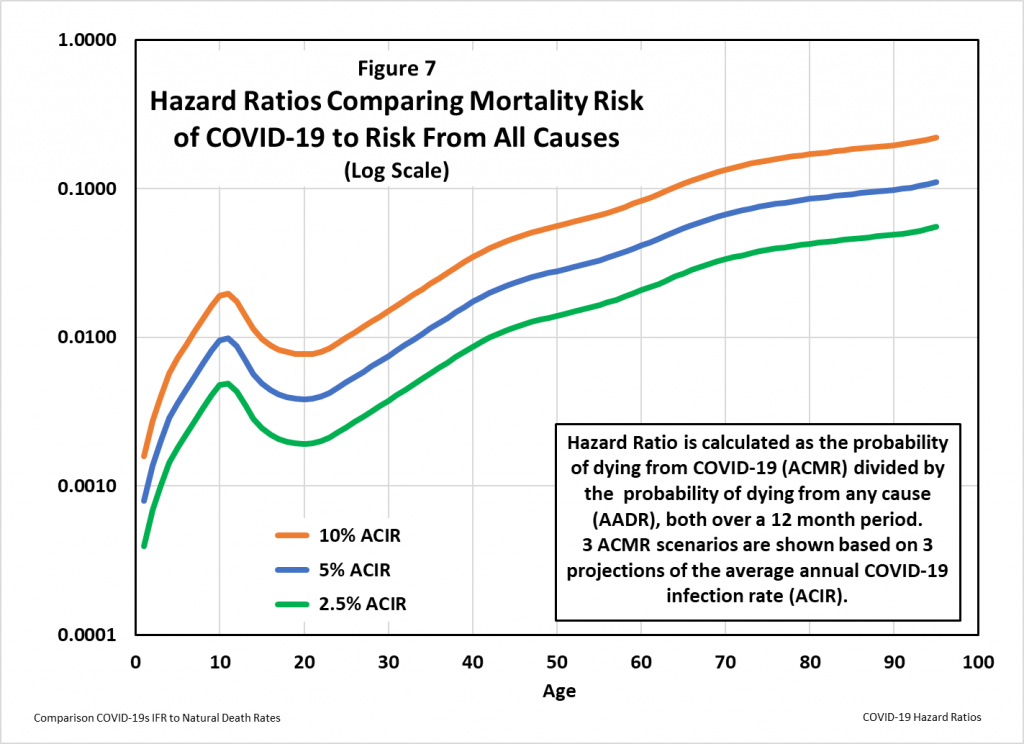
The 5% projection for the average American’s probability of a COVID-19 infection over the next 12 months is probably too high: based on the end of virus season and developing herd immunity, IHME projects the rate to drop below 5% in about two months from this writing. Even with this conservatively high rate of infection, Figure 7 shows that the risk of dying from COVID-19 compares to the natural age dependent mortality risk as follows:
- Ages under 34: On average American children and young adults are 100 times more likely to die of another cause than to die of COVID-19. Unless comorbidities raise the risk of COVID-19, people in this age group don’t need to be vaccinated, and they should return to normal lifestyles without non-pharmaceutical interventions. Individuals with relevant comorbidities should take appropriate steps to avoid contracting SARS-CoV-2.
- Ages 35-63: In this age range the average American risk from COVID-19 increases with age from 1% to 5% of the risk from all other causes of death. Thus, even without non-pharmaceutical interventions and vaccination, the excess death rate from COVID-19 will probably not be measurable in this age group. Public policy should focus on vaccinating these people and educating those with comorbidities (e.g. cancer, obesity, hypertension) to take precautions to avoid potentially infectious activities.
- Ages 64 and over: For the average elderly American, the risk from all non-COVID-19 causes of death plateaus at about 10 times that from COVID-19. For elderly Americans in good health, that risk is even lower. Vaccination is obviously recommended, but for the elderly without relevant comorbidities, life can return to normal.
Bottom line, going forward the population risk of dying of COVID-19 has declined to levels well below the natural mortality risk most healthy Americans face as they grow older. Governments should therefore wind down virus-induced interventions in normal life.
Abbreviations
AADR: Annual Actuarial Death Rate (probability of the average individual dying from all causes in the next 12 months)
ACIR: Annual COVID-19 Infection Rate (calculated from the DCIR using this formula: RA = 1 – (1 – RD)^365, where RA = Annual Rate and RD = Daily Rate)
ACMR: Annual COVID-19 Mortality Risk (probability of the average American dying from COVID-19 in the next 12 months)
CCFR: COVID-19 Case Fatality Rate (based on counts of diagnosed infections ONLY)
CDC: Center for Disease Control, US National Institutes of Health
CIFR: COVID-19 Infection Fatality Rate (based on estimates of diagnosed AND undiagnosed infections)
COVID-19: Coronavirus Disease 2019 (the disease caused by SARS-CoV-2)
DCIR: Daily COVID-19 Infection Rate (DNCI divided by total population)
DNCC: Daily New COVID-19 Cases as tabulated by CDC
DNCI: Daily New COVID-19 Infections as estimated by epidemiological models
IHME: The Institute for Health Metrics and Evaluation
SARS-CoV-2: Severe acute respiratory syndrome coronavirus 2 (the virus that causes COVID-19)


Donate
We depend on your donations to keep this site going. Please give what you can.
Donate TodayComment on this Article
You’ll need to set up an account to comment if you don’t already have one. We ask for a minimum donation of £5 if you'd like to make a comment or post in our Forums.
Sign UpLatest News
Next PostLatest News