Most of those sceptical of the Government response to COVID-19 have concluded that the recent uptick in cases is seasonal. COVID-19 appears to recur in winter and seems to have partly replaced the flu this year. We will call this the ‘flu hypothesis’.
If this is correct, then we may be able to make some predictions about what is about to happen in the United Kingdom with respect to Government policy and the public response. Now that the new lockdown is upon us we can use the ‘flu hypothesis’ to imagine two possible outcomes and assess their relative likelihood.
First let us try to get into what passes for the minds of those dealing with the response. The Financial Times, which seems well plugged in to the mindset of the political class, published the following helpful graphic:
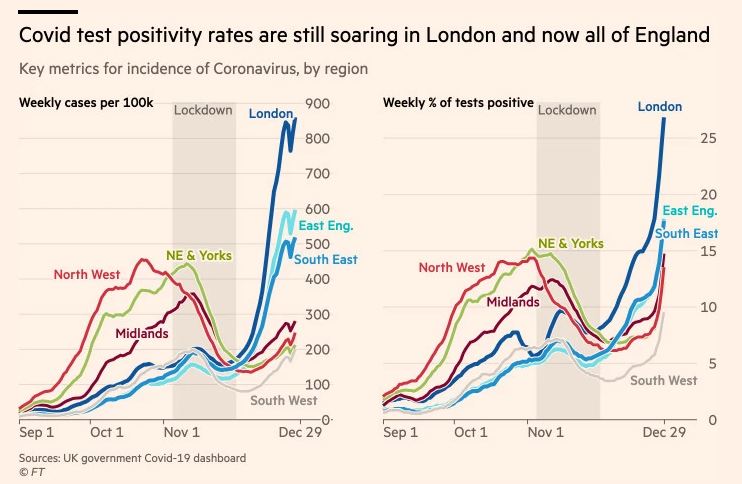
What this tries to show is that the lockdown worked. If you glance at the chart and don’t really think about it – you know, like a public official would be inclined to do – it looks like a lockdown was imposed at the beginning of November and cases in the North and the Midlands fell.
Now, lockdown sceptics will say that this was just a coincidence. After all, robust cross-sectional studies – the sort of studies honest scientists use to evaluate these sorts of things – show that there is no correlation between lockdowns and outcomes. And cases in the Northwest clearly peaked around two weeks before the measures were introduced.
The funny thing about the second national lockdown, however, is that no one really followed it. Most non-stupid people understand that, unlike during the first lockdown, life went on as normal. The only difference was that pubs and restaurants were closed. This is exactly what the Google footfall data shows.
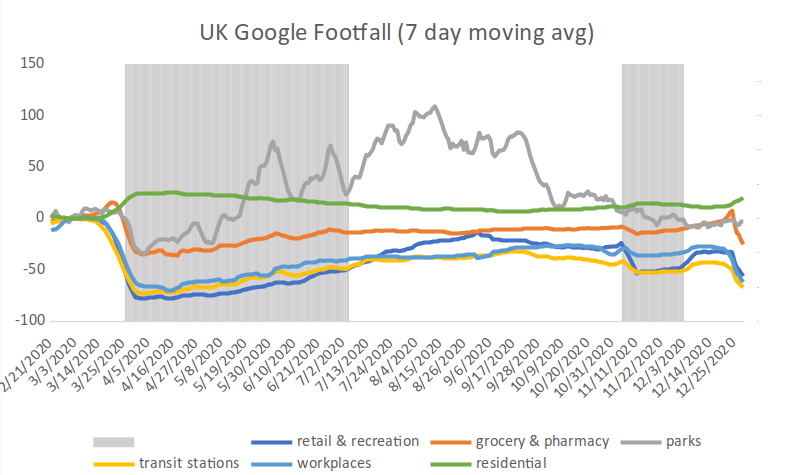
The effects of the first lockdown in March are profound. But the effects of the second lockdown in November? Not so much. We see a decline in ‘retail and recreation’ that was due to the pub and restaurant closures, but beyond that we don’t see much of an impact. The data shows that the instincts of lockdown sceptics – and anyone else who is actually paying attention – are correct: the second lockdown did not have much of an impact and so, the most likely explanation for the decline in cases is that it simply coincided with the imposition of the measures.
Okay, so let’s say that this is the case. And let’s also say that it is highly probable that the virus will follow something like a seasonal flu pattern – this is our ‘flu hypothesis’. What will this mean for the future trajectory of cases? Let’s look at some flu data from the past few years. Let’s start with actual virological test data as this is pretty similar to what the Government are using for COVID-19. Here is the data from the 2018-2019 flu season.
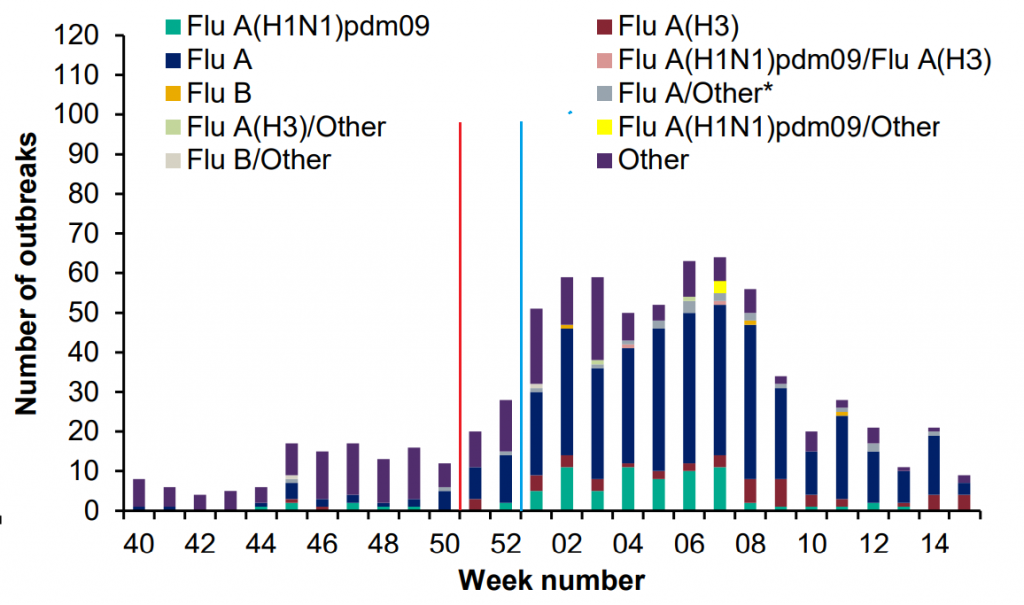
I have added two lines to this chart. The red line is the second week of December. If you look back at the government chart for COVID-19 published by The Financial Times, you will see that this is when COVID-19 cases started to explode. As we can see from the flu chart, this is precisely when the flu season starts. This supports our ‘flu hypothesis’; it shows that the recent uptick in cases of COVID-19 is happening as if the virus were the seasonal flu.
The blue line is where we are now. As we all know, the Government has just imposed another lockdown. This lockdown has effectively started where the blue line is in that chart.
Given this information, what would the ‘flu hypothesis’ lead us to expect? Simply that the Government will fall flat on its face. In 2018-2019, flu cases remained elevated until the 8th week of the year – that is, some time around late-February/early-March. If this pattern holds for COVID-19, then the government lockdown will not make a dent in cases. The chart from The Financial Times will break down.
The likely Government response to this will be to get angry. When stupid people do stupid things and the stupid things lead to bad or ineffective outcomes, stupid people tend to get angry and blame others. Expect that this is what the Government will do. They will blame people for not following the lockdown and they may even ramp up restrictions or clamp down on those not seen as adequately compliant.
This could go either way. The population may side with the Government. But they also may become annoyed at being heckled. My feeling is that people are pretty sick of this and scepticism of lockdown measures is widespread. But your guess is as good as mine in this regard.
Can the data allow us to picture an alternative scenario? Yes. Here is flu reporting data for the past few years – it’s not quite as good as the virological test data for an apples-to-apples comparison with the COVID-19 case data, but it does the job.
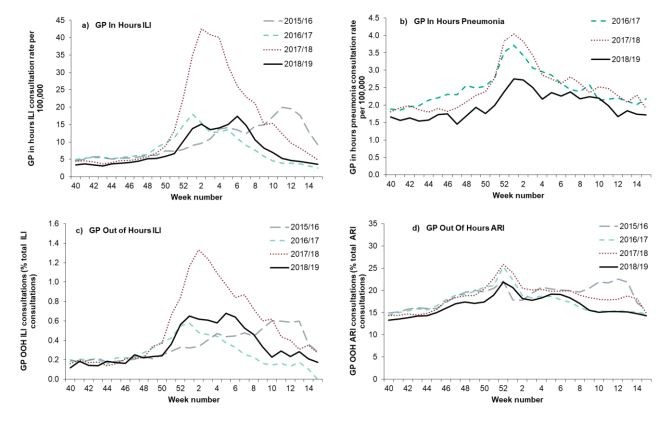
As we can see, in 2017-2018 we had a different pattern to the flu season. It peaked between the 2nd and 3rd week of the year – so around mid-January/early-February. Since the new lockdown kicked off at the beginning of January this year, if COVID-19 follows the path of the 2017-2018 flu season, then the Government graph-makers will be very happy indeed. Their silly little shaded graph – which is totally non-rigorous scientifically, but very appealing intuitively – will come out smelling like roses.
But the fact remains that this is the least likely outcome. Out of the four flu seasons listed above, this pattern only held in one – so, on that crude basis we might say that this is a 1 in 4 (25%). Here is a bit more data from a previous year’s report.
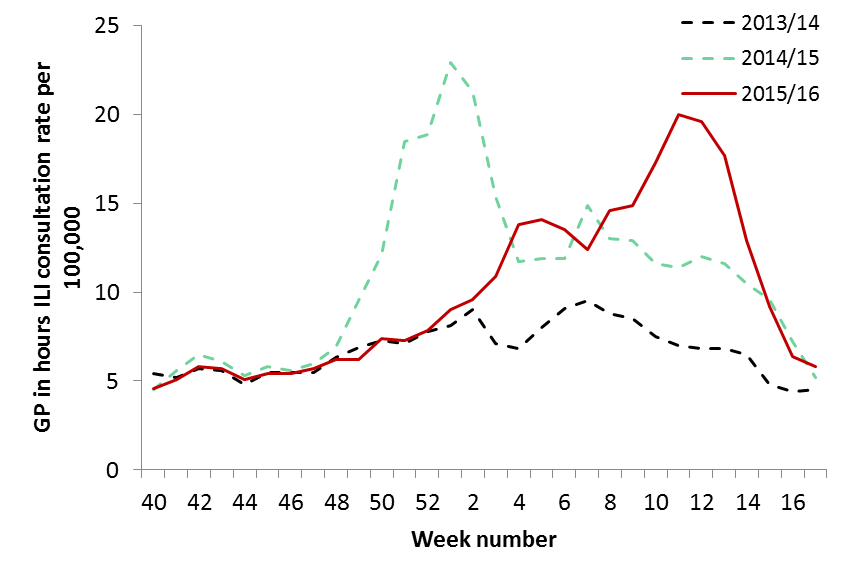
That adds in two more observations. One in which we saw a peak in the 2nd week, one where we saw a longer drawn-out flu season. That gives us a crude estimate of a 2 in 6 chance (33%) that the Government policy will fluke into working.
We should highlight that these are not impossible odds by any stretch. Based on past patterns and assuming that our ‘flu hypothesis’ is reasonable, the Government has an okay chance of imposing a lockdown that will then appear to work, anywhere between 25% and 33%. But they have a substantially higher chance of imposing a lockdown, seeing no impact, and then getting angry at the population.
Which is the better outcome? In the short term it would probably be better that the Government policy appears to work so that these morons leave us alone for a while. Unfortunately, this will give them bragging rights and allow them to continue presenting their silly graph and this will presumably pave the way for another round of lockdowns if/when cases rise again. In the long-term then, it is probably better that the policy crash and burn and the bananaless monkeys in charge get angry, aggressive, and punitive. That way the population will get a greater sense of the actual credibility of the people in charge.
The author is an academic economist.


Donate
We depend on your donations to keep this site going. Please give what you can.
Donate TodayComment on this Article
You’ll need to set up an account to comment if you don’t already have one. We ask for a minimum donation of £5 if you'd like to make a comment or post in our Forums.
Sign UpCovid Cynicism
Next PostLatest News