
Another month has been added to the standstill in global temperature, according to accurate satellite measurements compiled by the University of Alabama and NASA scientist Dr. Roy Spencer (see above). The pause is now 90 months long. In fact a small downwards movement is now discernible, since the trend measured over the last 90 months is minus-0.01°C, which equates to minus-0.14°C a century. It must be noted, however, that such small movements, although widely used by climate alarmists in the upwards direction, are within the margin of error.
As I have noted in recent articles, the Spencer data has been kicked off Google AdSense for “unreliable and harmful claims”. The move demonetised Dr. Spencer’s monthly satellite update page by removing all Google-supplied advertising. Google says it will ban all sites that are sceptical of “well established scientific consensus”. Agenda-driven commentators almost invariably ignore satellite data, which has consistently shown less warming than surface measurements.
Satellite temperature measurements of the atmosphere are generally considered more accurate, because they avoid the urban heat distortions common to surface measurements. It is suggested that such measurements have been pushed higher over time as stationary measuring stations are enclosed by growing urban development. For instance, temperature measurements are common at busy airports. Before the planes arrived at Chicago O’Hare, one of the world’s busiest airports, it was rural orchard fields (as indicated by its IATA code, ORD).
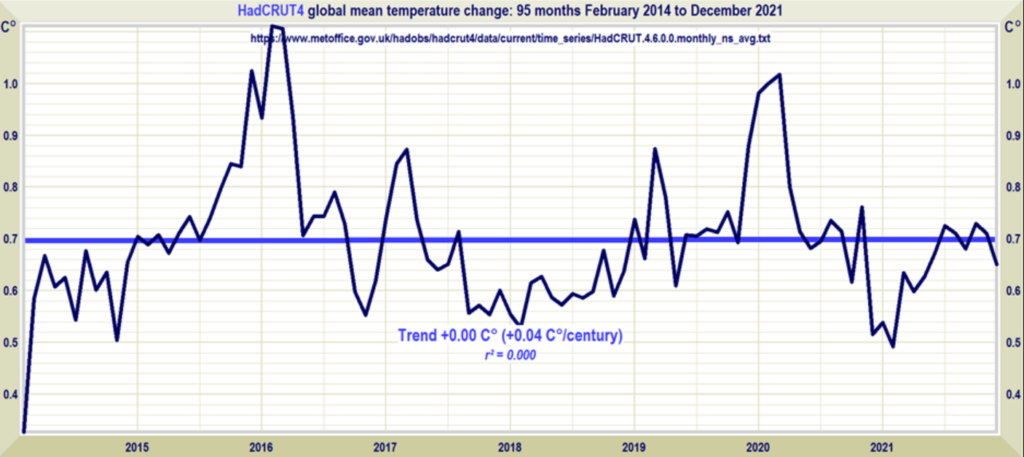
Interestingly, however, the global temperature standstill is starting to show up in the surface record, as measured (above) by the Met Office HadCrut database. Here we see almost no movement over the last 96 months. The 0.04°C century rise is most definitely within the margin of error! But it would seem that the Met Office is failing to discuss these significant trends. This might be considered surprising, since in the U.K. we know that local temperatures have been plateauing for some time. The average temperature in the 2010s at 9.17°C was colder than the 2000s at 9.31°C.
Writing about the latest standstill in Watts Up With That?, the journalist and former political adviser Christopher Monckton described the pause as “one of the best kept secrets” in journalism. Monckton was a former leader writer on the Evening Standard and these days rarely minces his words. Leaders on both sides of the Atlantic dare not lose face over the politics of climate change, he suggested. “They cannot bring themselves to admit that they have been wrong, that they have been fooled, and that they have needlessly and expensively ended the free market in energy supply,” he added.
Two months ago, the seven-year satellite record was still showing a tiny warming trend with the Net Zero 1.5°C target achievable in 400 years’ time. Alas, for Thermogeddonites everywhere, even that small consolation is no longer available.
Chris Morrison is the Daily Sceptic‘s Environment Editor.


To join in with the discussion please make a donation to The Daily Sceptic.
Profanity and abuse will be removed and may lead to a permanent ban.
> It is suggested that such measurements have been pushed higher over time as stationary measuring stations are enclosed by growing urban development.
Actually it seems that monitoring stations are being removed and the temperature “modelled”.
Well that worked so well with the covid fraud, you will naturally want to use it for the next fraud….
I think the modelling used for the climate fraud gave them the idea for the covid fraud
chicken / egg
I think it’s a bit of both. Where temperatures aren’t being recorded e.g. in parts of Africa and over large parts of the oceans the gaps are being filled in partly based on modelled data. Over time I expect the difference between the UAH data set and those based on surface data e.g. Hadcrut to increase. Guess which data sets the MSM will use.
The equipment used is also anomalous. I believe the British were first to standardise the Stevenson screen, the Americans followed with a similar but larger version.
They were never intended to be part of a global monitoring system, they were strictly local stations. There were strict standards as to where they should be sited and the maintenance regime, including the type and colour of paint used on them.
They were frequently badly sited (often because of later tree growth or house/road building etc.), badly maintained and frequently whitewashed when they were maintained, which was the wrong type of paint.
Data was gathered manually, and if anyone knows anything about human nature, it would probably have been the tea boy sent out to take readings, when they could be bothered.
Reading a Thermometer in inclement conditions is difficult and largely to the nearest half a degree, if not just rounded up or down to the nearest degree C/F.
Digitising record keeping may seem a blessing but calibration proved difficult between different manufacturers. In Australia an entirely new type of screen, much smaller than either of the original Stevenson screens, were introduced and there is evidence of data tampering to allow for the changeover from analogue to digital. Reported to the Australian BOM by Jennifer Marohasy but, predictably, stifled and ignored.
Historic records cannot be considered reliable, but they are cited as such in computer models.
And yet DT has an article today highlighting the third of French ski resorts lost to global warming. Ha ha.
It is difficult to tell at this point if it is mass hysteria, groupthink, paid-for bullshit or they are just taking the piss 🤔
Paid for, Mass histeric, groupthunk, crowd funded piss taking. Yep, that just about sums it up.
Ha ha, absolutely.
All of the above Vaxtastic.
Saw an interview on GB News this morning with some professor type about how the government was going to have to start incorporating terms in its forthcoming trade deals (apparently EU already well ahead on this – of course) to regulate its “carbon borders” so that goods with an excessive carbon footprint contribution are not imported into UK, so raising our carbon footprint. Something along those lines.
In a nutshell it will be a wokery excuse for simply limiting consumer choice and demand. Great Reset in action and people don’t even realise it, all dressed up by economics gurus and do-gooders in the name of the climate crisis.
Indeed. Pure sophistry. And it works.
Hmmmm. Not sure about that. I just ordered a Lenovo Android tablet from Hong Kong. £100 less than I could get it from Amazon or anywhere else online.
Most goods can be ordered from overseas for direct delivery. Obviously not perishables.
Somebody needs to tell that Carbon Borders guru about that little loophole.
The nicest thing about Capitalism is, it always finds a way.
Maybe they could start with all the immigrants from low carbon countries that Johnsons government seem intent on importing across the channel.
It seems pointless to increase the consumption of carbon in this country by increasing the number of consumers when if aided to improve their lives in their own countries would be a better solution.
Still joined up thinking never was the governments strong point no matter what their hue.
Reading the article the cause is a decline in snowfall which doesn’t necessarily mean higher temperatures. It is worth recalling that the decline of snow on Kilimanjaro some years back is said to have been caused by land use change in the vicinity (deforestation, I believe) which lowered rainfall, and hence snowfall at higher levels.
Entirely possible as the satellite observations determine average global temperatures. The NH could be warming whilst equatorial regions are cooling. I’m not saying that’s the case but merely illustrating the point.
I have always believed that the main drivers for century-level global temperature measurements have been the slow rise out of the Little Ice Age, on which is superimposed the 60-80 year cycle of the AMO
The AMO was in it’s rising phase during the 1980-90s, and peaked around 2005. Since then it has been flat, and is starting to slide downwards again.
I wonder how the Global Warming activists will handle this. probably by lowering earlier temperatures yet again. Soon we will be being told that the summers of 1970 were on average below freezing…
Before 1970 every power station poured out SO2 which as we all know promotes cloud condensation, causing smog at low levels and increasing cloud cover at higher levels. … it is therefore pretty obvious that SO2 led to a depression in temperatures. … it’s therefore clear that end SO2 emissions would lead to warming. Strange how none of the models show this effect … despite it suddenly warming in the 1970s (at the end of the global cooling scare).
I have fond memories of the summers of the 1970’s. Baking hot they were. Considering I likely won’t get to travel again any time soon I would welcome them back warmly.
But everyone smoked, fewer women worked and every house had a chip pan. All verboten now. How the world has changed.
I knew it, women working has caused climate change.
I know – the good old days eh?
and people were a lot slimmer….
Far less junk food and fewer take-aways .
Mothers could still cook in those days!
That’s true, my children were fed on fresh, nutritious food. But then, we were at home instead of at work. Did the shopping, cleaning, cooking, took the kids to school, picked them up. Nursed them through Measles and the other childhood illnesses (essential for a good immune system,better than vaccines), didn’t have to farm them out during those long school holidays or leave them to roam the streets worrying what they were getting up to.
But back then a family could live reasonably well on one wage. Today there isn’t a choice, mothers have to work, which suits the PTB because the influence we have on our children’s formative years is far less, and theirs far more. If we disagree with some of the outrageous propaganda the teachers are filling their heads with, what can we do? Those Muslim mothers who held protests outside their children’s school, or took them out, could do that because they don’t, on the whole, go out to work.
We have relinquished so much power to the state and can do little about it.
”… mothers have to work…” Do they? How about they go without a few extras? Have more basic holidays? Run one car? Etc.
well, that is debatable…
Or even welcome them back hotly!
i976 Heat Wave and drought – sunflowers six feet tall.
….thousands of ladybirds.
I have came to same conclusion by analyzing ice breakup dates of Tornionjoki River (1700…), temperatures of Tornionjoki valley (1800…) and North Atlantic Sea Surface temperatures (last 160 yr.). After removing effects of AMO (sine shaped c.a. 65 yr. cycle) and recovery from Little Ice Age (linear rise), nothing is left to correlate with the claimed warming effect of atmospheric CO2 rise.
Detailed analysis: Increasing Carbon Dioxide Concentration in Atmosphere Has Negligible Effect on North Atlantic Sea Surface Temperature
Oh come on. It’s a well known fact that declining temperatures are caused by increasing temperatures. This is basic climate emergency thescience, please keep up.
That’s right. And what causes the rising temperatures that drive the declining temperatures? Transphobia, which in turn is of course driven by fracking, which is racist.
Ultimately the nexus of all of this: Putin.
And not enough people understand this. HE is behind it all.
To be more precise, declining temperatures are extreme weather events which occur more frequently now because of the climate breakdown caused by global heating.
NB: That’s not made up.
Not by you, maybe, but someone is making it up.
Yes but it is all made up – that is the real ‘inconvenient truth’ Gore ignored.
Even the IPCC tells us there is no reason to believe extreme weather events are worse than they were in the past. Indeed, there is considerable evidence to suggest extreme weather is less frequent than in the past.
Apart from a week of ‘named storms’ which was a bit tricky truth be told, this has been one of the mildest winters I have ever experienced, with much less rainfall as well. Not really much to back up the narrative of “extreme weather events” at all.
It would be lumped in the category of “we told you winters would get warmer”.
As the entire northern hemisphere celebrates.
This March was the sunniest on record in the U.K.
No doubt the Met office will claim it as an extreme weather event and therefore proof of climate change. This is exactly what they did last year when April was the sunniest on record.
I believe April this year to be the coldest April start on record. I daresay we won’t hear anything of it though.
Sounding very schoolteacherish there CG!
Well, what a surprise.
✔️7 house points for you.
Will I be eligible for a trophy at the end of term Sir?
Don’t get ahead of yourself. Tuck your shirt in and chewing gum goes in the bin over there.
Do you still dish out lines or is that not a thing any more?
Man, I wouldn’t want to transgress in your classroom – you sound very strict Mr CG.
🤣🤣
When you have 1/f noise like we have in climate, then the amount of noise increases with the longer the period and tends toward infinity for an infinite sample.
So technically all measurements are within the margin of error.
But you don’t understand, Mike. If you do enough model runs and average out the results then you get absolute precision. The more model runs, the higher the accuracy. That is what modern climate science says
Just like giving enough monkeys, enough typewriters, and enough time, and they will eventually reproduce the entire works of Shakespeare.
Climate models work in much the same way. One day one of them is bound to get it right, entirely by chance.
Yes but after Covid lockdowns no-one will be able to read them.
Never mind charts that seem to prove the contrary: the UN Climate Bedwetters have just issued their latest ‘definitive’ report into how all use of fossil fuels must stop NOW.
Surely, that nice UN couldn’t be wrong?
UN wrong? Surely not. Isn’t it full of “scientists?”
UN- is a prefix deemed to mean not, so UN-science means not science. I hope that clears it up for you. And of course UN-scientists means ….
Do we have a scientific consensus on that?
Does this mean that UN should mean UNable. For example unable to stop Russia invading Ukraine, unable to stop Assad using chemical weapons against civilians, unable to give meaningful advice during a global pandemic (which probably wasn’t a pandemic except for the fact that they called it one) etc.
I’m actually UNable to see the point of the UN.
That obese Secretary General looks very compliant, hot and sweaty …who is he really working for? (WHO indeed!)
I think they want Boris to make it irreversible before more people wise up!
Putting measuring to one side for the moment and trying to keep questions simple; are large areas of snow and ice on this planet disappearing or not?
It’s not that simple. Intersectional scientism has taught us that simplistic methodologies like measurement, testing hypotheses and revisiting assumptions in light of new evidence don’t help create the all important vortex of relentless fear, existential dread and nihilism required to fundamentally knacker our country. So knock it off. 🧐
I knew there would be straight forward answer
STRAIGHT forward? Homophobia, homophobia everywhere 🤬
😡😡😡
Just what I was going to post.
😀 😀
Indeed. Measuring the amount of snow and ice could offend or trigger someone; besides, we don’t need to know this. This is a climate emergency breakdown feedback loop catastrophe crisis; we don’t have time to ‘measure’ ‘snow’ or ‘ice’
Do you feel threatened by the possible disappearance of white-only regions in Anarctica?
:->
Nice tie in. Upvoted.
Getting out of my depth!
Rising sea levels.
Assuming sea levels are rising and not falling surely melting ice/snow can be the only additional source of water. They are rising aren’t they? I don’t suppose it makes an iota of difference to the planet.
Entirely unscientific.
Melting sea ice will not cause sea level rise.
AhHa! The alarmists shriek, but melting land-bound ice in Antarctica will!!!!
One problem with that belief. The Antarctic rarely rises above -20ºC at any point. It was believed Scott died in temperatures around -44ºC, during the Antarctic summer.
So once the sea ice has melted around the Antarctic thanks to the oceans being warmer than the ice, with no real effect on sea level rise, it must thereafter rise beyond the level of the continent Antarctic ice occupies. Think of the white cliffs of Dover.
So, the ice on the continent remains constantly below -20ºC so won’t melt of it’s own accord, and sea levels can’t rise enough to breach the white cliffs to melt it, and so make sea levels rise.
Seemples…….
Then the tide is coming in.
We then have a few metres of beach bound ice melting whilst the Antarctic is one of the largest continents on the planet.
depends when you start counting.
There is quite a big one around the South Pole which is being a bit stubborn.
As far as I know, snow extent (measured by area) hasn’t changed much. To answer your question below, a much greater cause of sea level rise would be the themal expansion of the oceans, so that sea level is rising is not necessarily an indication of melting ice.
But perhaps a warming sea?
Yes, that’s the idea. Or maybe a mixture of the two.
Oceans exhibit warming over thousands of years such is their volume. We are experiencing ocean borne climate events from thousands of years ago right now. The entire volume of the atmosphere represents the heat absorbing capacity of a few metres of the oceans surface.
Great article here which explains it.
https://www.spectator.com.au/2022/04/climate-change-lessons-from-king-canute/
Thanks, I’ll take a look at later.
Apart from a reduction in s02 has there been anything done by humans recently which may have affected the way currents circulate around the planet?
I doubt reductions in any atmospheric gas would have any meaningful effect on the oceans. They are vast, 70% of the planet’s surface, deep and dense compared to our atmosphere.
Energy is never lost, merely displaced.
Where there is snow and ice disappearing somewhere on the planet, it is reappearing elsewhere.
I am genuinely intrigued by this. If globally the temperature is slightly cooling or at least remaining stable, how is it that the inland glaciers continue to melt? Or, has the temperature slightly warmed and then stabilised at a higher level. I am thinking of glaciers in the Alps, and also I believe there are photographs of glaciers which have shrunk dramatically in the Andes.
this one melted back to where it was in 1915
https://www.smithsonianmag.com/smart-news/melting-glacier-italian-alps-reveals-world-war-i-artifacts-180977703/
and then there’s this…
Thank you, that is very interesting.
Pesky climate is always changing.
We can’t rely on anything these days. Can’t even get a free dodgy test these days.
What is the world coming to?
Don’t answer.
Yes – every twenty thousand years!
this one melted back to where it was in 1915
The article gives no exact data but it must have been after 1918. The Guardian claims the glacier shrank back sufficiently that shelter was again accessible in 2015. But Glacier shrank back to size it last had 1919! doesn’t seem like something indicative of man-made global warming to me: After all, the glacier already occupied only the smaller area a loat of carbon-dioxide earlier.
Glacier extent is affected by the levels of snowfall at the head of the glacier (simply it is the weight of snow pushing the glacier). Reduction in snowfall is not necessarily a sign of higher temperatures.
There are glaciers which are also regenerating. From memory, there was an Indian scientist prosecuted for misrepresenting the melting of Himalayan glaciers.
https://sciencefiles.org/2022/04/04/alles-hysterie-co2-hat-gar-nichts-oder-nur-sehr-wenig-mit-dem-klimawandel-zu-tun-neue-studie/
Time for Musk to make a move on Google?
Trump trying to take on Big Tech but can’t seem to get his platform to work – says BBC.
BIg Tech sabotage of course!
Well, as BBC would have it, it was case that Trump’s platform just wasn’t any good, like the rest of , er, Trump.
Somebody should! They have had it all their own way so far!
“Google says it will ban all sites that are sceptical of “well established scientific consensus”.
That one sentence tells us that Google has rejected science and is simply pushing propoganda. As we on here know Google is wholly unreliable and the sensible default position is to disregard any nonsense where ‘the science has been decided.’
But you have to admit, there is a real air of desperation about all these defenders of truth. All it seems to be doing is driving the more inquisitive away to other corners of the interwebs. This site, for example.
I hope you are correct.
The whole point of scientific endeavour is to destabilise scientific consensus.
Why not ban Copernicus, Galileo, Newton, Einstein …
Give them time.
I’m sure they were all involved in the slave trade.
Isn’t it climate change now as they cannot decide if global temperature is going up or down. As the earth has been in existence for 4.5 billion years the climate has been changing for all of those 4.5 billion years.
As a matter of interest when was the climate normal so we have a datum point to measure from?
“As a matter of interest when was the climate normal so we have a datum point to measure from?”
Ah well the science has not quite got round to determining that particular point… just yet.
Take your pick.
We need to ask Fauci. Didn’t he say, “I am the science”?
I thought he said, “I am the enemy’?
Great line! Says it all.
That is a great question. Porritt was asked just that on Talk Radio. They have no answer other than to talk about increasing extreme weather.
My thoughts exactly SmellyMelly. They are operating from the assumption that it is strictly linear and on nothing other than an upward trajectory – when surely there must be periods of ebb and flow.
If solar cycle 25 turns out to be weak temperatures will plummet, Windturbines will freeze of fail to turn in still air, and solar panels will be covered in snow rendering them useless, the Clowns and their Clown World ideals could have created the perfect storm.
A change can be quite abrupt. Much of my youth was spent skating on The Gadloch in Scotland, from the late 60’s until about 1974 when, for no apparent reason, the loch would no longer freeze in winter.
I figured out then something was going on, but of course we were still in the grip of Global Cooling hysteria which lasted for, probably, another five or six years.
I was convinced about global warming until I saw Al Gores “An Inconvenient Truth’ which I found just too conclusive to be credible. So began my search for the definitive evidence that atmospheric CO2 causes warming.
To this day I have yet to find a single, credible, empirical, peer reviewed, scientific study demonstrating the phenomenon that stands up to scrutiny. The fact there are not legions of these studies, perpetually testing each others hypothesis, splashed across the MSM daily, is sufficient evidence in-itself that the CO2 warming hypothesis is nonsense.
In our scientific ignorance (less than 90% of the planet’s population has a scientific education beyond secondary school) we are hoodwinked by political propaganda masquerading as science.
Scientist argue against this propaganda using science, but only 10% of the planet’s people understand science, so what chance do they have of influencing political indoctrination?
Sceptics must get cuter in presenting their arguments.
But you can bet your bottom dollar they will have some kind of personal generator in the cupboard for their own personal use in such a situation and to hell with the rest of us who can either freeze or swelter to death (depending on the season)
Ideal data for picking cherries!!
Completely irrelevant for tracking climate trends.
Describe a climate trend please.
Sweet cherries are best suited for areas where temperatures are mild and humidity is low while tart cherries will grow in cooler climates, so you’re right, the cooler climate revealed by the data does make it ideal. Good to see you’ve given up believing in the AGW fantasy.
Before COVID I deferred to “the science” on climate change. Not any more. The parallels are just too obvious to ignore. Garbage modelling and hysterical alarmism, often for personal gain. The whole thing is clearly a sham.
Can anyone remember what was used to terrify us at school in the sixties?
(Other than nuclear war)
Vietnam war. Never off the TV as I recall.
I recall it as being the population explosion…..there wasn’t going to be enough room on the planet for us all…..living in Lowland Scotland I used to think that the Scottish mountains could be bulldozed and used as a form of land reclamation into the sea! Primitive thought, I know…..
I don’t know about school but I remember my father being so terrified by the bay of pigs incident he went out and bought a shotgun and ammunition to defend us if necessary. I think in those days a shotgun licence was ten shillings and you bought it from the post office. (We actually still had an air raid shelter in the garden too!)
I feel very sorry for children these days. Their lives can hardly be carefree if global destruction and guilt is being constantly pushed down their throats.
They are being targeted by the left to live in fear and consider big government their salvation.
The only thing that terrified me in the sixties were praying mantises. Living in the New Territories in Hong Kong I saw an awful lot of weird and wonderful animals and I lived through a three day typhoon, but it was only the praying mantis with it’s alien face, that frightened me.
My fear was centipedes when my family was living in Kowloon about the same time. The Amah patrolled my room with a broom for me before I went to bed. I was around 7 at the time.
I found a praying mantis in the garden of a friend’s house in the Tarn.
I picked it up and it just sat calmly om my hand.
Praying Mantis are harmless to humans. I have seen many but never an aggressive one.
We lost our pleasure Yacht at Hebe Haven in that Typhoon.
Welcome to the real world. You are now officially a societal outcast.
😂😂😂
Yes …and yet we hear hysterical calls from US “climate scientists” and yet more Carbon Zero “experts” for a total ban on oil to meet temperature reductio “targets”!
The world, led of course by the US, is falling into the hands of the criminally insane!
….’fallen’ Mr B, but there is likely more to fall as the criminals double down on the agenda for us global citizens.
It is a bonus getting these factual articles about what is occurring or not with the climate…lines on graphs that do reveal the state of something (climate) as opposed to those in the DM article showing ‘infections’, which tell us diddly squat.
Mr Vivaldi, as far as I can see there are still four seasons, so the climate is the same as it ever was.
Not quite sure of the point of your reply. Yes there are 4 seasons and climate varies over years, decades, millenia. Warming period in early middle ages, Little Ice Age hundreds of years later. What has been modelled by various departments/ organisations has failed to materialise. The climate change ‘scenario’ has been corrupted by some modellers ( vested interests) just as the ‘ covid pandemic’ has been courtesy of Imperial College’s Ferguson.
Vivaldi – Four Seasons. Does that help in anyway?
Oh no….have you been playing me like a violin.!
Saw what you did there – I strung along …
Here on the Northants/Rutland border there are 6 seasons.
You’ve got me there, please explain.
Jan and Feb: winter
Mar and Apr: spring
May and Jun: early summer
Jul and Aug: high summer
Sep and Oct: early autumn
Nov and Dec: late autumn
Fits what we experience far better than the 4 season convention does.
where I live it is entirely possible to have 4 seasons within the one day – and we frequently do.
I would break it down differently
Dec and Jan – definitely winter
February – Late winter but spring is coming
March – Early spring
April – spring
May – Early summer
June and July – High Summer
August – Still summer-ish but you know autumn’s coming
September, October – Autumn
November – Winter nearly upon us
The world would be so much better off if there were no governments. Look what governments around the world have done for their populations in the last few years:-
can anybody think of one good thing a government anywhere in the world has achieved for the populations they are paid to represent? Just one thing, no matter how small cos I can’t.
In my experience most people no matter where they are from just want to get on with their lives in peace, do business and Co exist with each other. The main hindrance to this is world governments with everything they do from introducing legislation to stoking tensions between nations and individual groups of people. We would be far better off without governments, we will save a load of money for starters. Sure there will be problems but we will be able to muddle through and it sure as **** could not be as bad as they are at the moment!
Anarchy, which you appear to promote, has never been a good solution as far as I am aware. Mostly because it is quickly replaced by autocracy, usually with some thug at its head.
Government helps to provide order in society, from which we all prosper on many levels. I agree you can have too much government though – especially during a pandemic!
A few questions for you
https://www.conservativewoman.co.uk/a-few-questions-for-you/
Did you realise that the UK could have been totally independent from world prices if only successive governments had not been obsessively pursuing an unrealistic and unreachable zero-carbon target?Do you understand that our current domestic energy crisis (and possibly another one in the autumn) is a direct result of the UK’s attempt to reduce our tiny proportion of the world’s emissions?
Ivor Williams
Stand for freedom with our Yellow Boards
Tuesday 5th April 2022 4pm to 5pm
Yellow Boards By the Road
A3095 Maidenhead Road/B3034 Forest Road
Three Legged Cross, Forest Rd, Warfield,
Bracknell RG42 6AE
Stand in the Park Sundays from 10am – make friends & keep sane
Wokingham Howard Palmer Gardens
(Cockpit Path car park free on Sunday)
Sturges Rd RG40 2HD
Bracknell
South Hill Park, Rear Lawn, RG12 7PA
Telegram http://t.me/astandintheparkbracknell
Quite astonishing that Prof Spencer’s data set is not regarded as ‘well established scientific concensus’.
Primary data is precisely that and Spencer/Christy now have just over 40 years of it.
If there is one thing that is ‘scientific concensus’ is that you must collect data to draw scientific conclusions.
I know of no-one that disagrees with the troposphere data set in general terms.
Remember that that is not the same as the land-based temperature network datasets. The troposphere measurements are measurements in the sky above us, whereas the land-based ones are at sea level. It is entirely acceptable that they may show some divergence.
There is a second set based on radiosonde balloons which passes through the same gaseous phase and these show some discrepancies, which teaches skeptical readers that instruments are not infallible and that measurement is only as accurate as the measuring instruments. However, broadly, the two independent data sets draw the same general conclusions about temperature trends in the gaseous phase above the surface of the earth.
I tell this story every now and then so I’ll log it here. I was doing a Masters in early 2000s. A fellow student asked if I intended doing a PhD. He said, if so, I should make it about global warming (as was). I said ‘I’m a psychologist’. He said ‘it doesn’t matter, you’ll get your proposal accepted and will probably get funding too’. I’ve often wondered what garbage he went on to contribute.
Someone please explain (because I’m not a scientist or statistician) why there’s an apparent overall visual upwards from 1979 and the website states there’s a +0.15 increase for march???
The data from 1979 do show a general global warming since that time. But it has flattened out for 7+ years now. The 2015/16 El Nino caused a huge spike in global temperature, and the current La Nina is preventing those temperatures from being attained again for the moment.
March 2022 is indeed recorded as 0.15 degC higher than February. Due to noise in the data the graph does wiggle up and down a fair bit. HTH.
When interpreting figures like that, it’s worth taking into account the accuracy and tolerance with regard to the instruments used. Almost nothing available in the market is 100% accurate, so they should quote the level of tolerance – say +/- 0.2 °C in the range from -10 to +50, or whatever. In the past, the best old style mercury one that I used to use in my photographic hobby was +/- 0.2 °C. Not only that, with digital presentation, their will be rounding up and rounding down much of the time.
If they don’t say how good it is, and only quote small values – say +0.15 – it could be meaningless for any one off value. Might argue that there is long term trend, but even then, if different instruments were used over time – well, do the sums yourself.
The only thing that’s 100% accurate is bank accounts etc. Whenever there is something physical, accuracy will be variable, most of the time.
The latest warming phase of Atlantic Multidecadal Oscillation (AMO) began c.a. 1975 and lasted until c.a. 2016. That caused warming around, and it is used as a proof of Catastrophical Athropogenic Global Warming. It was on top of still ongoing recovery from Little Ice Age to help making scary headlines. Anyway, we are now going towards cooler times with next cooling phase of AMO, if nothing exceptional happens.
Chris Morrison: you have made a basic error in your “small signs of cooling” statement, which Christopher Monckton avoided in his Watts Up With That article. It is that The Pause is, by Monckton’s definition, the longest most recent interval over which the linear trend is not positive. Therefore the quoted trend must be negative if given to sufficient significant figures, usually by a small amount since prepending one further month makes it positive.
There may come a day when a statistically significant negative trend arises in UAH data. At that stage you can talk about global cooling. For now, The Pause is interesting enough in its own right.
I have come to expect a higher standard of numerical argument in The Daily Sceptic.
Strange comment: the fact that all the trends currently discussed are within the margin of error was repeated several times.
They are not just within the margin of error, which would be quite large, but very close to zero by virtue of the deliberate choice of the endpoints. Hence the trend isn’t “negative but within the margin of error” but “negative and so close to zero that there should be no misleading comment on that negativity”.
So Google thinks there is such a thing as a “well established scientific concensus”. All that money and tech brilliance and they’re as thick as 5H1T when it comes to science. If there’s a concensus that means there’s fraud.
Not thick so much as part of the establishment!
Global warming all part of the new world order.
If you accept water vapour as a gas, perhaps the damming of rivers and a vast amount of water not getting to its traditional places to evaporate and cause rain is as much to blame as co2 or methane, people can see desertification and the need to move due to drought I wonder if co2, etc is a strawman to try and keep populations where they are in the hope electricity will keep them where they are eventually?
I’m looking forward so much for the next pulse of the current ice age to noticeably kick in before I die. The planet’s normal temperature – talking geological time scales – is a few degrees higher than we now have, and without ice caps.
”Fake Invisible Catastrophes and Threats of Doom” by Dr Patrick Moore. All you need to know in a very readable book.
He explains how there has never been a link between the amount of carbon dioxide in the atmosphere and the warming or cooling of the planet.
Arctic ice max extent since 2016 in Millions of square Kilometers. Source – NSIDC.
2016 – 14.52 Mar 24 down to
2017 – 14.43 Mar 7 up to
2018 – 14.48 Mar 17 up to
2019 – 14.78 Mar 13 up to
2020 – 15.05 Mar 5 down to (15.05 was extraordinary, fanfare worthy).
2021 – 14.77 Mar 21 up to
2022 – 14.88 Feb 25
Note – Any difference between the above and the current NSIDC figures is due to the latter altering data, sometimes years later.
Due to the fact that temperature records are so shambolic and diverse, the NOAA (National Oceanic and Atmospheric Administration of the USA) decided to create the US Climate Reference Network, USCRN, a series of 114 weather stations placed across the USA. These stations are:-
1, Located in pristine locations unaffected by human activity or heat island effects (towns, cities, airports, roads, etc).
2, Identical in design.
2, Identical equipment.
3, Identical maintenance.
The system went into operation in 2005.
Well I was going to publish the resulting graph that the USCRN produced, which also shows a slight downward trend since 2005, but that cannot be done. The graph I have was current in September of last year.The NOAA replaced that format with a user unfriendly format just prior to cop26.