Groucho Marx once quipped: “Those are my principles, and if you don’t like them… well I have others.” Welcome to the world of global temperature setting and climate modelling where changes, no doubt for sound scientific reasons, almost invariably promote the Net Zero agenda. On Monday, the Daily Sceptic disclosed that the fifth revision to the Met Office’s HadCRUT temperature database boosted recent global warming by 14%. In fact, this was just the latest uplift in the HadCRUT series
In 2013, the slight cooling from 1998 to 2012 was transformed to a 0.04°C warming, a figure that subsequently found its way into the fifth 2013 IPCC assessment report.
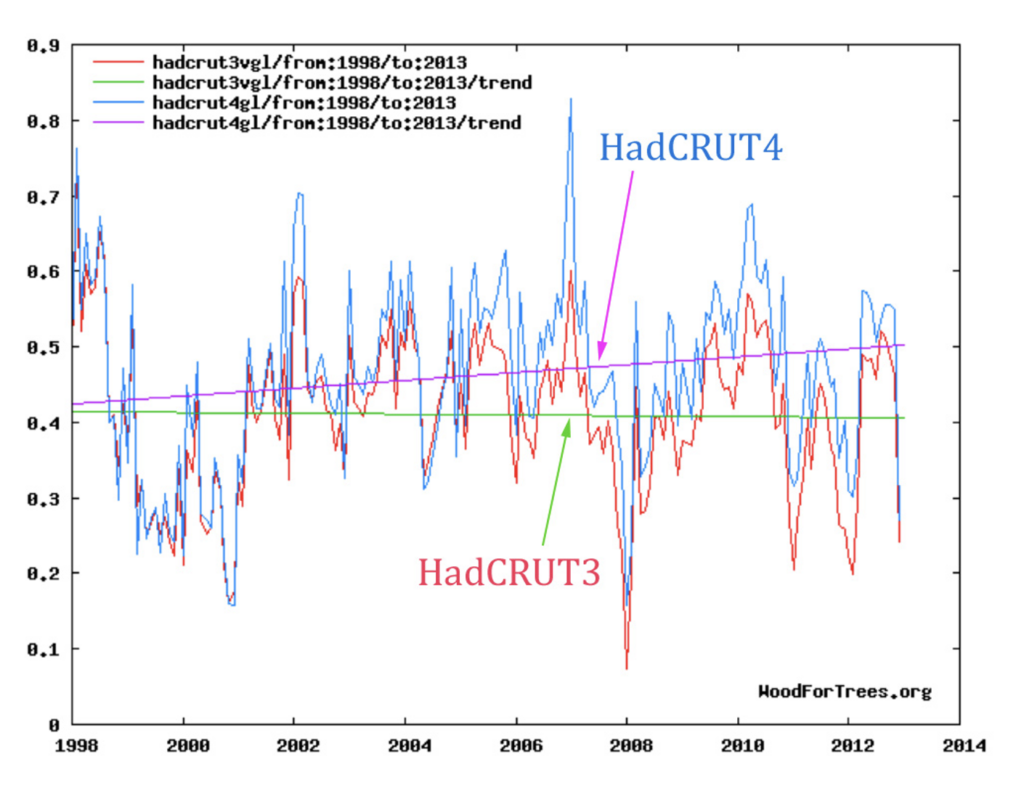
The graph above, published in the climate science website No Tricks Zone, shows the change from HadCRUT3 to HadCRUT4. Overnight, a temperature flatline became a gently rising trend. At the time, many climate alarmists were worried about the pause in global temperatures that set in from around 1998. The carbon dioxide scare was becoming a potent weapon in the drive to introduce a control and command economy characterised by an agenda now called Net Zero. Scientists have spent decades trying to prove a constant link between CO2 emissions and temperatures, but to no avail. In the absence of actual proof, climate models guess that doubling CO2 in the atmosphere will lead to a rise of up to 6°C. As a result, their forecasts have long lost any semblance of reality in an era when global warming has run out of steam.
HadCRUT is a joint venture between the U.K. Met Office and the Climate Research Unit at the University of East Anglia. The latter of course was at the centre of the 2009 Climategate scandal, when a large leak of internal documents cast interesting light on some of the methods used to produce the IPCC ‘hockey stick’ graph. This graph accentuated recent warming by abolishing the substantial rises seen in the mediaeval warming period and the cooling of the little ice age.
In a paper published last month, a group of academics led by Meng Wei from the First Institute of Oceanography in Qingdao, examined the results of numerous versions of land, sea and merged temperature databases. They were said to “consistently show that the global surface temperature somewhat plateaus in 1998-2012 after the strong warming surge in 1975-97”.
Let us now look at what happened to that pause in the latest HadCRUT revision. As can be seen in the graph below, the pause was still slightly evident in HadCRUT4, but it is now no longer with us. HadCRUT5 added about 0.1°C to the record of the last 20 years and the pause has been quietly airbrushed from the historical record. The graph also shows the cooling of around 0.1°C applied before 1974, which has the effect of accentuating the ‘hockey stick’ effect of recent warming.
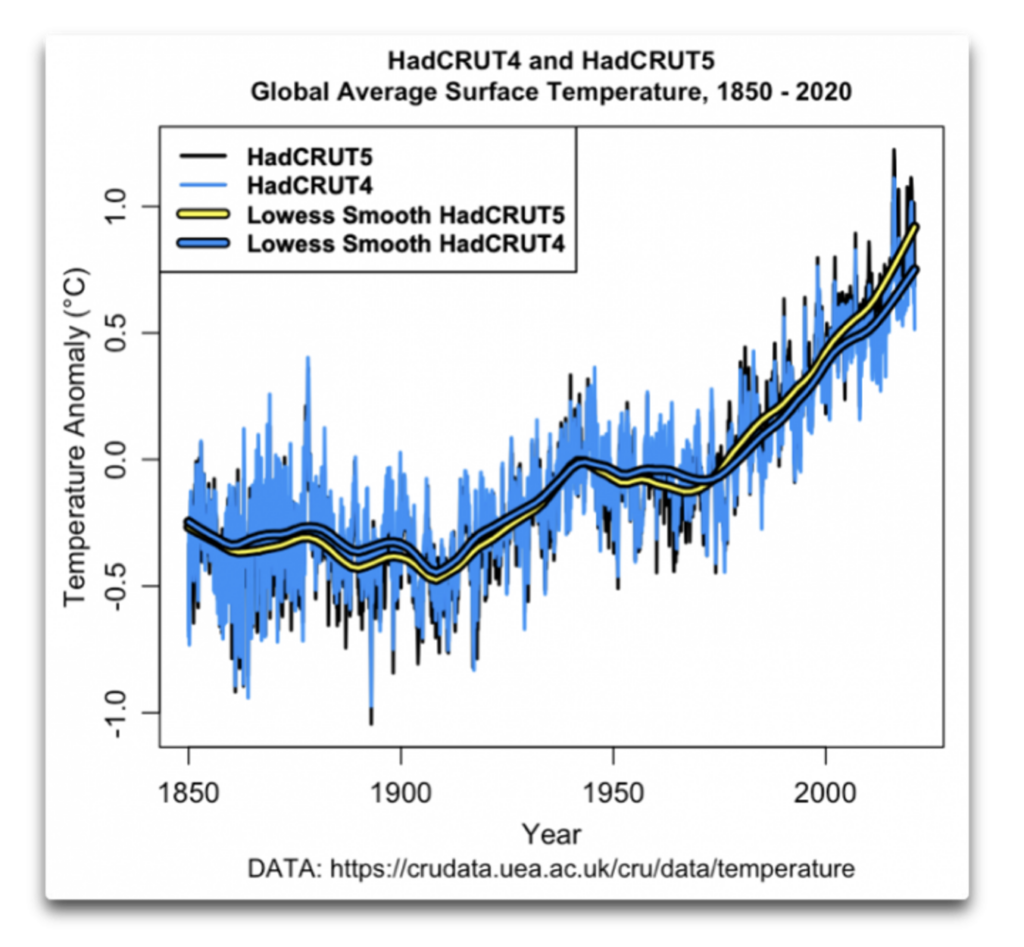
Announcing the fifth revision in 2020, the Met Office said HadCRUT5 was now “in line” with other datasets, adding: “the four years 2015 to 2018 are the warmest in the series… which runs from 1850 to 2018.” News that perhaps doesn’t come as a great surprise given the helpful 14% boost to the figures. As we also noted on Monday, the U.S. database run for NASA by the Goddard Institute for Space Studies (GISS) has also undergone considerable recent revisions. As with HadCRUT, these have cooled the past until the 1970s and warmed the latest recordings. Changes in temperature at GISS have been substantial with a range of 0.3°C.
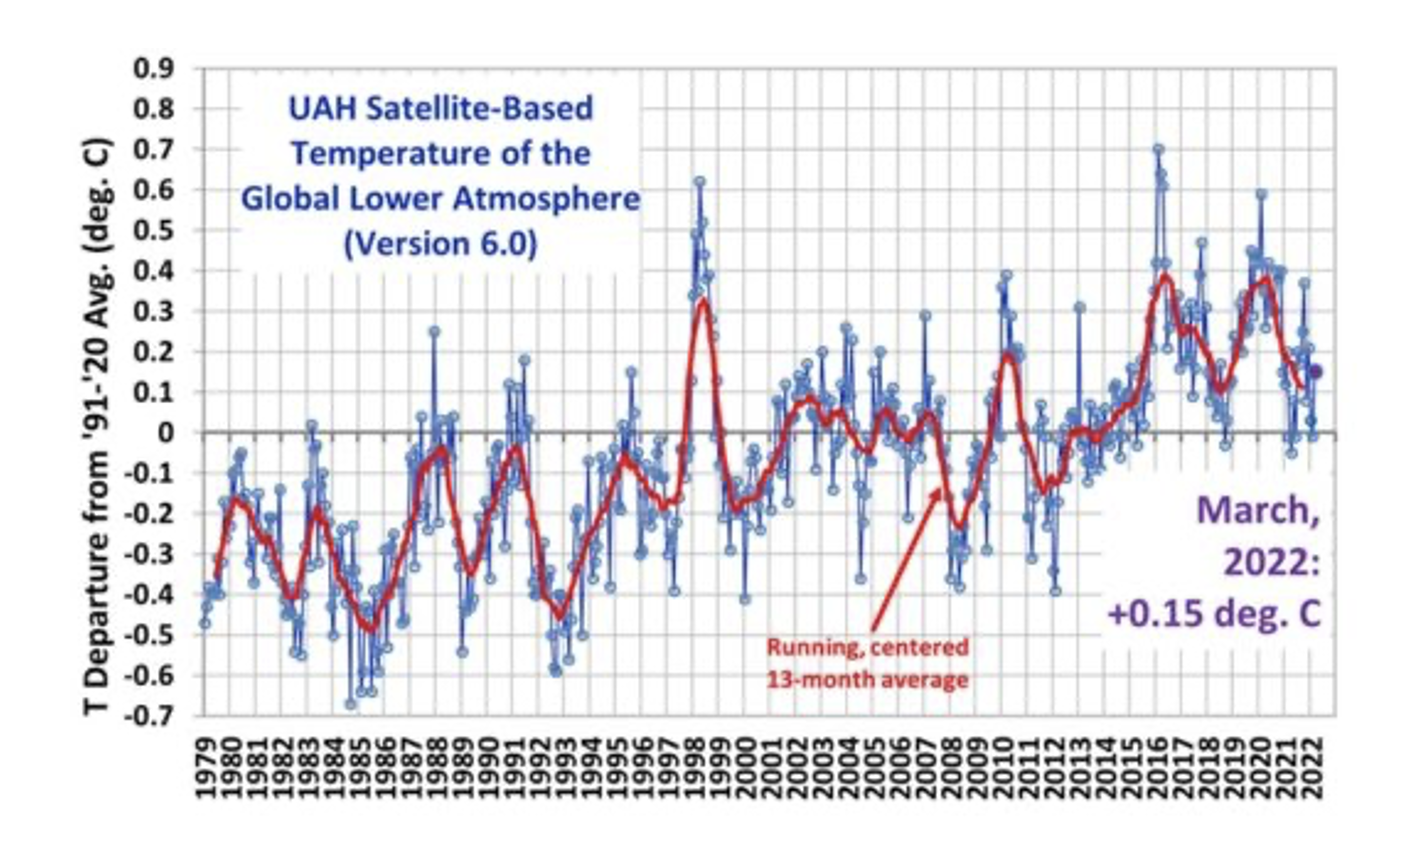
One place where the pause is still with us is the highly accurate satellite record.
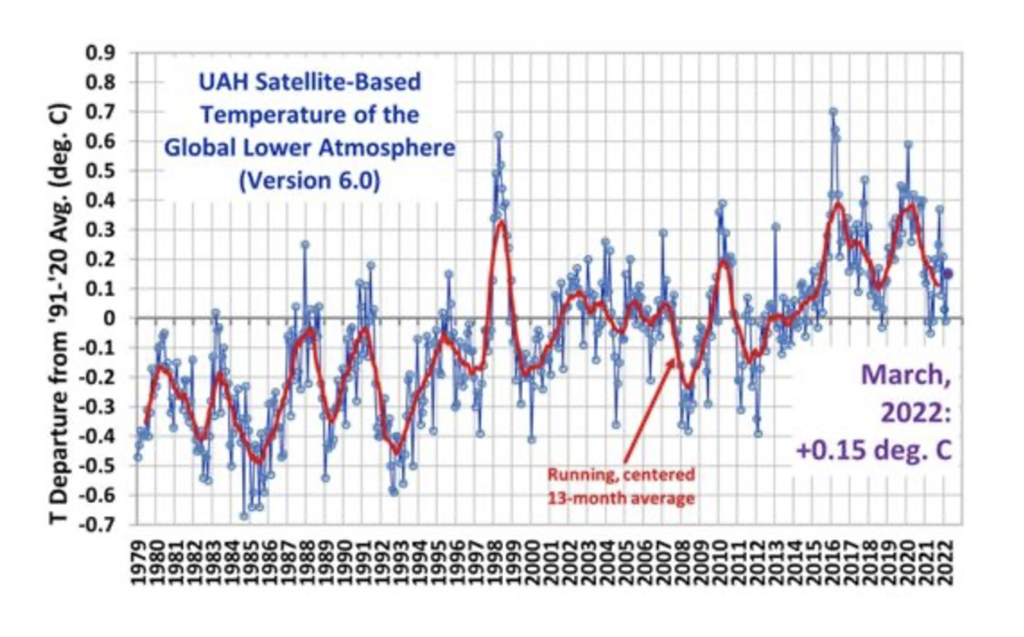
Between 1998 and 2012 there is clearly no increase in the global temperature. And as we have noted in a number of recent articles, the Earth is currently in another pause, this time lasting around 90 months. There are spikes from the mid-1990s caused by the powerful weather fluctuations starting in the tropical Pacific and known as El Nino and La Nina. The large upward spike in 1995 was caused by one of the largest El Ninos on record. Similar El Nino spikes are seen in 2009, 2016 (also very powerful) and 2019. Downward pushes are often caused by the effect of La Ninas.
It might be concluded that the awkward temperature pauses are the elephants in the room, so far as Net Zero activists are concerned.
But as Groucho Marx said: “One morning I shot an elephant in my pyjamas. How he got in my pyjamas, I’ll never know.”
Chris Morrison is the Daily Sceptic’s Environment Editor


To join in with the discussion please make a donation to The Daily Sceptic.
Profanity and abuse will be removed and may lead to a permanent ban.
“At the time, many climate alarmists were worried about the pause in global temperatures that set in from around 1998. The carbon dioxide scare was becoming a potent weapon in the drive to introduce a control and command economy characterised by an agenda now called Net Zero. Scientists have spent decades trying to prove a constant link between C02 emissions and temperatures, but to no avail. In the absence of actual proof, climate models guess that doubling C02 in the atmosphere will lead to a rise of up to 6°C. As a result, their forecasts have long lost any semblance of reality in an era when global warming has run out of steam.”
Strange thing to worry about.
Do the alarmist predictions from the likes of the IPCC and the Grantham Institute in fact actually have any more credibility than the computer modelling from discredited computer modeller Neil Ferguson?
Less credibility, as they’ve been lying for much longer
This epoch is called the Adjustocene. This allows activists to change historic and future temperatures to keep in line with the narrative.
That’s analogous to Bill Gates being sad and disappointed that Omicron has done a better job of being a ‘vaccine’ than the ‘vaccines’.
The Steve Coonan book is worth reading if you are sceptical about the climate agenda. When will we get a minister of statistical manipulation?
The late, great Christopher Booker would have made a good one. I think he wrote a book on group think, scare stories and the like. Other ministers required: a minister for men and inequalities; a minister for unintended consequences; and of course a minister for fisheries!
Not to mention a minister for HMRC who often appear like an out-of-control vehicle, applying tax law without reference to anyone but themselves.
HMRC: “Screw the population for every penny you can get away with while Billionaires go Tax Free “.
This when Johnson talks fatuously of ‘levelling up’ when he actually means “levelling up for Billionaires” by snatching all our money and “down into the gutter” with the drugged, Schwabian plebs!
If you taxed all the billionaires ‘fairly’ it wouldn’t make a jot of difference to anything.
If you you despise billionaires so much, the solution is to stop handing government subsidies out. That’s how they become billionaires.
How the UK Income Tax system works
10 men in a bar decide to settle their £100 weekly beer bill in roughly the same way as we pay our taxes:
– so the first four men, the poorest, paid nothing
– the fifth paid £1
– the sixth paid £3
– the seventh paid £7
– the eighth paid £12
– the ninth paid £18 and
– the tenth man, the richest, paid £59
Then the barman decided to give them a £20 discount for being such good customers. The group wanted to continue to pay the new £80 bill the same way as before. While the first four men still drank for free, the other six divided up the £20 windfall by following the progressive principle of our tax system:
– so the fifth man, like the first four, now paid nothing – a saving of 100%
– the sixth paid £2 instead of £3 – a saving of 33%
– the seventh paid £5 instead of £7 – a saving of 29%
– the eighth paid £9 instead of £12 – a saving of 25%
– the ninth paid £14 instead of £18 – a saving of 22% and
– the tenth paid £49 instead of £59 – a saving of 17%
The men then began to compare their savings. “I only got £1 out of the £20” declared the sixth man. He pointed to the tenth man, “but he got £10; the wealthy get all the breaks!” “wait a minute“ said the first four men, “we didn’t get anything at all. This new system exploits the poor.” So the other nine men surrounded the tenth man and beat him up. The next week he didn’t show up for drinks, so the nine sat down and had their beers without him. But when they came to pay, they discovered they didn’t have enough money between them to pay even half the bill.
QED
Levelling the rest of us…
There only needs to be one levelling up, and that’s a flat % tax rate across the board, e.g. 30%, with a decent tax-free threshold for the lower paid, applicable to income and capital gains, and the closing of the vast array of loopholes. In other words, abolish the vast majority of the tax code. That would also vastly simplify the Inland Revenue’s job and greatly reduce its cost to us. It would also save SMEs a fortune in Accountants fees.
If this is the one you mean, his book, co-authored with Richard North, was called “Scared to Death”, and debunked many of the false ‘scares’ that have been set up over recent decades. I have it, and read it.
One of them was concerning asbestos, which comes in 2 completely different forms, the long-fibred ‘blue/brown’ variant, which is dangerous and causes asbestosis, and the short fibred ‘white’ variant, normally encased in cement, which is virtually harmless, yet because of the common name, are treated as equals. I remember when we had our extension built, we had a white asbestos/cement cold water tank removed intact from the loft by a firm of specialists, who wore full hazmat suits and breathing apparatus, and triple-bagged it in plastic. I asked why all the precautions, considering I’d been drinking water from it for 20 years! I also asked “What would become of it”? “Landfill” they said.
You just cannot make up stupidity.
Yes, that would be it. He covered the asbestos scam in his columns (and having read a lot of them in the last couple of decades I like to think I haven’t missed out on too much). I understand that the harmless variant was nonetheless used for profiteering. So much to learn from him that would be useful in assessing the past two years.
As a GCSE Maths tutor, I can tell you that teenagers are taught to display data in histograms (calculating frequency density), ‘stem and leaf’ diagrams, and boxplots, all of very arguable value, not just for everyday life, but not really necessary for A-level Maths either (and anything that is could be learned quickly at that point anyway). Nowhere in the syllabus are they taught how statistics can be used to mislead, eg stats used out of context (‘daily deaths’!), or used with no sense of proportion (eg ‘deaths’ rather than ‘deaths per 000 pop’) would be a start! If the misuse of statistics was taught as a topic from the age of eleven, people would be more able to understand how they’re being lied to. So of course the probability (probability’s taught quite well) of that happening is about the same as that of a pig flying past the window.
Strange but true, the idea of teaching how statistics can be misused has never occurred to me, nor have I come across it before. A very good point.
With our New Style Government of Lies, the only purpose of statistics is to mislead!
Definitely worth a GCSE subject in itself. Give me a government minister of misuse of statistics, and give it now! (Actually, didn’t they attempt something of the sort on government spending? Office of budget responsibility or something? I wonder how that went…).
Aren’t they planning to devote a GCSE to “natural geology” *or whatever they call indoctrinating people with the climate scare)?
P.S. Good morning!
As a maths tutor I am surprised that more people are not aware of the “False Positive Paradox” given that it is taught in GCSE Mathematics, albeit not under that name and only in the “Higher” level. It is titled “conditional probability”. (or a simple example of Bayes Law). Typical school exercises and maths questions revolve around two overlapping sets (“those who study French”, “those who study German”) of children in a school, and asks the question “what is the probability that Shamima studies German given that she studies French?” The arithmetic involved is essentially the same as needed to answer “what is the probability that somebody who tests positive for covid actually has covid given that the actual prevalence is 0.1% and the false positive probability is 5%?”.
As a (former) trainee maths/science teacher I was astonished at the level of bullying at teacher training college for teachers (and college staff) to accept and propagate to children the Anthropogenic Global Warming hypothesis. However, the pressure to conform to and introduce a “liberal-left” agenda was present throughout most other subjects, notably history and geography. The agenda was not just AGW but anti-racism, anti-capitalism, human rights and reparations for the slave trade, along with miscellaneous fear-mongering about pollution, population and health. One homework I had to set in a physics class was “draft a letter to your MP expressing your fears about cancer induced from overhead power cables”. (In my school days it was “calculate the magnetic field ten metres from a power cable”.) Maths and statistics especially tended to be “explain why you should not trust statistics from oil companies”. Overall, the message was “government good: private corporations bad”.
I wonder if it was ever suggested that the history of English slaves in North Africa should be on the agenda? Or that people should see what people like Phillip Day (not linked to the pharmaceutical industry) say about cancer?
Sherlock Holmes he say: “Crime is common. Logic is rare. Therefore it is upon the logic rather than upon the crime that you should dwell.” The teaching of Mathematics, Statistics, Science, and History really could be enhanced by complementary courses in the forensic aspects of these disciplines. I’m also willing to bet that many kids would enjoy this.
Don’t these people at Hadcrut and Goddard understand that these constant data revisions serve only to increase the lingering smell of rubbish around the whole exercise. Adjusting the data to fit the required result – this must be where the CDC and all the others learnt the trade of covid data manipulation
No. They have convinced themselves that the world must be saved, therefore they are doing these adjustments for the ‘right reasons’. The noble lie.
Just as their fellow scientists have done with Covid.
Nothing noble about it – sociopathic, elitist, psychopaths appear to have taken over the world!
‘Between 1998 and 2012 there is clearly no increase in the global temperature.’
Just a thought, would that be because there was nothing to cause any global warming, except for the sun, obviously?
‘After 1750 and the onset of the industrial revolution, the anthropogenic fossil component and the non-fossil component in the total atmospheric CO2 concentration, C(t), began to increase.
Despite the lack of knowledge of these two components, claims that all or most of the increase in C(t) since 1800 has been due to the anthropogenic fossil component have continued since they began in 1960 with “Keeling Curve: Increase in CO2 from burning fossil fuel.”
Data and plots of annual anthropogenic fossil CO2 emissions and concentrations, C(t), published by the Energy Information Administration, are expanded in this paper.
Additions include annual mean values in 1750 through 2018 of the 14C specific activity, concentrations of the two components, and their changes from values in 1750.
The specific activity of 14C in the atmosphere gets reduced by a dilution effect when fossil CO2, which is devoid of 14C, enters the atmosphere.
We have used the results of this effect to quantify the two components.
All results covering the period from 1750 through 2018 are listed in a table and plotted in figures.
These results negate claims that the increase in C(t) since 1800 has been dominated by the increase of the anthropogenic fossil component.
We determined that in 2018, atmospheric anthropogenic fossil CO2 represented 23% of the total emissions since 1750 with the remaining 77% in the exchange reservoirs.
Our results show that the percentage of the total CO2 due to the use of fossil fuels from 1750 to 2018 increased from 0% in 1750 to 12% in 2018, much too low to be the cause of global warming.’
https://journals.lww.com/health-physics/Abstract/2022/02000/World_Atmospheric_CO2,_Its_14C_Specific_Activity,.2.aspx
“Just a thought, would that be because there was nothing to cause any global warming, except for the sun, obviously?”
There are other causes, from variations in incoming cosmic radiation or much more likely variation in geothermal energy ouput (earths internal heat), most of which occurs below the oceans that cover 70% of the planet and wouldn’t be that obvious, it fluxes over time, seafloor spreading (which definitely is driven by internal heat) does likewise…
All governments, and the organisations they pay, lie. Who knew?
Yes, but now they lie all the time and for the darkest of purposes.
When will they publish all the research on the great danger posed by 5G radiation?
‘Between 1998 and 2012 there is clearly no increase in the global temperature.’
Just a thought……oops……apologies……of course…..’thinking weakens the team’……
‘It has long been accepted that the “greenhouse effect”, where the atmosphere readily transmits short wavelength incoming solar radiation but selectively absorbs long wavelength outgoing radiation emitted by the earth, is responsible for warming the earth from the 255K effective earth temperature, without atmospheric warming, to the current average temperature of 288K.
It is also widely accepted that the two main atmospheric greenhouse gases are H2O and CO2.
What is surprising is the wide variation in the estimated warming potential of CO2, the gas held responsible for the modern concept of climate change.
Estimates published by the IPCC for climate sensitivity to a doubling of CO2 concentration vary from 1.5 to 4.5°C based upon a plethora of scientific papers attempting to analyse the complexities of atmospheric thermodynamics to determine their results.
The aim of this paper is to simplify the method of achieving a figure for climate sensitivity not only for CO2, but also CH4 and N2O, which are also considered to be strong greenhouse gases, by determining just how atmospheric absorption has resulted in the current 33K warming and then extrapolating that result to calculate the expected warming due to future increases of greenhouse gas concentrations.
The HITRAN database of gaseous absorption spectra enables the absorption of earth radiation at its current temperature of 288K to be accurately determined for each individual atmospheric constituent and also for the combined absorption of the atmosphere as a whole.
From this data it is concluded that H2O is responsible for 29.4K of the 33K warming, with CO2 contributing 3.3K and CH4 and N2O combined just 0.3K.
Climate sensitivity to future increases in CO2 concentration is calculated to be 0.50K, including the positive feedback effects of H2O, while climate sensitivities to CH4 and N2O are almost undetectable at 0.06K and 0.08K respectively.
This result strongly suggests that increasing levels of CO2 will not lead to significant changes in earth temperature and that increases in CH4 and N2O will have very little discernible impact.’
https://www.sciencepublishinggroup.com/journal/paperinfo?journalid=298&doi=10.11648/j.ijaos.20210502.12
Stop the madness. Carbon is food. More co2 makes for record harvests, shrinking deserts, less suffering. Net zero is evil or greedy. Or both.
A former manager once described carbon as ‘the slut of the atomic table’, because it hooks up with just about anything.
Zero carbon is the brainfart of an imbecile with a marketing degree.
Reduce food and you reduce population – this principle has great appeal to psychotic Billionaires!
The take home message for me is that they have failed to “get it right” in previous models so why should we be any more confident that they have got it right now?
Perhaps we should wait for HadCRUT 6 or 7 or………
They’re offering apprenticeships too, for anyone who’s interested in making inconvenient deaths among the vaccinated disappear.
They seem fully staffed already!
Why don’t any of these statistics that they like to release have any perspective?
The amount of relative time that humans have existed on this planet is minute, how do these climate activists explain all the times the earth has cooled and heated, or had high/low carbon and high/low oxygen levels in the past?
Long before we came along and started playing with fire the planet has been doing it’s thing, will they be wanting to ban volcanoes next?
Theatre for the gullible
Green= Money making for the elites
I just wish that all these so called ‘experts’ would disappear from our lives We really don’t need them.
Yes, but the worrying irony is that they have decided that they don’t need us!
Who will rid us of these turbulent climeastrologers?
Hype-Dream: World’s Renewable Energy Storage Capacity Destined to Remain Totally Trivial
https://stopthesethings.com/2022/04/20/hype-dream-worlds-renewable-energy-storage-capacity-destined-to-remain-totally-trivial/
by stopthesethings
Stand for freedom with our Yellow Boards By The Road
Wednesday 20th April 5.30 to 6.30pm
Yellow Boards
Junction A321 Lower Wokingham Rd &
B3348 Dukes Ride
Crowthorne RG45 6NZ
Monday 25th April 5.30pm to 6.30pm
Yellow Boards
Junction A332 Windsor Rd &
A330 Winkfield Road,
ASCOT SL5 7UL
Stand in the Park Sundays from 10am – make friends & keep sane
Wokingham Howard Palmer Gardens
(Cockpit Path car park free on Sunday)
Sturges Rd RG40 2HD
Bracknell
South Hill Park, Rear Lawn, RG12 7PA
Telegram http://t.me/astandintheparkbracknell
Partygate lies;Covid Lies; Vax Lies; Mask Lies, Lockdown lies, Social Distancing lies, Ukraine Lies.Media Lies.
Net Zero & CO2 lies…………
A Government and Establishment of lies.
Time for the population to switch off the Lie Receptors?
From the abstract of the Weng Mei paper:
Furthermore, we demonstrate that this decadal-scale slowdown is not incompatible with the centennial-scale anthropogenic warming trend, which has been accelerating since 1850 and never pauses or slows.
It is a good paper with a really nice summary and discussion of the long standing debate over the warming “pause” . Their key point is that while the existence of a pause is highly dependent on what interval you use, on balance it is likely to be a real short term slowdown but in the longer term it makes no difference.
The issue here is really the big picture one. Or rather, the two big picture ones.
One. Also quoting the Weng Mei paper:
Measuring the current temperature accurately appears to be chaotic in the extreme, a situation that is never documented in most discussions of global warming.
Almost by definition, if you cannot agree on what the temperature was in the recent past then you have no business trying to predict what it will be in the future, yet the constant revisions to the data don’t seem to dissuade anyone in the field from doing so (or maybe it does but they just leave, rather than continue to publish).
Two. Because there’s no agreement that the pause happened at all there is also no agreed on physical explanation for why it stopped, if it did.
So there are really only two consistent sets of beliefs here:
As models depend on data sets, in both cases the conclusion is the same: insufficiently reliable information is available to make decisions.
Mike
Measuring the current temperature accurately appears to be chaotic in the extreme, a situation that is never documented in most discussions of global warming.
It is difficult but not chaotic. If you look at the big picture, there is a very high level of agreement on global average surface temperature change both between different analyses (HADCRUT, GISS, Berkeley, NOAA, Japan Met) (see the Wikipedia chart here) and between different releases of those analyses (HADCRUT3,4,5 etc). See the chart here for comparison of HADCRUT4 and the two versions of HADCRUT5. What you do have is a continuous process of review and improvement which includes extensive discussion of the weaknesses of different approaches and the justification of the changes (see the websites of the relevant institutions).
The “pause” is a relatively minor feature in the big picture (just look at the charts). It is hard to decide whether it is statistically significant – hence the debate. And if it is significant, it might be explained by something as marginal as a change in SST processes.
The pause was real yet not predicted, and therefore even after decades of research climate models are not fit for purpose.
Just because there was a statistically significant but relatively minor feature that was not predicted it does not mean the climate models are not fit for purpose. In fact, contrary to the politically correct view on this site, they have been remarkably accurate. I quite like this video on the subject.
The pause wasn’t real yet was measured, and therefore even after a ~century of data collection and analysis efforts, climate data sets are not fit for purpose.
On the contrary, the debate shows how useful the climate data sets are. Without them, we would not even have known there was anything to debate. The debate is not about the measurements as a whole but about the significance of a relatively minor feature – a debate that is only possible given the overall solidity of the system.
Something as massively complicated as the climate model/temperature record system is bound to have its anomalies and glitches and is a process of continuous refinement and improvement but if you look at the big picture it has been a stunning success.
Off subject but not really as it’s about telling lies
Priti Useless was at her smirking best in the Commons as people went apoplectic about her Rwanda project
A story invented about something that will never happen intended to draw attention away from the current regional managers ‘problems’. I don’t believe even she believed people would fall for such guff
Back in about 2004 I wrote to my MP an email headed “The Web of Official Truth” and Parliamentary security blocked it – though she was good enough to retrieve it and reply. There no longer seems to be any area of public life which has not been re-modelled in parallel to reality. We should be very angry.
Blair was PM then wasn’t he, the remnants of that time are still in power
And no doubt Blair is too – a globalist hierarch with a special brief to screw the UK.
I agree, I would say we are targets and not just in the net zero stakes
For anyone not of a scientific nature thinking “well I can see temperatures are rising on the graph” do be aware that not only have the numbers been fiddled with, the graph is dealing in 0.1ºC increments. Mercury thermometers of the past were not this sensitive. Furthermore, modern digital thermometers measuring down to that accuracy fluctuate by the second. A warm or cool breeze would see temperatures spike.
This is recognised by the scientific community so digital thermometers are averaged out over a period of time, from 1 minute to 5(?) minutes, except in Australia where momentary max and min temperature spikes are recorded. Jennifer Marohasy exposed this entirely dishonest practice but has been stonewalled.
The satellite measurements (first graph) are measured in the lower troposphere. They are uncontaminated by by external influences like badly sited Stevenson screens, at airports for example where temperatures are much higher thanks to the passing jet exhausts and concrete. Temperature recording stations are also quite rare across the planet, mostly huddles across the northern hemisphere in North America and Europe. Africa and Russia, again for example, have thousands of miles between them so the numbers are guessed at between them.
It’s also worth remembering that the planet is 70% water. The Argo Buoy network is helpful but far from comprehensive.
The graphs themselves are also misleading as they are compressed along the X axis for convenience (they fit on computer screens). To make allowances, stretch your computer screen horizontally so it’s several metres wide whilst keeping the height the same. The temperature blips almost disappear.
For anyone who needs a bit of help understanding graphs.
The fact that a scale is calibrated in 0.1C increments does not mean the points on the graph are only accurate to the nearest 0.1C. A moment’s inspection will show that the points on the graph are at various places between the calibrations.
Any change in a vertical scale for any graph can be made to almost disappear by stretching the horizonal scale far enough. It is a meaningless transformation.
In any case, I am pretty sure that the surface temperature graphs were not created by the Met Office or UAE. The data comes from UAE but I cannot see any graph like that on their web site.
Lies, damned lies, and “global temperature” statistics. The stats were always being fiddled, but at least they used to try and hide it, but now they are openly fiddled because they know anyone who cares, already knows.
Amazing that all those fiddling the figures want their own lives trashed
All explained perfectly well in 1984, when the previous truth was changed to fit the current truth.
Know doubt the “new” updated data will be itself updated in the future and the original data will be forgotten.
Do you mean covid 1984 or the Orwell book?
This article is rather incomplete without the official reasons for adjusting the past temperature records.
Au contraire. The second sentence notes, “no doubt for sound scientific reasons”.
If you want more, I suggest you consult the BBC and Guardian – they are full of such sound scientific reasons.
If scepticism has a purpose then it’s finding the truth. If we’ve already made our minds up and don’t assess the evidence, we might as well read the BBC or the Guardian, because we’d be acting in their image.
Absolutely. Morrison is just assuming the adjustments were done to hide the pause.
Cooler past and a warmer present suggests greater temperature rise than actually took place. Given that the LIA was the coldest the planet has been for 2000 years, a one degree C rise since then should be welcomed, rather than the cause of mass we’re all going to die the planet heat death hysteria we are witnessing….
Also any warm spikes should be welcomed, given the planet has been cooling for c7K years … this interstadial has followed the pattern of previous ones, rapid warming, then gradual cooling until the next full Ice Age.
Climate is cyclical. Nothing we are experiencing has NOT happened before. Except this outbreak of hubris…
NEW PODCAST
Ep 48. Do YOU Really Care About Partygate?
1. ‘PartyGate’ and Boris’ chances of survival.
2. Hypocrisy of Stamer’s Labour.
3. Heroes and Villains
4. Energy crisis
5. Curry
6. Kultur Klub
7. Awful songs and much much more!
https://therealnormalpodcast.buzzsprout.com/1268768/10471086-ep-49-do-you-really-care-about-partygate
No doubt for sound scientific reasons – no, no and thrice no!!
Prince Charles, aka Climate Change Charlie, will be along in a few minutes to explain why his regular forecasts of apocalyptic doom in 10 years from now
must be taken seriously, even after ten years has passed, on multiple occasions, without anything happening.
HADCRUT temp record is a shambles….
https://robert-boyle-publishing.com/product/audit-of-the-hadcrut4-global-temperature-dataset-mclean-2018/
https://www.mediafire.com/file/xb7dhq1c1r1gnfm/McLean_2018-Audit_of_HadCRUT4_dataset.pdf/file
If you accept water vapour as a gas, the damming of rivers and water not getting to its historic places, no evaporation there, therefore no rain where it used to fall, water evaporating from other areas and causing excess rainfall in other places and floods where they never were , maybe the absence of a gas is more the problem,
“In the absence of actual proof, climate models guess that doubling CO2 in the atmosphere will lead to a rise of up to 6°C.“
In fact there have been numerous calculations of the value of climate sensitivity since 2000.
Naturally the ‘Usual Suspects’ are remarkably silent on this aspect of climate research.
It is interesting to consider the results of extrapolating the TCS and ECR trend lines out to 2025 – 2030.
“TCS and ECR” should be “ECS and TCR”!