
The Atlantic hurricane season has come to an end, and the global warming believers have been looking for records to ascribe to global warming. According to a NOAA news report, the end-of-season flourish of cyclone activity was as predicted, and a record for the period. The BBC Weather commented that the activity corresponded with Atlantic sea surface temperatures (SST) in 2024 being 1°C above the 30-year average (1991-2020) – a year which notably began with a warm Pacific El Niño event. Warm sea surface temperatures are of course an important factor in the development of tropical cyclones, but not the only one: for example, weak wind shear in the upper troposphere is also necessary for organised hurricanes to develop.
The increase in the North Atlantic sea surface temperatures is usually considered a feature of the Atlantic Multidecadal Oscillation (AMO), sometimes referred to as a variability (AMV). However, one notable climate scientist, Michael Mann, has tried to dismiss the AMO by flattening the historic curve so that the warmer ocean and increased hurricane activity becomes attributable to global warming instead.
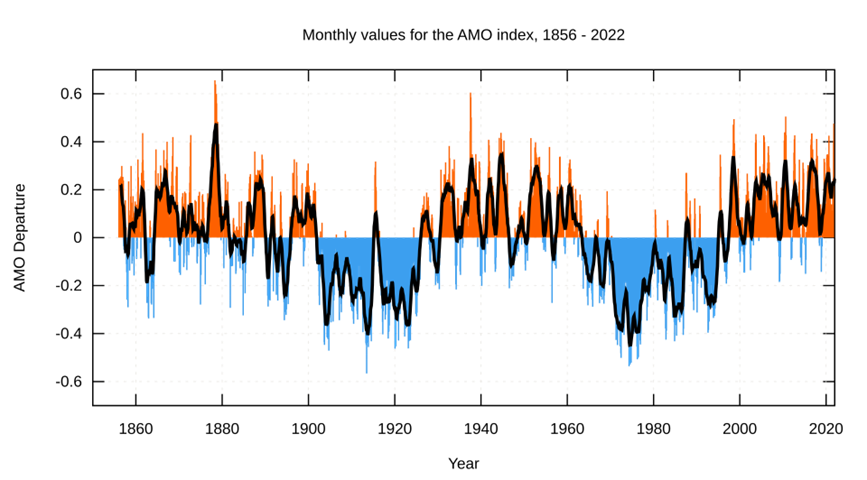
The impact of the natural AMO on the climate was briefly discussed in a recent article, along with a discussion of other factors such as changes in the El Niño Southern Oscillation (ENSO), volcanic activity and air pollution. The AMO, which is measured between the equator and 70°N, is arguably more influential on the global climate than ENSO, because of its longer duration. It leads to annualised variation in sea surface temperatures of up to 0.8°C over a period of about 60 to 80 years. During the 1970s there were fears of the return of an Ice Age as Atlantic Ocean waters cooled. Then from the mid-1990s onwards a recovery in the Atlantic sea surface temperatures was observed. This correlated with and contributed to the rise of the global warming narrative. The transition from the cold to warm phase of the AMO also occurred at a time when detailed satellite measurements of several climate parameters became available. The AMO index has continued positive since.
Scientific thought suggests that changes in the AMO are associated with variability in the Atlantic Meridional Overturning Circulation (AMOC). This larger scale current, which is part of a global thermohaline circulation (a slow-moving system of ocean currents), initially carries warm surface water northwards from the Caribbean Sea. As the water gathers near Greenland it cools and sinks due to an increase in water density. The very slow current then flows as a deep ocean stream to the South Atlantic, before rising back to the surface and completing the circulation via a northward return flow to the equator. The whole process takes about 1,000 years. (The AMOC has also been in the news recently because of fears it might collapse the Gulf Stream and lead to colder winter weather across the U.K.)
Comparisons of the AMO index against the lower atmospheric temperature (from Dr. Roy Spencer’s UAH V6.0 satellite temperature dataset from 1979) shows a correlation between the two. Given this apparent connection to global temperatures, a number of research papers have tried to put a figure on the actual influence of the AMO upon the climate. A paper by Tung and Zhou in 2013 suggested that its influence on global warming was of the order of 40% over a 50-year period, i.e., it explains nearly half of the warming trend. The anthropogenic (human-caused) temperature increase is then given in the paper as less than 0.5°C over this period. Chylek et al. in 2014 suggested a slightly lower percentage, arguing that about one third of the warming since 1975 was caused by the AMO. The paper commented that: “The anthropogenic effects account for about two thirds of the post-1975 global warming with one third being due to the positive phase of the AMO.” So, from this we have an approximate warming contribution from the AMO of 33% to 40% by 2014.
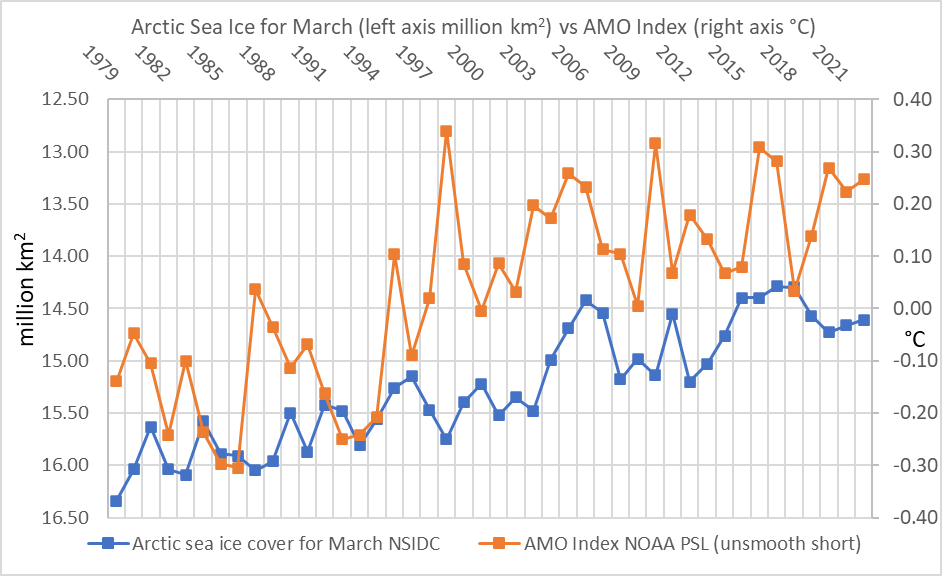
Some of the recent global warming then is a feature of the naturally occurring AMO. The AMO is also believed to be a driver of changes to regional weather and climatic conditions in the northern hemisphere, particularly in relation to Atlantic hurricane activity, droughts in Europe and North America, loss of sea ice in the Arctic, and ice melt on Greenland. In 2018 Li et al. commented that: “The Arctic sea ice cover has been rapidly declining in the last two decades, concurrent with a shift in the… (AMO) to its warm phase around 1996/1997.”
But does the AMO actually exist?
Given the significance of this oscillation as an explanation for such things as hurricane frequency and the extent of Greenland and Arctic ice, you might think it is inconvenient for the global warming fear narrative — and you would be right! For this reason, the oscillation has been undermined by at least one leading climate scientist. The AMO was first described by scientists in the 1980s and 1990s; the term “Atlantic Multidecadal Oscillation” being coined by Michael Mann in 2000. Mann of course is well known for playing a part in the development of the ‘hockey stick‘ global temperature graph, showing a steady historic temperature followed by a recent precipitous rise. The evidence of historical warm periods was removed, which had the effect of making recent global warming look more worrying. Mann, who is Professor of Atmospheric Science and Director of the Earth System Science Centre at Pennsylvania State University, has subsequently tried to deny that the AMO even exists as a natural oscillation. This again has the effect of flattening the historic curve.
Instead, Mann thinks the oscillation is caused by other factors, especially human activity in recent times, and in 2014 Mann in conjunction with colleagues produced a paper to make their case. The authors argued that historical changes to Atlantic sea surface temperatures in the past century have been caused primarily by warming greenhouse gases, offset by industrial sulphate aerosols that caused cooling but were subsequently cleaned up. Therefore, the amplitude of the AMO should in fact be considered weaker than previously thought, so that the “true AMO signal, instead, appears likely to have been in a cooling phase in recent decades, offsetting some of the anthropogenic warming”.
Mann’s claims were criticised by Nic Lewis, who pointed out that the goal of the paper was to “overturn the current understanding of the AMO”. Following analysis of the claims and complex mathematical code, Lewis commented that “Mann’s case is built on results that do not support his contentions”. He says Mann’s claims are “illusory”, and only superficially compelling. Further, Lewis argues that Mann’s code doesn’t produce the stated results, instead it “produces different results from those shown in his accepted paper”.
In 2021 Mann and colleagues returned to the question of the AMO, this time looking for the cause of multidecadal changes during the past millennium, prior to industrialisation. The suggestion was that they were driven by volcanic forcing, so that “there is no compelling evidence for internal multidecadal oscillations in the climate system”. Mann commented: “My co-authors and I have shown that the AMO is very likely an artefact of climate change driven by human forcing in the modern era and natural forcing in pre-industrial times.” He believes this is the final nail in the coffin of the AMO.
With a degree of sarcasm Judith Curry replied in a lengthy article on her blog:
Wow. In one fell swoop, the pesky problems of the ‘grand hiatus’ in the mid-20th century, debates over the attribution of 20th century warming and the role of multidecadal internal variability, and the difficulty of attributing the recent increase in Atlantic hurricane activity to [anthropocentric global warming], all go away. Brilliant! Almost as ‘brilliant’ as the Hockey Stick.
She does not accept Mann’s anthropogenic and natural aerosol explanation as the main cause of the AMO, pointing to broader discussions and disagreements amongst climate scientists in this area. The complexity of possible causes, which are not well understood, has been ignored, she noted. As well as differences in ocean currents and the global circulation, changes in weather patterns and short-term climate variability also play a part, alongside possible forcing from solar activity and volcanoes. Furthermore, Curry doesn’t think Mann’s analysis is justified because it is reliant upon poor climate models “which are inadequate in simulating the AMO”.
Curry also sees the bigger picture and issues that are at stake. When differences in phases of the AMO are connected to such things as Atlantic hurricane activity, rates of Greenland ice loss and droughts in Europe and North America, then removal of the oscillation means that attribution falls to manmade climate change instead. Mann even admits in the Penn State press release that the outcome of his work is to make it easier to attribute increased Atlantic hurricane activity since 1995 to global warming. And yet leading authorities do not fully agree with Mann: the U.S. National Oceanographic and Atmospheric Administration (NOAA) still acknowledges the link between the naturally occurring AMO and hurricane activity since the mid-1990s.
Summary
Attempts to flatten the AMO curve are not convincing, particularly for climate realists. But Mann’s hypothesis is anyway not fully accepted by the wider scientific community. With that in mind it is evident that a good fraction (perhaps one third) of recent global warming is most likely due to the natural multidecadal cycle, thus lowering estimates of climate sensitivity to greenhouse gases. The AMO also influences regional changes in the weather and climate, such as Atlantic hurricane activity, rates of Greenland ice loss and Arctic ice cover. Because of this it is difficult to attribute these patterns to anthropogenic global warming.
Having enjoyed some mild winters in the U.K. in the last few years, the AMO is now due to transition back to a cold phase sometime within the next 10 years, even if we should be sceptical of claims that the Gulf Stream will collapse. Either way, this is not a good time to abandon energy security by transitioning away from reliable carbon fuels to intermittent solar and wind power requiring expensive backup facilities. Northwest Europe may be facing several decades of colder winters ahead, just as we move towards Net Zero. But are our political rulers paying attention to important details such as this?
Andrew Sibley is a semi-retired Chartered Meteorologist with an MSc in Environmental Decision-Making and an MPhil in Theology.


To join in with the discussion please make a donation to The Daily Sceptic.
Profanity and abuse will be removed and may lead to a permanent ban.
Let it go. The money people let it go. Like they say millionaires don’t believe in astrology but billionaires do. Let it go. We are moving into a time in the next fifteen years which will make these discussions seem like quaint reminders of a bygone age. They call it Vargtimmen, the time of the wolf. We have the senses and the abilities to fight. If you have become too domesticated then it is sayonara baby, see you on the other side.
What are you talking about?
This foggy period over Europe is exerting huge pressures, in terms of energy consumption and hospital admissions, This is not going to decrease you will have ever increaing rain in spiring and ‘summer’. And then a transition to a cold fog in August. The western side of Europe is probably going to become a lot more unpleasant in years to come. You an go down with the ship but it is hard to go down with the ship when you are completely depleted. Make plans now if you want to live. The weather can rob you of your energies and ambition very quickly.
I’ve smoked some pretty strong weed tonight… But please elaborate..
The Hockey Stick fraud made its appearance circa 1998 by Mann – then studying for Painter and House Decorator degree. It was based on tree rings and was revealed as a fraud within months by McIntyre and McKitrick amongst many others. The algorithms simply produced a hockey stick no matter than the inputs – GBP vs USD; Car #s vs Bikes.
As Mann wrote in the climategate emails, ‘the powers that be’ want the medieval warm and little ice age periods to disappear.
Mann is no more a scientist than the midget Italian Fauci is a doctor.
https://climateaudit.org/
It took McIntyre about 5 years to expose the Hockey Stick as being statistically flawed and therefore not a true representation of global temperatures over the previous thousand years. The reason it took so long was that Mann would not release, data, computer code or methodology so that his work could be checked. —-We should ask the question WHY?
Can you imagine Einstein coming away with General relativity but not letting the scientific community have access to his work so they could check it for themselves? Yet the IPCC, desperate for anything that would show humans have warmed the planet, made it their centre piece and it was all over IPCC reports and TV news.
What is coming is way worse than their prediction in February after full coverage of the fog canopy. I don’t deal in bullshit I am here to tell you that 2025 will be very different. If you are thinking of leaving the country then you probably can’t. If you have to stay here then just keep your ears and eyes open. I can’t help you anymore because you lack the ability to take anything seriously. It is a case of bye ye and don’t ask me for assistnce when the horrorshow really begins. I recognise the sincere characters.
How do you measure the “surface temperature” of the Atlantic?
Using satellite radiometers I believe.
Interesting; thanks. I had not heard of those. It’s not clear to me how many sampling points they would use, which is where the whole “average temperature” thing falls down for me.
What I read also suggested that they have to correct for a whole bunch of stuff so the measurements are massaged. I suppose if what you are correcting for remains constant over time then the change is real even if the actual numbers might not be.
There are a number of buoy based systems doing this. The Argo System is one version, 4000 plus buoys spread across the oceans that report the range of temperatures and salinity from the surface to a depth of 2000 metres by sinking and raising the sensors. Prior to these methods, earlier methods used ship based methods, one being a bucket over the side and another being sensors on water inlets used for engine cooling. The UAH temperature data mentioned reports at different atmospheric layers, not sure it would be said to be surface level temperature.
Thanks. 4000 sounds a lot but the ocean is huge. How do they know it’s not getting colder in the places they are not measuring?
The Argo programme has really only been running 20 years with floats mainly measuring profiles down to 1000m for 9 days. But it produces a much denser grid of profiles than the older manually lowered sampling buckets. Ship seawater inlet temperature measurements are subject to draught fluctuations of 6-18m between loaded and lightship draughts. The surface 10-30m profiles have the most significant effect on weather but the total volume of the worlds oceans is about 1.4 billion cubic km. With 1 cubic km having a mass of 1 billion tonnes. So there are some real limitations on accuracy and consitency in long term large area measurement.
We are a nation of sheep and someone else owns the grass
The news media are not independent; they are a sort of bulletin board and public relations firm for the ruling class — the people who run things.
Don’t just teach your children to read….Teach them to question everything they read. Teach them to question everything.
Life gets real simple once you cut out all the bullshit you learn at school.
I’ve set my own rules to live by. The first one is; never believe anything the government says.
If you vote and you elect a dishonest, incompetent people into office who screw you over, you are responsible for what they have done.
We don’t even know how to take care of ourselves….and we’re gonna save the fucking planet? the planet will be here for a long, long, LONG time after we’re gone, and will heal itself, it will cleanse itself, cause that’s what it does. It’s a self-correcting system.
George Carlin (1937 – 2008).
Looks like a malevolent cabbage patch kid.
Mann has been a very lucky recipient, of a burst of worldwide madness….luckily that madness is fading.
one notable climate scientist, Michael Mann,
I think not – a thin-skinned global warming activist more like.
This is what the face of an imposter looks like
Global warming – communisms greatest scam?
Green on the outside, red on the inside.
This bloke as got a face you’d just love to slap.. a wet slap at that!