Last month, the Daily Sceptic highlighted the practice at the U.K. Met Office of inventing temperature averages from over 100 non-existent measuring stations. Helpfully, the Met Office went so far as to supply coordinates, elevations and purposes of the imaginary sites. Following massive interest across social media and frequent reposting of the Daily Sceptic article, the Met Office has amended its ludicrous claims. The move has not been announced in public, needless to say, since drawing attention to this would open a pandora’s box and run the risk of subjecting all the Met Office temperature claims to wider scrutiny. Instead, the Met Office has discreetly renamed its “U.K. climate averages” page as “Location-specific long-term averages”.
Significant modifications have been made to the new page, designed no doubt to quash suspicions that the Met Office has been making the figures up as it went along. The original suggestion that selecting a climate station can provide a 30-year average from 1991-2020 has been replaced with the explanation that the page “is designed to display locations that provide even geographical coverage of the U.K., but it is not reflective of every weather station that has existed or the current Met Office observation network”. Under the new page the locations are still referred to as “climate stations” but the details of where they are, exactly, have been omitted.
The cynical might note that the Met Office has solved its problem of inventing data from non-existing stations by suggesting that they now arise from “locations” which may or may not bear any relation to stations that once existed, or indeed exist today. If this is a reasonable interpretation of the matter, it might suggest that the affair is far from closed.
Again we are obliged to the diligent citizen journalist Ray Sanders for drawing our attention to the unannounced Met Office changes and providing a link to the previous averages page on the Wayback Machine. The sleuthing Sanders has been on the case for some time, having discovered that three named stations near where he lives, namely Dungeness, Folkestone and Dover, did not exist. The claimed co-ordinates for Dover placed the station in the water on the local beach as shown by the Google Earth photo below.
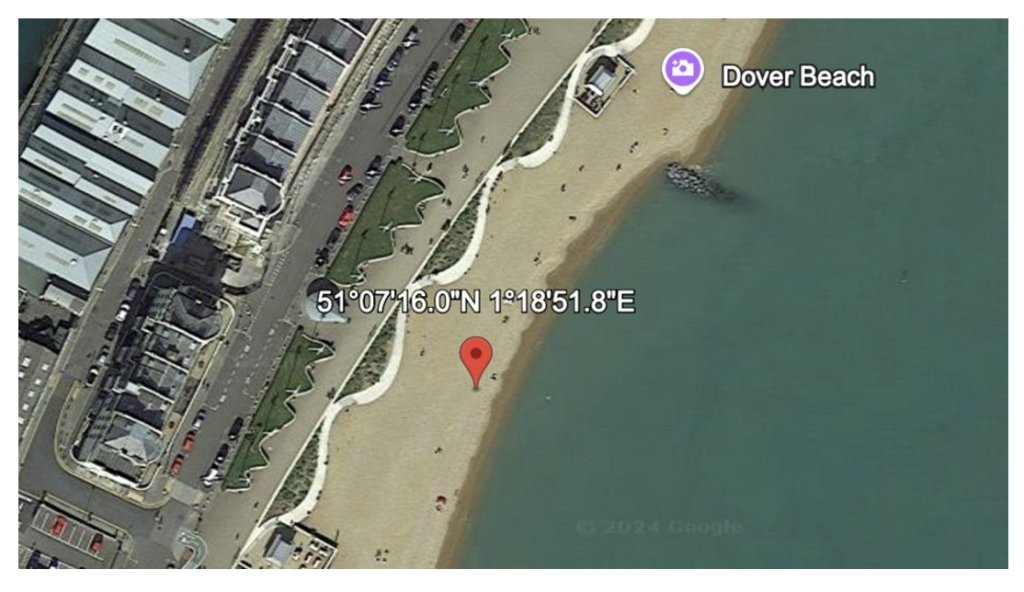
As a result, Sanders discovered from a freedom of information request that 103 of the 302 sites marked on the climate averages listing – over a third of the total – no longer existed. Subsequently, Sanders sought further information about the methodology used to supply data for both Folkestone and Dover. In reply, the Met Office said it was unable to supply details of the observing sites requested “as this is not recorded information”. It did however disclose that for non-existent stations “we use regression analysis to create a model of the relationship between each station and others in the network”. This generates an estimate for each month when the station is not operating. Each “estimate” is said to be based on data from six other stations, chosen because they are “well correlated” with the target station.
In the case of Dover, the nearest ‘station’ is seven miles away at non-existent Folkestone followed by Manston which is 15 miles distant. By “well correlated” perhaps the Met Office means they are in the same county of Kent. No matter, computer models are on hand to guide the way.
Ray Sanders had sent details of his findings to the new Labour science minister Peter Kyle MP and the recent Met Office changes may have been promoted by a discreet political push. At the time, Sanders asked: “How would any reasonable observer know that the data was not real and was simply ‘made up’ by a Government agency?” He called for an open declaration of likely inaccuracies of existing published data “to avoid other institutions and researchers using unreliable data and reaching erroneous conclusions”.
The Met Office also runs an historical data section where a number of sites with long records of temperature are identified. Lowestoft closed in 2010 and since then the figures have been estimated. The stations at Nairn Druim, Paisley and Newton Rigg have also closed but are still reporting estimated monthly data. “Why would any scientific organisation feel the need to publish what can only be described as fiction?” asks Sanders.
The original Braemar station in Aberdeenshire has recorded temperature data since Victorian times. Due to its interesting topography surrounded by high mountains, it recorded the U.K.’s coldest temperature of -27.2°C in both 1895 and 1982. In summer, the temperature can soar as the heat stays trapped. A new site, some distance from the original, was set up in 2005 and in common with Met Office procedure was labelled Braemar 2 to reflect both distance and climatological differences. In the historical data section of the Met’s website, Braemar 2 is shown supplying data back to 1959. “For reasons I find difficult to understand, the Met Office has chosen to highlight a spurious merging of two notably different data sets for an illogically defined period that fails to represent either site,” observes Sanders.
The recent changes made by the Met Office to its climate average pages shows that the state-funded operation is fully aware of the growing interest in its entire temperature recording business. This interest has grown because the Met Office is fully committed to using its data to promote the Net Zero political fantasy. But it is silent on the biggest concern that has been raised of late, namely the promotion of temperatures, accurate to one hundredth of a degree centigrade, obtained from a nationwide network where nearly eight out of 10 stations are so poorly sited they have internationally-recognised ‘uncertainties’ as high as 5°C.
Chris Morrison is the Daily Sceptic’s Environment Editor.


To join in with the discussion please make a donation to The Daily Sceptic.
Profanity and abuse will be removed and may lead to a permanent ban.
Greenhalgh, it would appear, starts with the answer, then works backwards to find out how to phrase the question.
Well put.
Not unlike the starting conclusion that manmade CO2 emissions cause warming aka climate change, and they are still searching for the elusive proof 30 years on!
Why is “reducing the spread of respiratory viruses” a good thing? Reducing from what to what? Over what time period? In what way does it improve overall quality of life? Does it increase life expectancy? Let’s say that through mask wearing, social distancing and “vaccinations” we completely eliminate respiratory viruses. What would be the consequences of that to health?
In addition, what kind of insanity thinks it is possible to eliminate any or all respiratory viruses? There are a few and they all mutate all the time and are airborne.
Absolutely ss!
Apparently the same insanity that thinks the U.K. reducing their CO2 emissions will save the whole world.
And they call us the fruitcakes and loonies.
If you believe in viruses then presumably everybody will be exposed to them, other than perhaps diseases that mostly kill the host. Far better to encourage people to be as healthy as they can than to fiddle around with some insignificant measure to “reduce the spread” (which surely has to be slow the spread rather than reduce it, at best).
Regardless of their efficacy, I have yet to see anyone use a mask properly.
Most will take some scruffy item out of a pocket or handbag, donning it as they enter the environment they are frightened of.
Whereas, they should be washing their hands before removing it from its sterile packaging, putting it on without fiddling with the mask itself, then washing their hands again and then repeating the process in reverse before disposing it in a suitable receptacle, remembering it is actually a potential bio-hazard.
One major giveaway that all this was theatre – there were zero instructions or protocols or anything about what to do with used masks. There were zero bio hazard bins anywhere outside hospitals In addition there were zero protections given to refuse collectors considering they would be in close contact to hundreds or thousands of used masks. It was also strange (or not) that there were no higher death rates among refuse collectors.
I smelled the rat when they said a mask made from a t-shirt, or a scarf across your face would suffice.
My own ‘rabbit-hole’ view is that someone on the BIT programme thought it would be an easy visual indicator of compliance… but, I should probably renew the foil in my hat!
Page 3 of this June 2020 WHO document talks about masks made from 12-16 layers of cotton…
… along with the warning “not for medical use” printed on the box
When the mandate came in I went to a haberdashers and bought gauze and elastic and made my own.
When the mandate came in I thought TC GTF.
What purpose did that serve, other than to comply in an individualistic manner?
I think it is a form of non conformity. Considering how many wore just a cloth face covering and nothing happened is useful evidence to hang onto for the next time this is triad.
In many professions good knowledge is shared and propagated easily so that almost anywhere on the planet there will be common understanding. I do not understand why it is not obvious to very ‘clever’ people that face masks were only for theatre and were worse than useless for preventing the spread of an airborne virus. Of course, the virus was characterised as being passed between people via droplets, and this assertion was pushed in a way that was very uncharacteristic of any professional group, and bore no relationship to any scientific discipline.
Please see the video below of Stephen Petty stating quite clearly why face masks will not work, and yet his presentation to a US Senate meeting has made no difference and has not been disseminated.
https://www.youtube.com/watch?v=aEwi_NUpk0k&t=169s
Stephen Petty, Expert, Industrial Hygienist gives solutions far more effective than masks
“We live in an unscientific age in which almost all the buffeting of communications and television-words, books, and so on-are unscientific. As a result, there is a considerable amount of intellectual tyranny in the name of science.”
R. Feynman
Re. the diagram.
I don’t believe that the size of the virus is relevant. I expect a fluid particle containing lots of viruses, water, etc. There is no reason why such a fluid particle couldn’t be smaller than the pore size.
In the video of Stephen Petty talking about health controls size is absolutely relevant. The droplet argument was intended as a justification for all the ludicrous personal restrictions including the masks and the 6ft rule. The fact that all respiratory viruses are airborne was supressed, and, we breath air not water. Stephen Petty explains quite clearly what the challenges are and what is possible and not possible, but it does require listening to what he has to say.
You could also ask if the UK Covid-19 Inquiry is starting from the answer…
Greenhalgh is seriously unbalanced (a modern day zealot). Not only do masks not work, they cannot work. They were designed to prevent liquid transmission not viruses. The Covid virus was at least 10x smaller than the gaps in the weave of the masks, never mind the fitting gaps.
The key point these zealot miss, is the immune system. Every day humans come into contact with millions of bacteria/virus etc which are countered by the immune system. Look after that and it will look after you.
Although immune systems fade with age, a person with good diet, exercise and sleep will be in a great position to fight off viruses. There were Drs in A&E covid wards who choose not to wear masks and yet they never caught it.
Masks were all about obedience and control.
I’d say it’s pretty simple. If an N95 mask or a face covering stopped you breathing in virus particles, it would also stop you breathing in air and cause you to suffocate and die.
Unless it’s a full face chemical warfare, fire brigade or meth lab style respirator, which nobody was wearing and we’re not talking about, face masks are nothing more than a splash guard.
Let’s see Trisha Greenhalgh’s financial records from 2019 onwards. Then we’ll know what’s what.
She could be Jim Davidson’s older brother. Uncanny…
https://www.youtube.com/watch?v=F46DhUqoJNQ
I never used them, and it seemed to me that it was like a cultural copy & paste tactic, as it has long been common practice for some workers on high density public transport, such as the Japanese metro system in Tokyo to wear such things. It fitted in with a typical “something must be done” attitude, grossly unscientific, with a bit of opportunism on top.
Have you ever read any of the “get out” labels printed on those so-called “masks” that were on sale. You needed a magnifying glass to read them, but they were there.
The label on the box of the one I bought said:
Fashion mask. Not a medical mask. Use for dust protection, sun protection, fashion.
I would no more cover my airways than any other form of self-harm. Snake oil.
Greenalgh personally admitted that her push for masking was never really because of COVID but because this was a cultural change she desired to force onto Britain ever since encountering widespread (or somewhat widespread) public mask wearing during a holiday in Japan. This means anything published by her to this effect is simply policy-based ‘evidence making’ by someone not willing to concede defeat yet.
There’s a medical term for her condition and it’s called mysophobia and there are also some less-than-flattering terms for her general bevahioural drive, namely, relentless egotism of an ageing babyboomer whose overriding concern is fear of her own, eventual death and who has thus long since passed her shelf-life as possibly useful member of society.
…policy-based ‘evidence making’
Superb phrase, whether original or not.
It’s not from me.
It was somewhat frequently used to describe all the – well – policy-based evidence making which was used to keep The Great Pandemic Show running during that time. Eg Chris Whitty’s (mock) shock disclosure that “Viruses mutate!” which came just in time to justify killing Christmas 2020 and go into the 3rd national lockdown from January onwards despite he had already known about the so-called Kent Variant since September 2020.
Correction: The “holiday in Japan” story was Susan Mitchie’s, not Trisha Greenalgh’s.
The whole face mask period for me meant that I couldn’t go on any public transport (not having transport myself), or into many shops, or visit friends, because I refused to get the clotshot, or flu jab, or wear a mask, even though the face mask period lasted a couple of years. It was hard for me to recognize people wearing the masks, so imagine the developmental damage it must have done to little children just learning about visual clues and facial expressions!
What surprised me the most was seeing people wearing masks even while walking outside in the fresh air along a country lane, or driving alone in their cars. I’m glad the madness has passed, and articles like this one by Dr. Roger Watson (nice friendly photo of him, DS) will help awaken people to never be fooled again.
Wasn’t she one of the trio who reported Aseem Malhotra to the GMC?
Snap.
Dr Greenhalgh was, it seems, one of the three doctors who used the coward’s mask of anonymity when they attacked the excellent Dr Aseem Malhotra by reporting him to the General Medical Council.
https://dailysceptic.org/2025/06/06/the-brave-doctors-who-stood-up-for-the-truth-about-the-covid-vaccines-deserve-an-apology/
So she clearly practised what she preached.
Ummm, what a dilemma you’ve put me in ; whether to trust Tom or Greenlagh?
Evidence & science is not a strong point of Greenlagh.
A pro-masker manipulating ‘data’ – surely not!