Earlier this month the Met Office declared the hottest day of the year so far in the U.K. with the temperature reaching 34.8ºC in Cambridge. The Met Office claimed it was only the eleventh time since 1961 that the temperature had reached that level, with six of these occasions having been recorded in the last 10 years. Needless to say, missing from the account was a note that the station in Cambridge’s National Institute for Agricultural Botany (NIAB) is located just metres from a massive heat-generating electricity sub-station complex.
Electricity sub-stations give off so much heat into the surrounding atmosphere there are even plans to trap it for commercial use. The Cambridge station at Histon has recently benefitted from a £5 million upgrade including the installation of a third heat-pumping transformer. It is difficult to think of a worse place to locate an instrument to accurately measure nearby uncorrupted air temperatures, other than favoured Met sites at international airports and solar farms.
Cambridge NIAB crops up regularly in the Met Office’s local daily ‘records’. Last year it claimed a recording at this site was the highest measured in the eastern region during September since 1949. The World Meteorological Office (WMO) rates Met Office sites from class 1 to 5 and Cambridge NIAB is said to have a pristine class 1 designation with no temperature ‘uncertainties’ due to local natural and unnatural influences. But how reliable is this superior rating? The view from Google Earth suggests that questions about its validity can legitimately be asked.
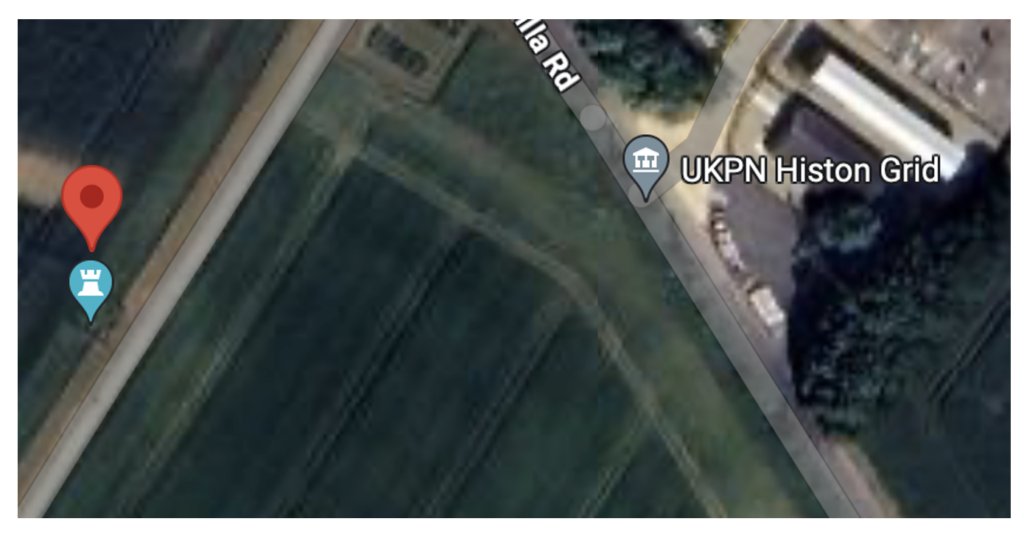
WMO guidelines state that any heat source in class 1 sites must be at least 100 metres away. But the google map above suggests that 100m is a very generous distance between the Histon grid and the red Met station marker. An even nearer straight line path or road might also not be considered helpful in taking an uncorrupted measurement. Recent expansion at Histon has added a third heat-pumping transformer to help increase capacity.
Electricity sub-stations release huge amounts of heat into the nearby surroundings. There have even been plans to capture the output from these ‘boilers’ for commercial use. In 2021, SSE Energy Solutions and the National Grid unveiled plans to use the heat generated to produce hot water and space heating for domestic and industrial premises. As Nathan Sanders, managing director at SSE, noted: “Electric power transformers generate huge amounts of heat as a by-product when electricity flows through them. At the moment, this heat is just vented directly into the atmosphere and wasted.”
Not entirely wasted, the cynical might observe. It serves to boost temperatures – highly useful for spreading political Net Zero panic and alarm – across the entire U.K. Met Office measuring network. As regular readers will know, this network is composed of largely junk stations in class 4 with WMO ‘uncertainties’ of 2ºC, and super-junk class 5 with possible errors up to 5ºC. Almost eight in 10 stations across the 380-strong network are labelled class 4 and 5. Many of these stations, such as the urban heat furnace that is Heathrow airport, produce regular daily ‘records’. Incredibly, the overall data is used by the Met to claim it can measure air temperature across the four countries of the U.K. down to one hundredth of a degree centigrade.
The Daily Sceptic is obliged to citizen journalist Ray Sanders for drawing our attention to the obvious corruptions at Cambridge NIAB. Ray is a frequent contributor to Paul Homewood’s blog, an excellent online publication that has long drawn attention to the obvious and widespread problems at the Met Office sites. Earlier this year, the Daily Sceptic broke the story that revealed most of the stations are junk following a freedom of information request. Interest in this scientific scandal is now widespread on social media, but it remains of little concern to mainstream media. Most writers captured by the lazy Net Zero narrative continue to tout the heat corrupted figures and ‘records’. To date, the Met Office has failed to respond to the growing critical interest in its obviously flawed temperature readings.
Heat corruptions caused by electricity sub-stations can be found at other locations used by the Met Office. Ray has also drawn our attention to the ‘notorious’ Bingley No 2 site, in use since 1972.
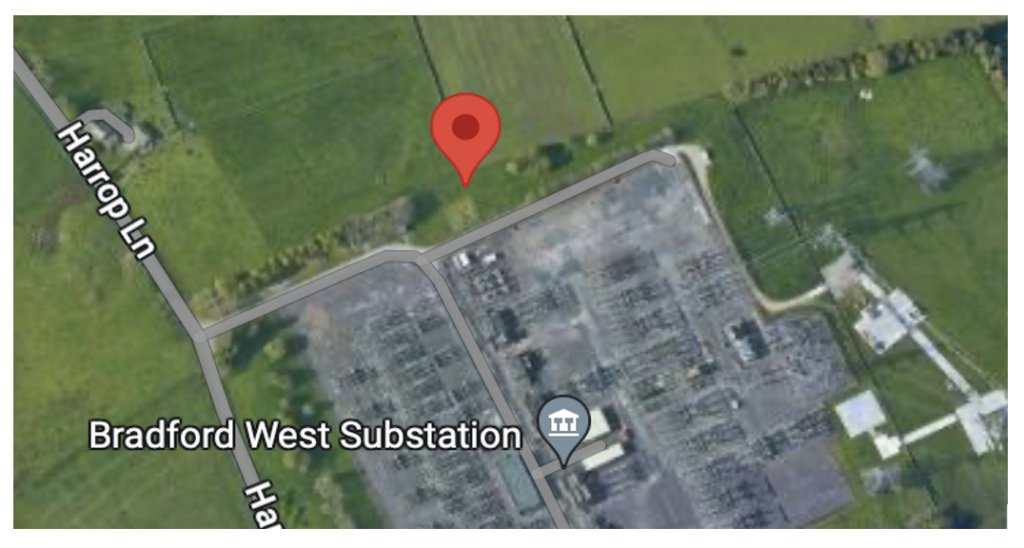
Again, it is just metres away from a major city sub-station. Unsurprisingly, in this case it has a class 4 junk designation.
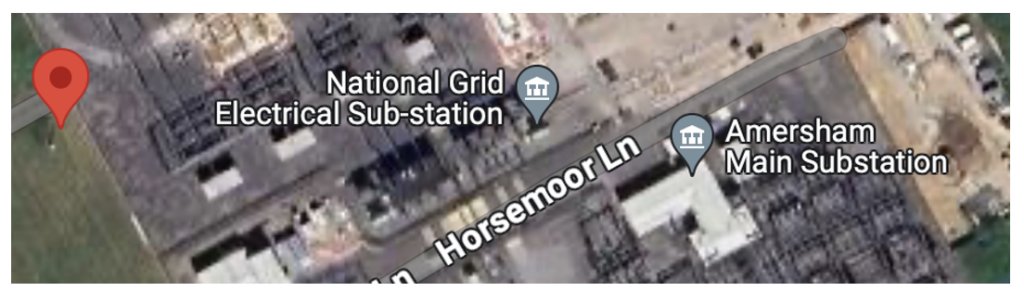
The final meteorological horror show can be seen at Amersham where temperatures at this class 4 site are again taken just a few metres away from the area’s main sub-station. This site is a new one, having been established in 2015. It begs the question why the Met Office continues to locate scientific measuring stations in such unsuitable places. Another recent FOI request has revealed that over eight out of 10 of the 113 stations opened in the last 30 years are in classes 4 and 5. Worse, 81% of the stations started in the last 10 years, including Amersham, are junk, as are eight of the 13 new sites in the last five years.
Chris Morrison is the Daily Sceptic’s Environment Editor.


To join in with the discussion please make a donation to The Daily Sceptic.
Profanity and abuse will be removed and may lead to a permanent ban.
Only 34.8°C? Just down the road in the city of Cambridge we got 38.7 back in 2019 (and 39.9 in 2022, the same day that the RAF Coningsby “record” was set). The site in the Botanical Gardens wasn’t in the city when it was established in the 1800s: the city and its office blocks gradually expanded to surround it. I wonder if that is connected with the way it shows temperature increasing over the last century?
https://www.botanic.cam.ac.uk/cambridge-university-botanic-garden-records-highest-ever-uk-temperature/
The measuring station is adjacent to a road. How hot does asphalt get on a Summer’s day? What are runways, apron strips and taxi ways paved with? Another favourite location for weather monitoring stations.
The Histon Met Office station also appears to be near trees, which will restrict the free movement of cooling air
Interesting to see that SSE (which is the DNO in my area) had a plan to sell spare heat that way. It reminded me of systems that exist in some parts of Europe that can do that, and in the old days there was just a setup around Battersea Power Station in London. Any attempt to develop that idea now would be difficult in the current housing market, though.
Near where I live, there was a housing estate built on a patch of “brownfield” land on which there used to be a coal fired station, with a similar substation right next door (that feeds my place and others), but of course all the houses have gas boilers. All built about 30 years ago, and they all have individual owners, more than likely.
As the concreting over of England accelerates to accommodate the needs of more and more people, this effect will distort temperature records even further. How convenient for the climate alarmists!
Examining the Google map in more detail, the measuring point is evidently to the west of the substation site, so often upwind of it with the prevailing wind direction, but also likely to be quite different with the opposite direction, given the suburban development close to the east. The latter may well disrupt the results when there is a cold easterly wind in open country. So it’s probably less accurate when we have a cold spell, with it appearing to be warmer than most of the surrounding countryside.
Everybody knows this has been a cool summer. We had the central heating on some days in June.
However: “The Party told you to reject the evidence of your eyes and ears. It was their final, most essential command.” – Orwell, 1984
If you examine the site further on google you will find that above the east-west axis it is ringed with buildings starting on the west with NIAB, then the sub-station and then some industrial units round to the east. Also does being next to a field that presumably goes through changes through the year and is part of a research farm?
Jim Dale says “climate change” is to blame for that yacht sinking near Sicily: Global warming linked to Sicily Yacht sinking: ‘Obviously climate change!’ says Jim Dale (youtube.com)
The owner was involved in some dispute or something that someone else was involved in who has also disappeared or died or something…
The Temperature Record of Earth has been fiddled about with more times than a prostitute’s knickers. You can tell the public anything about weather, climate and temperature and how many of them are ever going to look into it, check any data, or even realise the extent of this pseudo scientific fraud being used to transform their lives away from free markets that have given them the lifestyle, health and long lifespan they currently have into some global communist hell hole where technocrats will determine the standard of living they are to have? ——I suggest very few, because climate porn is fed to them on a daily basis, and they cannot comprehend a lie so enormous.
On the topic of climabollox, this is good: RAINMASTER_ALL: SINCE RECORDS BEGAN | PUBLIC HIGHWAY (public-highway.blogspot.com)
Meanwhile the Met Office don’t mention this:
Atlantic Niña: The Atlantic is cooling at record speed and nobody knows why | New Scientist
Electroverse – Documenting Earth Changes During The Next Grand Solar Minimum
Whatever is wrong at the met office? Why are so many taxpayer funded government agencies sooo in competent. One must ask, where are our hard earned taxes going? Way past time for taxpayers to ask for accountability. You do have that right folks.