Nearly one in three (29.2%) U.K. Met Office temperature measuring stations have an internationally-defined margin of error of up to 5°C. Another 48.7% of the total 380 stations could produce errors up to 2°C, meaning nearly eight out of ten stations (77.9%) are producing ‘junk’ or ‘near junk’ readings of surface air temperatures. Arguably, on no scientific basis should these figures be used for the Met Office’s constant promotion of the collectivist Net Zero project. Nevertheless, the state-funded operation frequently uses them to report and often catastrophise rises in temperature of as little as 0.01°C.
Under a freedom of information request, the Daily Sceptic has obtained a full list of the Met Office’s U.K. weather stations, along with an individual class rating defined by the World Meteorological Office. These CIMO ratings range from pristine class 1 and near pristine class 2, to an ‘anything goes’ or ‘junk’ class 5. The CIMO ratings penalise sites that are near any artificial heat sources such as buildings and concrete surfaces. According to the WMO, a class 5 site is one where nearby obstacles “create an inappropriate environment for a meteorological measurement that is intended to be representative of a wide area”. Even the Met Office refers to sites next to buildings and vegetation as “undesirable”. It seems class 5 sites can be placed anywhere, and they come with a WMO warning of “additional estimated uncertainties added by siting up to 5°C”; class 4 notes “uncertainties” up to 2°C, while class 3 states 1°C. Only 13.7%, or 52 of the Met Office’s temperature and humidity stations come with no such ‘uncertainty’ warnings attached.
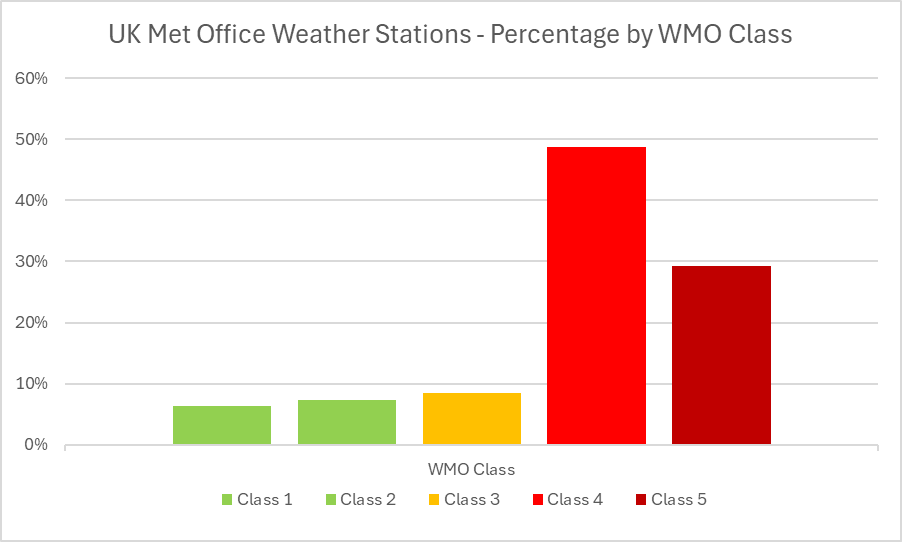
The above graph shows the percentage totals of each class. Class 1 and 2, identified in green, account for just 6.3% and 7.4% of the total respectively. Class 3 identified as orange comes in at 8.4%. The graph shows the huge majorities enjoyed by the darkening shades of red showing classes 4 and 5. It is possible that the margins of error identified for classes 3, 4 and 5 could be a minus amount – if for instance the measuring device was sited in a frost hollow – but the vast majority are certain to be pushed upwards by heat corruptions.
Last year, the investigative journalist Paul Homewood sought FOI information from the Met Office about the Welsh weather station Porthmadog, which often appears in ‘hottest of the day’ listings. He was informed that the site was listed as class 4 and “this is an acceptable rating for a temperature sensor”. Hence, continued the Met Office, “we will continue to quote from this site”. In short, observes Homewood, the Met Office is happy to use a class 4 site for climatological purposes, “even though that class is next to junk status”. It is bad enough that the Met Office is using this site, but it is even worse that they know about the issues but still plan to carry on doing so, Homewood continued. “How many other weather stations are of such poor quality?” he asked.
Now we know.
Using these figures with a precision to one hundredth of a degree centigrade, the Met Office declared that 2023 was the second hottest in the U.K., coming in just 0.06°C lower than the all-time record. Cue, of course, all the Thermogeddon headlines in mainstream media. In 2022, the Met Office said that five sites in the U.K. on July 19th went past 40°C, with a record of 40.3°C at RAF Coningsby. Kew Gardens is termed a class 2 site, although it is very close to one of the largest tropical glasshouses in the world. St James’s Park and Northolt airport are class 5 sites, Heathrow is class 4, while RAF Coningsby is class 3. At the time, the Met Office declared that the records set a “milestone in U.K. climate history”. A national record was also set on July 18th at Hawarden Airport in Wales (class 4) and on July 19th at Charterhall in Scotland (class 4).
Always alive to a popular headline catastrophising the weather, the Met Office declared a warmest St. Valentine’s night English record this year of 11.5°C at class 4-rated St. Mary’s airport on the Isles of Scilly. Earlier in the year, the Met Office declared the highest January temperature in Scotland at 19.6°C at Kinlochewe, a class 4 site. Interestingly the previous, much promoted, U.K. record was set on July 31th 2019 at the Cambridge Botanic Gardens, a class 5 site. Even more interesting is that in the Homewood FOI disclosures, the Met Office stated that class 5 data “will be flagged and not quoted in national records”.
The Met Office is between a rock and a hard place with these surface temperature measurements. Many of its long-standing stations have been encroached by urbanisation and corruptions seem to have become endemic across the entire system. In the past, this didn’t matter as much since margin of error allowances could be accepted along with less accurate local and national weather forecasting. Measuring surface temperatures across countries and then the planet is always going to be difficult, but a more accurate reading would be obtained by only using data from WMO classes 1 and 2. However, national and global temperatures have become politicised by the global warming scare and the proposed Net Zero solution. Alarmists often state that climate ‘tipping’ points will be reached with very small increases in temperature measured in tenths of a degree.
Using data from just classes 1 and 2 would likely crash the claimed rises in national and global temperatures. Something similar would likely occur if the Met Office moved the majority of its stations to more suitable spots. A number of scientists have tried to measure the urban heat bias in temperature records with estimates suggesting a general problem of warming corruption around the 20-30% mark. Last October, two scientists working out of the University of Alabama in Huntsville (UAH), produced a paper noting: “The bottom line is that an estimated 22% of the U.S. warming trend, 1895 to 2023, is due to localised UHI [urban heat island] effects.”
Under our FOI request, it can now be seen that the problems with corrupted U.K. weather stations are similar to those discovered in the United States by meteorologist Anthony Watts. In work compiled over a decade, Watts found that 96% of temperature stations used by the U.S. weather service NOAA were “corrupted” by the localised effects of urbanisation. Sites in close proximity to asphalt, machinery and other heat-producing or heat-accentuating objects, “violates NOAA’s own published standards, and strongly undermines the legitimacy and magnitude of the official consensus on long-term climate warming trends in the United States”, he observed.
Both the U.K. and U.S. temperature datasets are important constituents of global totals compiled by a number of weather operations including the Met Office and NASA. The Met Office runs HadCRUT, where over the last 10 years two retrospective revisions have added about 30% extra warming to recent global temperatures. This had the effect of removing all traces of a pause around 2000-2014. Meanwhile, Professor Ole Humlum has noted that the GISS database run by NASA increased its surface air temperature between 1910 to 2000 from 0.47°C to 0.67°C, a boost of 49% over this period. “Frequent and large corrections in a database unavoidably signal a fundamental uncertainty about the correct values,” commented Humlum.
Pristine temperature data is available. In 2005, NOAA set up a 114 nationwide network of stations called the U.S. Climate Reference Network (USCRN). It was designed to remove all urban heat distortions, aiming for “superior accuracy and continuity in places that land use will not likely impact during the next five decades”.
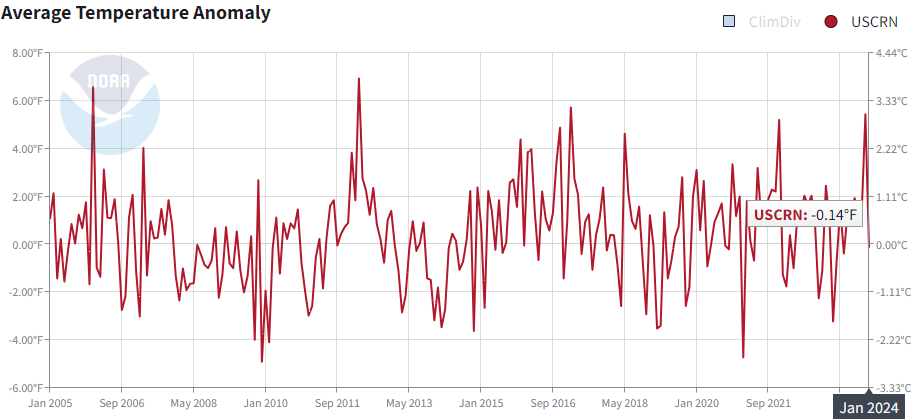
The graph above shows nothing more than very minor, gentle warming since 2005, slight warming that might be expected in the small and continuing natural rebound from the depths of the pre-industrial Little Ice Age. A reliable source of global data is to be found in the UAH satellite record, which shows less overall warming since 1979 than the surface datasets. Both these datasets are rarely mentioned. In fact one of the compilers of the satellite data, along with the UAH paper on urban heat, is Dr. Roy Spencer. In 2022 he was kicked off Google AdSense for publishing “unreliable and harmful claims”. The move demonetised Dr. Spencer’s widely consulted monthly satellite temperature update page by removing all Google-supplied advertising. Google is on record as stating that it will ban all sites that are sceptical of “well established scientific consensus”.
Chris Morrison is the Daily Sceptic’s Environment Editor.


To join in with the discussion please make a donation to The Daily Sceptic.
Profanity and abuse will be removed and may lead to a permanent ban.
The trees felled by more rural councils are mostly an obsession by safetyists with the miniscule risk of a tree falling in a storm and injuring someone. Those felled by city councils are more to do with the trees reducing the reach of the high band 5G essential for keeping track of people in the new ‘smart’ and 15 minute cities
Yup that sounds like the real reason when you consider a mature tree goes through thousands of times more carbon than a newly planted tree. Not that carbon is a problem, of course.
The asbestos example is a good one but so is the idea that we pretend to stop a little bit of warming which would if it was really true help to alleviate the 20 times more deaths that actually occur because of cold. All over the western world local governments and national governments compete with each other to see who can pretend to save the planet hardest and fastest, usually with the most hair brained costly schemes when there are serious issues that this money could be spent on. On a much bigger scale we in the wealthy west send billions of pounds and dollars to poor countries for some turbines and solar panels to bribe them into not using fossil fuels. The only fuels that can bring them out of the abject misery they face. Over a billion of these poor people don’t even have any electricity which wealthy people in Europe etc would never accept, yet we are telling these people that they should leave their coal in the ground because of global warming, something they have never heard of. What we are really doing with this nonsense is telling these people that they can never have electricity. —-This is not only absurd but a diabolical disgrace.
It reminds me of Labour Councils becoming “nuclear free” in the 1960s to 1980s. Presumably they had umbrellas to deflect the fall out and filters to make sure no nuke generated electricity reached their meters.
so it is now.
abolish agriculture, chop down trees and spread panels made from polluting chemicals all over them. And with no plan for dealing with broken and end of life panel material.
“In Plymouth last year the council sent in men with chainsaws in the middle of the night to chop more than 100 trees down”
These psychopath councils have gone beyond their remit. They should be prosecuted.
My personal theory why people are so keen on killing trees is that they just hate that these are taller than them.
There used to be a beautiful row of mature chestnut trees on the riverside front of former HMP Reading which was called Chestnut Walk because of them. During lockdown, the council had them all destroyed because “they were diseased”. They’ve planted new ones but I’ll never live to see this close lined with actual trees again.
In building sites it is routine for builders to obtain arboriculturalists’ reports which call for the destruction of healthy trees. Builders and most of their customers don’t like trees, whatever they say.
there is an obligation to enhance biodiversity but it is not practiced and no one seems to bother.
Don’t forget the devastation wrought by HS2 either, the concreting of middle England, to save a few mins on a journey from ‘somewhere outside London’ to ‘somewhere outside Birmingham’. If you can afford a ticket …
Headlines are important.
The headline to this article should be “Green Politics and Policies Damage Us and The Environment” or just “Greens Are Damaging the Environment“.
“Let’s Spare the Environment From the Greens” is too weak.
A local ‘Green’ made the mistake of stopping me on my way through our local market to harangue me about my green credentials.
He did not expect me to retaliate and he certainly did not practise what he was happy to preach to everyone else.
It gathered quite a crowd and enough support for my side to see him pack up and move away.